1. The study analyzed carbon emissions from logistics activities during supply chain disruptions using a case study of an automotive manufacturing company.
2. The analysis found that carbon emissions during disruption events increased approximately 18-20% compared to normal operations due to increased travelling distance to fulfill customer orders impacted by the disruptions.
3. Carbon emissions were calculated using two approaches - an activity-based approach using distance travelled and a energy-based approach using fuel consumption data. Both approaches showed higher carbon emissions during disruptions versus normal operations.
SUSTAINABILITY OF SUPPLY CHAINS IN COSTA RICA FOCUSING ON FREIGHT TRANSPORTAT...ijmvsc
This paper explores sustainability in supply chains in Costa Rica through an overview of the industrial
sector and identifies its most common characteristics. Moreover, relying on the carbon footprint indicator
and using estimates of the carbon emissions from a supply chain network, mainly associated with
transportation, arrives at the conclusion that they should be carefully examined to promote initiatives of
sustainability and to reduce the carbon footprint in accordance to the government’s intention to become
carbon neutral by 2021. Throughout the research it was found that the old rail infrastructure from the
central plateau to the ports is rather attractive to reduce carbon emissions. The paper also presents
options to achieve sustainability and points out challenges that must be overcome denoting the deficient transportation infrastructure as the most critical. The aim of this work is to call attention to the need to undertake a plan for freight transportation suitable to reduce emissions and secure sustainability.
Opportunity to reduce carbon content in supply chain thesis
This is my YouTube channel please visit, https://www.youtube.com/channel/UCzqDP4ePIIuZ42KbFMaRw1g?sub_confirmation=1
Evaluation and Analysis of Carbon Emission Efficiency of Logistics Industry i...ijtsrd
As Chinas Capital Economic Circle , the Beijing Tianjin Hebei region has an important strategic position. Carbon emission efficiency can be understood as the ratio of the unit of carbon emissions generated to the economic cost invested, and under normal conditions, carbon emission efficiency improvement means that the production cost is reduced while the carbon emission is kept unchanged or the existing production input base is maintained. Improving carbon efficiency is conducive to the sustainable development of the logistics industry. Based on the 2010 2020 panel data, this paper uses the emission coefficient method to calculate the carbon emissions of the logistics industry in the Beijing Tianjin Hebei region from 2010 to 2020, takes the carbon emission efficiency of the logistics industry in the Beijing Tianjin Hebei region as the evaluation index, constructs a super SBM model to measure the carbon emission efficiency of the logistics industry in the Beijing Tianjin Hebei region, and then evaluates and analyzes the carbon emission efficiency of the logistics industry in the Beijing Tianjin Hebei region. The results show that the overall carbon emission efficiency in the Beijing Tianjin Hebei region shows a slow upward trend, and there is more room for improvement, and finally according to the above conclusions, suggestions such as establishing green values, formulating reasonable policies and optimizing management systems are put forward. Yushou Han | Haochen Nong "Evaluation and Analysis of Carbon Emission Efficiency of Logistics Industry in Beijing-Tianjin-Hebei Region" Published in International Journal of Trend in Scientific Research and Development (ijtsrd), ISSN: 2456-6470, Volume-7 | Issue-5 , October 2023, URL: https://www.ijtsrd.com/papers/ijtsrd59980.pdf Paper Url: https://www.ijtsrd.com/other-scientific-research-area/enviormental-science/59980/evaluation-and-analysis-of-carbon-emission-efficiency-of-logistics-industry-in-beijingtianjinhebei-region/yushou-han
With the continuous development and application of modern logistics technology, logistics cost has become one of the important factors of enterprise competition. For the special field of cold chain logistics distribution, cost control is particularly critical. By studying the control method of cold chain distribution cost, this paper introduces how to reasonably optimize the distribution cost while effectively controlling the distribution cost so as to improve the competitiveness of enterprises. This paper sorts out the relevant theoretical overview and conceptual analysis and analyses the current situation of cold chain distribution cost control in logistics companies. Then, the existing logistics cost control system is evaluated, and the hierarchical analysis method and model comprehensive evaluation method are used to analyse the current control system score and problems that require additional attention and find the cause of the problem. Finally, rectification suggestions are put forward to improve distribution costs to enhance the competitive strength of enterprises.
Environmental Policy for Road Transportation: Greenhouse Gas Emissions and Ca...Shamsuddin Ahmed
This paper explores the efficacy of environmental protection in road transportation that produces greenhouse gas (GHG) emissions as a result of vehicle travel frequencies in a region. Road transportation deduces the highest contributor of carbon emissions coupled with human interventions in the economic growth sectors that rather bear a perilous condition in property management exclusively in urban settlements or impervious lands. An association among the selected variables where population erraticism echoes a basic determinant of road transportation for energy use and vehicle travels increasingly succeeds carbon-dioxide (CO2) emissions. Trends in regional gas emissions depict two pragmatic paradigms. First, at least four principal components are coherent and overriding in regional environmental protection to fulfil the common goal of measuring and monitoring climate smart land use. Second, a plausible land transportation policy pooled with environmental regulations is a complex one from economic development perspective as the higher the regional economic growth relates relatively higher GHG emissions in nature. It can be concluded that environmental protection from GHG is virtually regulated by three influences: population, energy usages, and vehicle travels which are deemed to be the spatial dimension of reducing global carbon emissions being caused from road transportation in a region.
Running Head TRUCKING SECTOR1TRUCKING SECTOR6.docxtoltonkendal
Running Head: TRUCKING SECTOR1
TRUCKING SECTOR6
Green Technology for Trucking Sector
Background Information
Heavy and medium-duty trucks play crucial roes in the economy of any nation. Trucking provides employment; influences usage of land; impacts commercial activities; and affects the prices of land as well as other commodities. According to research, the trucking industry in some countries is worth billions. The trucking industry also employs hundreds of thousands of drivers and provides livelihood to other parties that are not directly associated with the trucks (Abate & Road, 2014). Normally, trucking firms are made up of smaller companies that include carriers. There are varying levels of players in the industry from micro-trucking firms that employ from 1 to 4 employees to large motor carriers that employ more than 500 employees. In between these extremes, there are medium carriers. All these have a significant contribution to the carbon footprint.
Whilst the trucking industry bears significant amount of burden to the environment, it is a critical sector that holds the economy and livelihood of many. The industry involves many players from the drivers themselves to policy makers, support services, and government agencies. Striking an equilibrium in the industry core players at any given time determines how the industry runs and its key outcomes. One tough concern that has pervaded the industry over the years has been fuel economy and environmental management issues. Yet the number of goods required to be transported across borders and from one coast of a country to another has been increasing over the years. That means there is need for more trucks on the road igniting myriad environmental and climatic consequences. Ideally, safety, security, sustainability, and stresslessness should drive the trucking sector (O’Rourke, 2012). But with the current situation, it is only with a robust environmental friendly intervention that this can occur.
Over the years, pressures on the transport and logistic industry have been mounting. There has been pressure over environmental concerns so much so that governmental awareness on the same has led to increased pressure on key players in the industry. In addition consumers have also become more aware of the harms that logistics companies cause to the environment. As such, consumers have become demanding regarding green technologies and clean energy initiatives in the transport and logistic industry. In tandem with this change, it has become commonplace to have rising interest for streamlining operations for logistic companies. Firms that adopt greener technologies stand better chances of increasing their competitive edge (O’Rourke, 2012). Introduction of new structures for the logistics industry presents great benefits that may lead to better management of the environment.
Statement of Purpose
The purpose of this paper is to describe different factors that can influence the carbon ...
Research on the Current Situation and Promotion Strategy of Green Transformat...ijtsrd
On September 22, 2020, at the 75th United Nations General Assembly, China formally proposed the goal of achieving carbon peak in 2030 and carbon neutrality in 2060.Carbon neutrality is not only a national strategy, but also a national requirement for every enterprise. The goal of double carbon has put forward higher development requirements for the logistics industry, and vigorously promoting the development of green logistics has become an important path for Chinas logistics industry to achieve green transformation and upgrading. This paper starts with the analysis of the current situation of green transformation of logistics enterprises in Beijing, and puts forward countermeasures to solve the existing problems, so as to provide reference for promoting green logistics to achieve sustainable development goals. Lu Liuyi "Research on the Current Situation and Promotion Strategy of Green Transformation of Logistics Enterprises in Beijing" Published in International Journal of Trend in Scientific Research and Development (ijtsrd), ISSN: 2456-6470, Volume-7 | Issue-6 , December 2023, URL: https://www.ijtsrd.com/papers/ijtsrd60118.pdf Paper Url: https://www.ijtsrd.com/other-scientific-research-area/other/60118/research-on-the-current-situation-and-promotion-strategy-of-green-transformation-of-logistics-enterprises-in-beijing/lu-liuyi
IJRET : International Journal of Research in Engineering and Technology is an international peer reviewed, online journal published by eSAT Publishing House for the enhancement of research in various disciplines of Engineering and Technology. The aim and scope of the journal is to provide an academic medium and an important reference for the advancement and dissemination of research results that support high-level learning, teaching and research in the fields of Engineering and Technology. We bring together Scientists, Academician, Field Engineers, Scholars and Students of related fields of Engineering and Technology
A holistic approach to assessing the climate-positive effects of ICT.
A holistic methodology is necessary for assessing the potential reduction of CO2
e emissions. Life cycle assessment (LCA) is a well-established method and can be used for comparing emissions created in different scenarios. Standardized LCA methods can be used to identify solutions with the lowest CO2e emissions.
They provide society as a whole with the methods to assess a large number of possible solutions, to quantify the magnitude of potential reductions, and to show where these reductions could take place.
Development of a novel framework for the design of transport policies to achi...Araz Taeihagh
The formulation of policies requires the selection and configuration of effective and acceptable courses of action to reach explicit goals. A one-size-fits-all policy is unlikely to achieve the desired goals; as a result, the identification of a suite of alternative policies, together with clear indications of their trade-offs, is crucial to accommodate the diversity of stakeholders’ preferences. At present, the formulation of transport policies is done manually; this fact, together with the size of the space of possible policies, results in a large part of that space being left unexplored. A six-step framework to explore the space of alternative transport policies in order to achieve environmental targets is proposed. The process starts with a user-defined set of specific policy measures, using them as building blocks in the generation of alternative policy packages, clusters and future images according to the user's preferences and goals.The analysis framework is based on the visioning and backcasting approach used in the VIBAT report [Banister, D., & Hickman, R. (2006a). Visioning and backcasting for UK transport policy (VIBAT) project. Department for Transport's Horizons Research Programme 2004/06. The Bartlett school of planning and Halcrow Group Ltd. Retrieved 1/18/2008 http://www.ucl.ac.uk/∼ucft696/vibat2.html]. The framework is being implemented as a prototype decision support system around a case study: the formulation and analysis of policies required to achieve CO2 emission targets for the transport sector in the UK. Important insights on how to develop the framework have also been elicited from engineering design. The goal is to accelerate the task of policy-making and improve the effectiveness of the resulting policies.The proposed method and computer implementation is fundamentally different from the tools commonly used in the transport sector and is intended to assist (not replace) transport policy makers, and complement (not substitute nor compete with) existing mathematical modelling tools. This research constitutes the first step towards the development of a general family of computer-based systems that support the design of policies to achieve environmental targets—not only for transport, but also for other sectors such as energy and water.
Artificial Reefs by Kuddle Life Foundation - May 2024punit537210
Situated in Pondicherry, India, Kuddle Life Foundation is a charitable, non-profit and non-governmental organization (NGO) dedicated to improving the living standards of coastal communities and simultaneously placing a strong emphasis on the protection of marine ecosystems.
One of the key areas we work in is Artificial Reefs. This presentation captures our journey so far and our learnings. We hope you get as excited about marine conservation and artificial reefs as we are.
Please visit our website: https://kuddlelife.org
Our Instagram channel:
@kuddlelifefoundation
Our Linkedin Page:
https://www.linkedin.com/company/kuddlelifefoundation/
and write to us if you have any questions:
info@kuddlelife.org
More Related Content
Similar to A Case Study of Carbon Emission from Logistic Activities.pdf
Evaluation and Analysis of Carbon Emission Efficiency of Logistics Industry i...ijtsrd
As Chinas Capital Economic Circle , the Beijing Tianjin Hebei region has an important strategic position. Carbon emission efficiency can be understood as the ratio of the unit of carbon emissions generated to the economic cost invested, and under normal conditions, carbon emission efficiency improvement means that the production cost is reduced while the carbon emission is kept unchanged or the existing production input base is maintained. Improving carbon efficiency is conducive to the sustainable development of the logistics industry. Based on the 2010 2020 panel data, this paper uses the emission coefficient method to calculate the carbon emissions of the logistics industry in the Beijing Tianjin Hebei region from 2010 to 2020, takes the carbon emission efficiency of the logistics industry in the Beijing Tianjin Hebei region as the evaluation index, constructs a super SBM model to measure the carbon emission efficiency of the logistics industry in the Beijing Tianjin Hebei region, and then evaluates and analyzes the carbon emission efficiency of the logistics industry in the Beijing Tianjin Hebei region. The results show that the overall carbon emission efficiency in the Beijing Tianjin Hebei region shows a slow upward trend, and there is more room for improvement, and finally according to the above conclusions, suggestions such as establishing green values, formulating reasonable policies and optimizing management systems are put forward. Yushou Han | Haochen Nong "Evaluation and Analysis of Carbon Emission Efficiency of Logistics Industry in Beijing-Tianjin-Hebei Region" Published in International Journal of Trend in Scientific Research and Development (ijtsrd), ISSN: 2456-6470, Volume-7 | Issue-5 , October 2023, URL: https://www.ijtsrd.com/papers/ijtsrd59980.pdf Paper Url: https://www.ijtsrd.com/other-scientific-research-area/enviormental-science/59980/evaluation-and-analysis-of-carbon-emission-efficiency-of-logistics-industry-in-beijingtianjinhebei-region/yushou-han
With the continuous development and application of modern logistics technology, logistics cost has become one of the important factors of enterprise competition. For the special field of cold chain logistics distribution, cost control is particularly critical. By studying the control method of cold chain distribution cost, this paper introduces how to reasonably optimize the distribution cost while effectively controlling the distribution cost so as to improve the competitiveness of enterprises. This paper sorts out the relevant theoretical overview and conceptual analysis and analyses the current situation of cold chain distribution cost control in logistics companies. Then, the existing logistics cost control system is evaluated, and the hierarchical analysis method and model comprehensive evaluation method are used to analyse the current control system score and problems that require additional attention and find the cause of the problem. Finally, rectification suggestions are put forward to improve distribution costs to enhance the competitive strength of enterprises.
Environmental Policy for Road Transportation: Greenhouse Gas Emissions and Ca...Shamsuddin Ahmed
This paper explores the efficacy of environmental protection in road transportation that produces greenhouse gas (GHG) emissions as a result of vehicle travel frequencies in a region. Road transportation deduces the highest contributor of carbon emissions coupled with human interventions in the economic growth sectors that rather bear a perilous condition in property management exclusively in urban settlements or impervious lands. An association among the selected variables where population erraticism echoes a basic determinant of road transportation for energy use and vehicle travels increasingly succeeds carbon-dioxide (CO2) emissions. Trends in regional gas emissions depict two pragmatic paradigms. First, at least four principal components are coherent and overriding in regional environmental protection to fulfil the common goal of measuring and monitoring climate smart land use. Second, a plausible land transportation policy pooled with environmental regulations is a complex one from economic development perspective as the higher the regional economic growth relates relatively higher GHG emissions in nature. It can be concluded that environmental protection from GHG is virtually regulated by three influences: population, energy usages, and vehicle travels which are deemed to be the spatial dimension of reducing global carbon emissions being caused from road transportation in a region.
Running Head TRUCKING SECTOR1TRUCKING SECTOR6.docxtoltonkendal
Running Head: TRUCKING SECTOR1
TRUCKING SECTOR6
Green Technology for Trucking Sector
Background Information
Heavy and medium-duty trucks play crucial roes in the economy of any nation. Trucking provides employment; influences usage of land; impacts commercial activities; and affects the prices of land as well as other commodities. According to research, the trucking industry in some countries is worth billions. The trucking industry also employs hundreds of thousands of drivers and provides livelihood to other parties that are not directly associated with the trucks (Abate & Road, 2014). Normally, trucking firms are made up of smaller companies that include carriers. There are varying levels of players in the industry from micro-trucking firms that employ from 1 to 4 employees to large motor carriers that employ more than 500 employees. In between these extremes, there are medium carriers. All these have a significant contribution to the carbon footprint.
Whilst the trucking industry bears significant amount of burden to the environment, it is a critical sector that holds the economy and livelihood of many. The industry involves many players from the drivers themselves to policy makers, support services, and government agencies. Striking an equilibrium in the industry core players at any given time determines how the industry runs and its key outcomes. One tough concern that has pervaded the industry over the years has been fuel economy and environmental management issues. Yet the number of goods required to be transported across borders and from one coast of a country to another has been increasing over the years. That means there is need for more trucks on the road igniting myriad environmental and climatic consequences. Ideally, safety, security, sustainability, and stresslessness should drive the trucking sector (O’Rourke, 2012). But with the current situation, it is only with a robust environmental friendly intervention that this can occur.
Over the years, pressures on the transport and logistic industry have been mounting. There has been pressure over environmental concerns so much so that governmental awareness on the same has led to increased pressure on key players in the industry. In addition consumers have also become more aware of the harms that logistics companies cause to the environment. As such, consumers have become demanding regarding green technologies and clean energy initiatives in the transport and logistic industry. In tandem with this change, it has become commonplace to have rising interest for streamlining operations for logistic companies. Firms that adopt greener technologies stand better chances of increasing their competitive edge (O’Rourke, 2012). Introduction of new structures for the logistics industry presents great benefits that may lead to better management of the environment.
Statement of Purpose
The purpose of this paper is to describe different factors that can influence the carbon ...
Research on the Current Situation and Promotion Strategy of Green Transformat...ijtsrd
On September 22, 2020, at the 75th United Nations General Assembly, China formally proposed the goal of achieving carbon peak in 2030 and carbon neutrality in 2060.Carbon neutrality is not only a national strategy, but also a national requirement for every enterprise. The goal of double carbon has put forward higher development requirements for the logistics industry, and vigorously promoting the development of green logistics has become an important path for Chinas logistics industry to achieve green transformation and upgrading. This paper starts with the analysis of the current situation of green transformation of logistics enterprises in Beijing, and puts forward countermeasures to solve the existing problems, so as to provide reference for promoting green logistics to achieve sustainable development goals. Lu Liuyi "Research on the Current Situation and Promotion Strategy of Green Transformation of Logistics Enterprises in Beijing" Published in International Journal of Trend in Scientific Research and Development (ijtsrd), ISSN: 2456-6470, Volume-7 | Issue-6 , December 2023, URL: https://www.ijtsrd.com/papers/ijtsrd60118.pdf Paper Url: https://www.ijtsrd.com/other-scientific-research-area/other/60118/research-on-the-current-situation-and-promotion-strategy-of-green-transformation-of-logistics-enterprises-in-beijing/lu-liuyi
IJRET : International Journal of Research in Engineering and Technology is an international peer reviewed, online journal published by eSAT Publishing House for the enhancement of research in various disciplines of Engineering and Technology. The aim and scope of the journal is to provide an academic medium and an important reference for the advancement and dissemination of research results that support high-level learning, teaching and research in the fields of Engineering and Technology. We bring together Scientists, Academician, Field Engineers, Scholars and Students of related fields of Engineering and Technology
A holistic approach to assessing the climate-positive effects of ICT.
A holistic methodology is necessary for assessing the potential reduction of CO2
e emissions. Life cycle assessment (LCA) is a well-established method and can be used for comparing emissions created in different scenarios. Standardized LCA methods can be used to identify solutions with the lowest CO2e emissions.
They provide society as a whole with the methods to assess a large number of possible solutions, to quantify the magnitude of potential reductions, and to show where these reductions could take place.
Development of a novel framework for the design of transport policies to achi...Araz Taeihagh
The formulation of policies requires the selection and configuration of effective and acceptable courses of action to reach explicit goals. A one-size-fits-all policy is unlikely to achieve the desired goals; as a result, the identification of a suite of alternative policies, together with clear indications of their trade-offs, is crucial to accommodate the diversity of stakeholders’ preferences. At present, the formulation of transport policies is done manually; this fact, together with the size of the space of possible policies, results in a large part of that space being left unexplored. A six-step framework to explore the space of alternative transport policies in order to achieve environmental targets is proposed. The process starts with a user-defined set of specific policy measures, using them as building blocks in the generation of alternative policy packages, clusters and future images according to the user's preferences and goals.The analysis framework is based on the visioning and backcasting approach used in the VIBAT report [Banister, D., & Hickman, R. (2006a). Visioning and backcasting for UK transport policy (VIBAT) project. Department for Transport's Horizons Research Programme 2004/06. The Bartlett school of planning and Halcrow Group Ltd. Retrieved 1/18/2008 http://www.ucl.ac.uk/∼ucft696/vibat2.html]. The framework is being implemented as a prototype decision support system around a case study: the formulation and analysis of policies required to achieve CO2 emission targets for the transport sector in the UK. Important insights on how to develop the framework have also been elicited from engineering design. The goal is to accelerate the task of policy-making and improve the effectiveness of the resulting policies.The proposed method and computer implementation is fundamentally different from the tools commonly used in the transport sector and is intended to assist (not replace) transport policy makers, and complement (not substitute nor compete with) existing mathematical modelling tools. This research constitutes the first step towards the development of a general family of computer-based systems that support the design of policies to achieve environmental targets—not only for transport, but also for other sectors such as energy and water.
Artificial Reefs by Kuddle Life Foundation - May 2024punit537210
Situated in Pondicherry, India, Kuddle Life Foundation is a charitable, non-profit and non-governmental organization (NGO) dedicated to improving the living standards of coastal communities and simultaneously placing a strong emphasis on the protection of marine ecosystems.
One of the key areas we work in is Artificial Reefs. This presentation captures our journey so far and our learnings. We hope you get as excited about marine conservation and artificial reefs as we are.
Please visit our website: https://kuddlelife.org
Our Instagram channel:
@kuddlelifefoundation
Our Linkedin Page:
https://www.linkedin.com/company/kuddlelifefoundation/
and write to us if you have any questions:
info@kuddlelife.org
"Understanding the Carbon Cycle: Processes, Human Impacts, and Strategies for...MMariSelvam4
The carbon cycle is a critical component of Earth's environmental system, governing the movement and transformation of carbon through various reservoirs, including the atmosphere, oceans, soil, and living organisms. This complex cycle involves several key processes such as photosynthesis, respiration, decomposition, and carbon sequestration, each contributing to the regulation of carbon levels on the planet.
Human activities, particularly fossil fuel combustion and deforestation, have significantly altered the natural carbon cycle, leading to increased atmospheric carbon dioxide concentrations and driving climate change. Understanding the intricacies of the carbon cycle is essential for assessing the impacts of these changes and developing effective mitigation strategies.
By studying the carbon cycle, scientists can identify carbon sources and sinks, measure carbon fluxes, and predict future trends. This knowledge is crucial for crafting policies aimed at reducing carbon emissions, enhancing carbon storage, and promoting sustainable practices. The carbon cycle's interplay with climate systems, ecosystems, and human activities underscores its importance in maintaining a stable and healthy planet.
In-depth exploration of the carbon cycle reveals the delicate balance required to sustain life and the urgent need to address anthropogenic influences. Through research, education, and policy, we can work towards restoring equilibrium in the carbon cycle and ensuring a sustainable future for generations to come.
Characterization and the Kinetics of drying at the drying oven and with micro...Open Access Research Paper
The objective of this work is to contribute to valorization de Nephelium lappaceum by the characterization of kinetics of drying of seeds of Nephelium lappaceum. The seeds were dehydrated until a constant mass respectively in a drying oven and a microwawe oven. The temperatures and the powers of drying are respectively: 50, 60 and 70°C and 140, 280 and 420 W. The results show that the curves of drying of seeds of Nephelium lappaceum do not present a phase of constant kinetics. The coefficients of diffusion vary between 2.09.10-8 to 2.98. 10-8m-2/s in the interval of 50°C at 70°C and between 4.83×10-07 at 9.04×10-07 m-8/s for the powers going of 140 W with 420 W the relation between Arrhenius and a value of energy of activation of 16.49 kJ. mol-1 expressed the effect of the temperature on effective diffusivity.
UNDERSTANDING WHAT GREEN WASHING IS!.pdfJulietMogola
Many companies today use green washing to lure the public into thinking they are conserving the environment but in real sense they are doing more harm. There have been such several cases from very big companies here in Kenya and also globally. This ranges from various sectors from manufacturing and goes to consumer products. Educating people on greenwashing will enable people to make better choices based on their analysis and not on what they see on marketing sites.
Prevalence of Toxoplasma gondii infection in domestic animals in District Ban...Open Access Research Paper
Toxoplasma gondii is an intracellular zoonotic protozoan parasite, infect both humans and animals population worldwide. It can also cause abortion and inborn disease in humans and livestock population. In the present study total of 313 domestic animals were screened for Toxoplasma gondii infection. Of which 45 cows, 55 buffalos, 68 goats, 60 sheep and 85 shaver chicken were tested. Among these 40 (88.88%) cows were negative and 05 (11.12%) were positive. Similarly 55 (92.72%) buffalos were negative and 04 (07.28%) were positive. In goats 68 (98.52%) were negative and 01 (01.48%) was recorded positive. In sheep and shaver chicken the infection were not recorded.
Climate Change All over the World .pptxsairaanwer024
Climate change refers to significant and lasting changes in the average weather patterns over periods ranging from decades to millions of years. It encompasses both global warming driven by human emissions of greenhouse gases and the resulting large-scale shifts in weather patterns. While climate change is a natural phenomenon, human activities, particularly since the Industrial Revolution, have accelerated its pace and intensity
A Case Study of Carbon Emission from Logistic Activities.pdf
1. Jurnal Kejuruteraan 33(2) 2021: 221-228
https://doi.org/10.17576/jkukm-2021-33(2)-07
A Case Study of Carbon Emissions from Logistic Activities During Supply Chain
Disruptions
Siti Zubaidah Amiruddin, Hawa Hishamuddin*, Noraida Azura Darom & Hilmi Hisyam Naimin
Faculty of Engineering & Built Environment, Universiti Kebangsaan Malaysia, Malaysia
*Corresponding author: hawa7@ukm.edu.my
Received 15 August 2019, Received in revised form 07 February 2020
Accepted 15 September 2020, Available online 30 May 2021
ABSTRACT
Supply chain disruptions have significant negative effects on logistics operations, in which recovery actions could in turn
affect the environment if certain green precautions are not undertaken. The objective of this research is to assess the effect
of disruption on carbon emissions from logistics activities in the supply chain. A case study was carried out in this study to
identify the factors of supply chain disruptions that affect logistics operations, and investigate the impact of the disruptions
on the environment. Data collection using the Fuel Monitor application and real disruption data from a selected company
were used to quantify the carbon emissions during disruption and non-disruption scenarios. Analysis of the study found
that carbon emissions during disruption events increased to approximately 18 – 20 % as compared to normal operations.
This is due to the increase in travelling distance in order to fulfill customer backorders during the disruption occurrence.
The carbon emission amount was slightly higher when using fuel consumption as reference data in comparison to distance
travelled, as fuel consumption takes into account the driving behaviour and efficiency of the truck engines. This study
is useful for analyzing the impact of supply chain disruptions on the environment, particularly from the post-disruption
recovery decisions.
Keywords: Disruption; supply chain; carbon emission; logistics
INTRODUCTION
The global warming phenomenon that exists today is
largely due to the impact of greenhouse gases. Generally,
greenhouse gases consisting of various carbon gases,
such as carbon dioxide and carbon monoxide, are capable
of trapping heat in the atmospheric layer and causing the
earth to heat up. Carbon emissions from transportation, in
particular, are attributable to rapid industrial activity (Xie
& Liu 2017).
The main source of greenhouse gas emissions is
from transportation as it accounts for 23% of the world’s
energy in relation to greenhouse gases (Kahn et al. 2007).
Freight transportation is one of the back-bones of supply
chain system to deliver commodities or raw materials to
process a product or for final product delivery, locally or
globally.
The supply chain is a system that involves the
production, delivery, storage, distribution and sale of
products to meet the demand of a product. Among the
importance of managing supply chains is to reduce inventory
costs, provide a medium for information sharing, increase
customer satisfaction and service, and improve integration
processes (Li et al. 2006).
The effectiveness of a supply chain depends on an
efficient operation by ensuring that a product is at the right
time and place to meet the consumer demand. Supplier
failures for service or goods distribution can lead to supply
chaindisruptions(Clemons&Slotnick2016;Pauletal.2016;
Mustaffa et al. 2018). Moreover, the sustainability aspect of
supply chains nowadays accounts for the environmental
performance of a supply chain, which increased researcher’s
interest in the area of sustainable supply chain management
(SSCM) (Hammami et al. 2015; Jamian et al. 2015; Sarkar
et al. 2016; Hariga et al. 2017; Lee et al. 2018). In an
ideal SSCM, the flow of goods and management from the
supplier to the retailer proceeds smoothly, but in reality, the
presence of disruptions may result in the opposite to occur.
Therefore, nowadays, researchers have focused on studying
the integration of sustainable supply chain and disruption
management in the development of more resilient systems
(Fahimnia & Jabbarzadeh, 2016; Darom et al. 2018;
Daryanto et al. 2019).
Carbon footprint is the amount of carbon emissions
released directly or indirectly caused by activity or
accumulation over a product’s life span (Lin et al. 2015).
Measurement of the carbon footprint is an important task to
be undertaken by an organization that want to proactively
manage their environmental improvement effort (Lee,
2012). In addition, there must be a coordinated effort across
the entire supply chain to reduce the overall carbon emission
(Benjaafar et al. 2012).
The accurate measurement of carbon emissions is
important in order to monitor and manage the company’s
2. 222
targets. Montoya-Torres et al. (2015) who did a research
on “Conceptual framework for measuring and analyzing
carbon foot-print in the supply chain” used real data from
an agricultural company. Data was then divided into several
restrictions. Emissions from delivery was calculated
using the transportation factor of the goods based on the
specified methodology (Green House Gas Protocol) which
combines the total distance and weight. Meanwhile Lee
(2011) performed a case study on the integration of carbon
footprint into the supply chain management of an automotive
company.
There exists a gap in the study, in which the
emissions calculations are influenced by limited data and
uncertainty surrounding variable values. Furthermore,
the data was analyzed from the logistics activities
in the supply chain during non-disruption scenarios.
In addition, there is no specific study of disruption
analysis in supply chains involving the relation of
environmental impacts. Therefore, this study aims
to involve environmental impacts in the supply chain
analysis during disruption. The data collection methods
needed to analyze the amount of carbon emissions will
also be presented.
The objective of this study is to analyze the relationship
of disruptions and its effect on carbon emissions from
logistics activities in the supply chain. The contribution is
to propose managerial insights in terms of green logistics
practices to industrial practitioners, particularly in the face
of disruption risks.
The remainder of this paper is organized as follows.
Section 2 will propose the experimental procedures
conducted in this study. In Section 3, the results of the study
along with discussion will be presented, followed by the
conclusion in Section 4.
METHODOLOGY
A case study was conducted at an automotive
manufacturing company located in Negeri Sembilan.
The case study aims at identifying scenarios and factors
in the supply chain that cause disruption in logistical
activities. After collecting disruption data, the changes in
logistics activities due to disruption were captured and
carbon emissions were calculated to quantify the effect
of disruptions to the environment. A comparison analysis
was done on carbon emissions during disruption and non-
disruption scenarios.
Among the company data collected were production
and Overall Equipment Effectiveness (OEE) data throughout
January to March 2018. Truck schedule and criterion
data were also recorded and fuel consumption data were
taken using the “Fuel Monitor” application. Descriptive
analysis was done using Microsoft Excel based on two
different formulas, namely (i) activity-based approach and
(ii) energy-based approach to show the accuracy in data
obtained between the two methods.
RESULTS AND DISCUSSION
PERFORMANCE DELIVERY DATA
Table 1 shows the logistics performance data of the
company when a disruption began in January until March
2018 for Product A to be sent to one of their customers.
The table shows six disruption events throughout the three
months of production. The highest (actual) total delivery of
the scheduled shipment was dated March 7th with a total
of 3600 parts. Meanwhile, the total difference between
the total actual and the total planned shipment was dated
February 2nd by 1680 parts. This was due to production
failure that occurred during the disruption event. Therefore,
the company had to post-pone delivery to the next session.
Consequently, the truck capacity also changed according to
the increased amount of product shipment at the respective
scheduled time.
In general, disruptions that occur during the production
process will have a direct effect on logistics. Due to the
failure to deliver the goods according to plan, the company
will rearrange the original plan so that it does not affect the
customer’s demand. In the event of a delivery failure, the
company may be penalized. This would cause the company
to incur big losses.
CARBON EMISSION QUANTITATIVE ANALYSIS
In this section, the methods used to calculate the carbon
emissions will be presented. Each method will calculate
carbon emissions for two scenarios, (i) disruption and (ii)
non-disruption, where a comparison will be made between
the two scenarios and methods.
COMPUTATION USING ACTIVITY BASED APPROACH
The first method used to quantify carbon emission focusses
on truck weight and truck journey distance without
considering drivers styles of driving, transportation engine
efficiency, etc. With the availability of travel distance data
from logistics activities, the carbon emissions could be
quantified.
According to the Guidelines for Measuring and
Managing CO2
Emission from Freight Transport Operations
(ECTA, 2011), the formula for carbon emission for distance
is shown in (1) as follows:
Carbon emissions = Truck journey distance (km) ×
Truck weight (ton) × Release
factor (grams CO2
per ton km
/ 1,000,000)
(1)
The assumption for truck release factor is 62 (grams CO2
per
ton km / 1,000,000).
Table 2 and 3 show the results of carbon emission for
disruption and non-disruption scenarios, respectively. This
data summarizes the original performance data in Table 1
3. 223
which is a summary of the data following the interruption
that occurred during the 3 months. Additionally, the total
emissions of carbon dioxide for each disruption instance
is presented. The results show that the carbon emissions
increased significantly following a big disruption magnitude.
For example, on 29th
January, the number of trips doubled
as a result of production failure, which in turn doubled the
carbon emissions to 14.632 kg CO2
, where the original
schedule could have merely produced 7.316 kg CO2
.
Furthermore, on the 2nd
of February, the disruption event
caused an emission of 21.948 kg CO2
as opposed to 7.316
kg CO2
due to increased shipment quantity that forced the
company to use a larger tonnage truck, (Daihatsu), instead
of the usual truck used (Isuzu). This caused the carbon
emission to triple from the original plan.
For the disruption instance on 9th
, 10th
and 26th
March,
the total number of trips doubled, which in turn resulted in
the amount of emissions to double as well compared to the
non-disruption schedule.
Figure 1 shows the histogram comparison of the number
of trips between disruption and non-disruption cases. The
total number of trips during the interruption was higher by
5 times the number of trips than when the disturbance did
not occur. The disruption in the supply chain caused the
company to fail to reach the delivery target. Therefore, the
company was forced to postpone delivery on the following
day. This has led to increased product delivery capacity and
the number of trips for the delivery process to meet customer
demand.
Figure 2 shows a histogram of the ratio of the total
distance between the disruption and non- disruption
occurrence. The total distance during disruption was 472 km
higher than the ideal condition. This is due to the increased
number of travels due to failure during production.
Figure 3 shows the pie chart of the difference in carbon
emissions between disruption and non-disruption periods.
The percentage of carbon emissions during disruption was
higher than when the non-disruption case by 18%.This is due
TABLE 1. Performance data
No. Date Total Deliveries
(Plan)
Total Deliveries
(Actual)
Truck tonnage
(Plan)
Truck tonnage
(Actual)
No. of trip
(Plan)
No. of Trip
(Actual)
1. 29 Jan 960 1680 1 1 1 2
2. 2 Feb 960 2640 1 3 1 1
3. 7 Mar 3360 3600 3 3, 1 2 2, 1
4. 9 Mar 2520 3120 3 3 1 2
5. 10 Mar 840 1920 1 1 1 2
6 26 Mar 2880 3480 3 3 1 2
TABLE 2. Disruption data
Date Truck Tonnage No. of Trips Distance (km) Emission Factor (g CO2
/tonne km) Carbon emission (kg COs
)
29 Jan 1 2 236 62 14.632
2 Feb 3 1 118 62 21.948
7 Mar 3
1
2
1
236
118
62
62
43.896
7.316
9 Mar 3 2 236 62 43.896
10 Mar 1 2 236 62 14.632
26 Mar 3 2 236 62 43.896
Total 12 1416 190
Average 3 202 27
TABLE 3. Non-disruption data
Date Truck Tonnage No. of Trips Distance (km) Emission Factor (g CO2
/tonne km) Carbon emission (kg COs
)
29 Jan 1 1 118 62 7.316
2 Feb 1 1 118 62 7.316
7 Mar 3 2 236 62 43.896
9 Mar 3 1 118 62 21.948
10 Mar 1 1 118 62 7.316
26 Mar 3 1 236 62 43.896
Total 7 944 132
Average 1.7 157 22
4. 224
to the fact that carbon emissions are directly proportional to
the weight of the truck, as well as the total distance traveled.
In other words, the higher the travel distance and the weight
of the truck, the higher the carbon emissions. Since the
weight of the truck and the total distance of the ride during
disruption were higher when there was no disruption, the
carbon production during disruption resulted in higher
values.
COMPUTATION USING ENERGY BASED APPROACH
The second method used to calculate carbon emission
was using the average fuel consumption, where the driver
styles of driving, transportation and engine efficiency were
considered. The fuel consumption data was gathered using
the Fuel Monitor application, as shown in Figure 4. The
carbon emission amount was then calculated using the
appropriate equation.
With reference to ECTA (2011) the formula used is
shown as in (2) below:
Carbon emissions = Average fuel consumption
(litre) × Diesel coefficient
(kilograms CO2
per litre)
(2)
Diesel coefficient = 2.9 kg CO2
/ litre
Similar to the previous method, Table 4 and 5 show the
results of carbon emission for disruption and non-disruption
scenarios, respectively, with reference to fuel consumption
data.
Figure 5 shows a comparison histogram of fuel
consumption between the disruption and non-disruption
scenarios. The amount of fuel consumption when the
disruption occurred was higher by 50 liters than when
disruption did not occur. This is because the amount of fuel
consumption depends on the amount of distance used. The
higher the distance, the higher the fuel consumption. The use
of fuel during interference is higher than no interruptions
due to the total distance at which disruption is higher than
non-disruption. Figure 6 shows a pie chart of the percentage
of carbon emission difference between disruption and non-
disruption events. The percentage of carbon emissions
during disruption was found to be much higher than non-
disruption by 20%. This is due to the use of fuel during
disruption that is higher than non-disruption periods.
RELATIONSHIP BETWEEN DISRUPTION AND ITS
IMPACT ON THE ENVIRONMENT
The failure of raw material supply and machine failure are
among the common disruptions that occur within the supply
chain. These disruptions can affect the entire supply chain
FIGURE 1. Number of trips during disruption and non-disruption
FIGURE 2. Total distance travelled during disruption and non-disruption
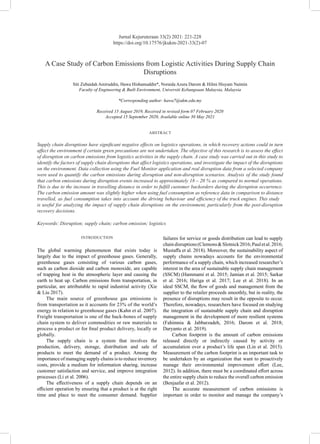
5. 225
FIGURE 3. Difference of carbon emission percentage during disruption and non-disruption using distance data
FIGURE 4. The Fuel Monitor Application
TABLE 4. Disruption data
Date Truck Tonnage No. of Trips Fuel Consumption (L) Diesel Coefficient (kg CO2
/L) Carbon emission (kg COs
)
29 Jan 1 2 25.22 2.9 73.138
2 Feb 3 1 12.61 2.9 36.569
7 Mar 3
1
2
1
25.22
12.61
2.9
2.9
73.138
36.569
9 Mar 3 2 25.22 2.9 73.138
10 Mar 1 2 25.22 2.9 73.138
26 Mar 3 2 25.22 2.9 73.138
Total 12 1416 439
Average 3 202 63
TABLE 5. Non-disruption data
Date Truck Tonnage No. of Trips Fuel Consumption (L) Diesel Coefficient (kg CO2
/L) Carbon emission (kg COs
)
29 Jan 1 1 12.61 2.9 36.569
2 Feb 1 1 12.61 2.9 36.569
7 Mar 3 2 25.22 2.9 73.138
9 Mar 3 1 12.61 2.9 36.569
10 Mar 1 1 12.61 2.9 36.569
26 Mar 3 1 12.61 2.9 36.569
Total 7 101 293
Average 1.7 16.8 49
6. 226
and thus impact goods delivery to customers. Based on the
company data collected, frequent disruptions interfere with
the production process of goods and logistics operations.
When disruptions occur during or before the production
process, the targeted delivery of goods to customers becomes
interrupted. When shipment cannot be executed as planned,
the company will adjust the delivery planning so as not to
disrupt the customer’s supply chain. Normally, the company
will postpone delivery to the next day in the event of an
unexpected disruption. Additionally, the truck capacity that
is used will increase. Referring to the company’s practice,
the truck types used for shipment are 1 ton truck (Isuzu) and
3 ton (Daihatsu). The company will determine the weight
of the appropriate trucks according to one shipment. If
the weight of the goods exceeds the weight of the trucks,
the company will usually increase the number of trips to
the customer. The maximum number of delivery trips for
the company is three deliveries per day. The increasing
number of shipment trips will make the total distance during
delivery to increase as well. According to ECTA (2011), for
the activity-based approach, carbon emissions are directly
proportional to the weight of the trucks and the distance
of one shipment. The higher the weight of the truck, or
the increasing number of shipping distance, the higher the
carbon emissions in the air. Likewise, for energy-based
approaches, carbon emissions are directly proportional to
the average use of fuel. As the number of trips increase, the
average fuel used increases, thus, increasing the amount of
carbon dioxide in the air. In the absence of any disruption
in the supply chain, the amount of carbon production can
be reduced.
COMPARISON OF METHODS BETWEEN ACTIVITY BASED APPROACH
AND ENERGY BASED APPROACH
Based on Figures 3 and 6, the difference in percentage of
carbon production for energy-based approach is higher than
activity-based by 1% in disruption scenarios. According
to Tanskanen & Hameri (1999), vehicle weight is one
of the factors that causes average fuel consumption to
increase. In addition, engine performance also affects fuel
consumption. Low engine performance causes reduced fuel
efficiency. Consequently, more fuel consumption is needed.
In addition, irregular vehicle maintenance factors result
in poor use of the vehicle engine, leading to reduced fuel
efficiency. Finally, the driving force factor also affects the
amount of fuel consumption. Most of the trucks used by the
company are of manual transmission type. The inclination
of drivers to drive vehicles using the wrong gear may also
occur. Gear conversion depends on a certain speed. For
example, on certain drives, drivers are required to use gear
3, but drivers drive the truck at 80km / hr. This leads to more
energy needed to drive the truck and indirectly increases
fuel consumption. Aggressive driving can also increase fuel
FIGURE 5. Average fuel consumption during disruption and non-disruption
FIGURE 6. Difference of carbon emission percentage during disruption and non-disruption scenarios using fuel data
7. 227
consumption. This is because the speed of the vehicle makes
the engine revolution rise, bringing in the use of high fuel
consumption
PROPOSED LOGISTICS PRACTICE
In this section, proposed logistics practices to reduce carbon
emissions during disruptions will be proposed. The amount
of carbon production depends on the weight of the truck
used and also the total distance travelled. There are several
suggestions to reduce the amount of carbon emissions in the
air from disrupted logistics activities. The first suggestion
is to use a smaller capacity truck for short distances if the
truck capacity is sufficient for the delivery. By reducing
truck capacity, reduction in the amount of carbon production
can be achieved. While trucks with large weight cause high
carbon footprint, it is recommended to use this type for long
distances and large shipments.
Secondly is by specifying the best shipping route
for delivery. The best delivery route can be identified by
knowing the intricacies of traveling from the company to
customers. With this strategy, the total travel distance can
be reduced during delivery, thus reducing the amount of
carbon emissions in the air (Karagul et al. 2018). The third
recommendation is to perform regular truck maintenance
to improve fuel efficiency. With a scheduled regular
maintenance plan, fuel consumption can be reduced,
thus, reducing the amount of carbon emissions to the
environment.
The fourth suggestion is to make use of third party
logistics provider. The function of the third party logistics
is to deliver finished goods if the company fails to ship
to the customers. This will ultimately reduce the negative
effects of disruption such as high backorder costs or loss
in sales. Lastly, by adopting pro-active measures to deal
with disruptions in the supply chain such as having backup
inventory or safety stock. This ensures that all customer
demand is met and mitigates the losses incurred due to
backorders or lost sales. However, the optimal level of
safety stock should be identified so that extra inventory
holding costs can be avoided.Additionally, by implementing
predictive shipments where the product is delivered on
an expected request. This way, the company can respond
flexibly to changing demand and suppliers. Planning is
a continuous process that can respond dynamically to
changing needs or constraints.
CONCLUSION
This quantitative study has been conducted to achieve the
first objective set out for this study, which is to identify
the disruption factors that cause logistical activities to be
disrupted and their impact on the environment. Quantitative
analysis shows that carbon emissions increased following
disruption occurrence in the supply chain. Two approaches
were adopted, namely (i) based on activity and (ii) based on
energy. As a result of the calculations of both approaches, it
has been identified that carbon emissions using an energy-
based approach was 2% higher than activity-based. Based on
the results of this study, it can be concluded that disruptions
in the supply chain have a direct impact on carbon emissions
to the environment. Therefore, it is highly recommended that
managers seek greener alternatives during post-disruption,
particularly in decision making pertaining to logistics
activities to ensure that the sustainability of the supply chain
is conserved. This study can be considered as a pilot study
and can be used as a reference for future studies.
ACKNOWLEDGMENT
The authors would like to thank the Ministry of Higher
Education and Universiti Kebangsaan Malaysia for funding
this research under the Fundamental Research Grant Scheme
FRGS/1/2017/TK03/UKM/02/3.
DECLARATION OF COMPETING INTEREST
None.
REFERENCES
Benjaafar, S., Li, Y., & Daskin, M. 2012. Carbon footprint and the
management of supply chains: Insights from simple models.
IEEE Transactions on Automation Science and Engineering
10(1): 99-116.
Cefic-ECTA 2011. Guidelines for measuring and managing CO2
emissions from transport operations. Brussels, Belgium.
Clemons, R., & Slotnick, S.A. 2016. The effect of supply-chain
disruption, quality and knowledge transfer on firm strategy.
International Journal of Production Economics 178: 169–
186.
Darom, N. A., Hishamuddin, H., Ramli, R., & Nopiah,
Z. M. N. 2018. An inventory model of supply chain
disruption recovery with safety stock and carbon emission
consideration. Journal of Cleaner Production 197: 1011-
1021.
Daryanto, Y., Wee, H. M., & Widyadana, G. A. 2019. Low carbon
supply chain coordination for imperfect quality deteriorating
items. Mathematics 7(3): 234.
Fahimnia, B., & Jabbarzadeh, A. 2016. Marrying supply chain
sustainability and resilience: A match made in heaven.
Transportation Research Part E: Logistics and Transportation
Review 91: 306-324.
Hammami, R., Nouira, I., & Frein, Y. 2015. Carbon emissions in
a multi-echelon production-inventory model with lead time
constraints. International Journal of Production Economics
164: 292-307.
Hariga, M., As’ ad, R., & Shamayleh, A. 2017. Integrated
economic and environmental models for a multi stage cold
supply chain under carbon tax regulation. Journal of Cleaner
Production 166: 1357-1371.
Jamian, R., Rahman, M. N. A., Deros, B. M., Ibrahim, M. Z., &
Ismail, N. Z. N. 2014. Relationship between 5S implementation
and green performance of Malaysian manufacturing SMEs: A
conceptual model. Journal of Engineering 26: 1-14.
8. 228
Kahn, R. S., Kobayashi, S., Beuthe, M., Gasca, J., Greene, D.,
Lee, D. S., Muromachi, Y., Newton, P. J., Plotkin, S., Sperling,
D., & Wit, R. 2007. Transport and its infrastructure. Climate
change 2007: Mitigation - Contribution of Working Group III
to the fourth assessment report of the intergovernmental panel
on climate change. Cambridge University Press.
Karagul, K., Sahin, Y., Aydemir, E., & Oral, A. 2019. A simulated
annealing algorithm-based solution method for a green vehicle
routing problem with fuel consumption. Lean and green supply
chain management 161-187.
Lee, A. H., Kang, H. Y., Ye, S. J., & Wu, W. Y. 2018. An integrated
approach for sustainable supply chain management with
replenishment, transportation, and production decisions.
Sustainability 10(11): 3887.
Lee, K. H. 2011. Integrating carbon footprint into supply chain
management: the case of Hyundai Motor Company (HMC) in
the automobile industry. Journal of cleaner production 19(11):
1216-1223.
Lee, K. H. 2012. Carbon accounting for supply chain management
in the automobile industry. Journal of Cleaner Production 36:
83-93.
Li, S., Ragu-Nathan, B., Ragu-Nathan, T. S., & Rao, S. S. 2006. The
impact of supply chain management practices on competitive
advantage and organizational performance. Omega 34(2): 107-
124.
Lin, J., Hu, Y., Cui, S., Kang, J., & Ramaswami, A. 2015. Tracking
urban carbon footprints from production and consumption
perspectives. Environmental Research Letters 10(5): 1–12.
Montoya-Torres, J. R., Gutierrez-Franco, E., & Blanco, E. E.
2015. Conceptual framework for measuring carbon footprint
in supply chains. Production Planning and Control 26(4):
265–279.
Mustaffa, N. F., Hishamuddin, H., Ropi, N. M., Saibani, N., & Ab
Rahman, M. N. 2018.Assessing supply chain risk management
practices in manufacturing industries in Malaysia. Journal of
Engineering 1(6): 17-22.
Paul, S. K., Sarker, R., & Essam, D. 2018. A reactive mitigation
approach for managing supply disruption in a three-tier
supply chain. Journal of Intelligent Manufacturing 29(7):
1581-1597.
Sarkar, B., Ganguly, B., Sarkar, M., & Pareek, S. 2016. Effect of
variable transportation and carbon emission in a three-echelon
supply chain model. Transportation Research Part E: Logistics
and Transportation Review 91: 112-128.
Tanskanen, K., & Hameri, A. P. 1999. Improving efficiency and
productivity in logistics chains: A case study. International
Journal of Logistics: Research and Applications 2(2): 197-211.
Xie, R., Fang, J., & Liu, C. 2017. The effects of transportation
infrastructure on urban carbon emissions. Applied Energy 196:
199–207.