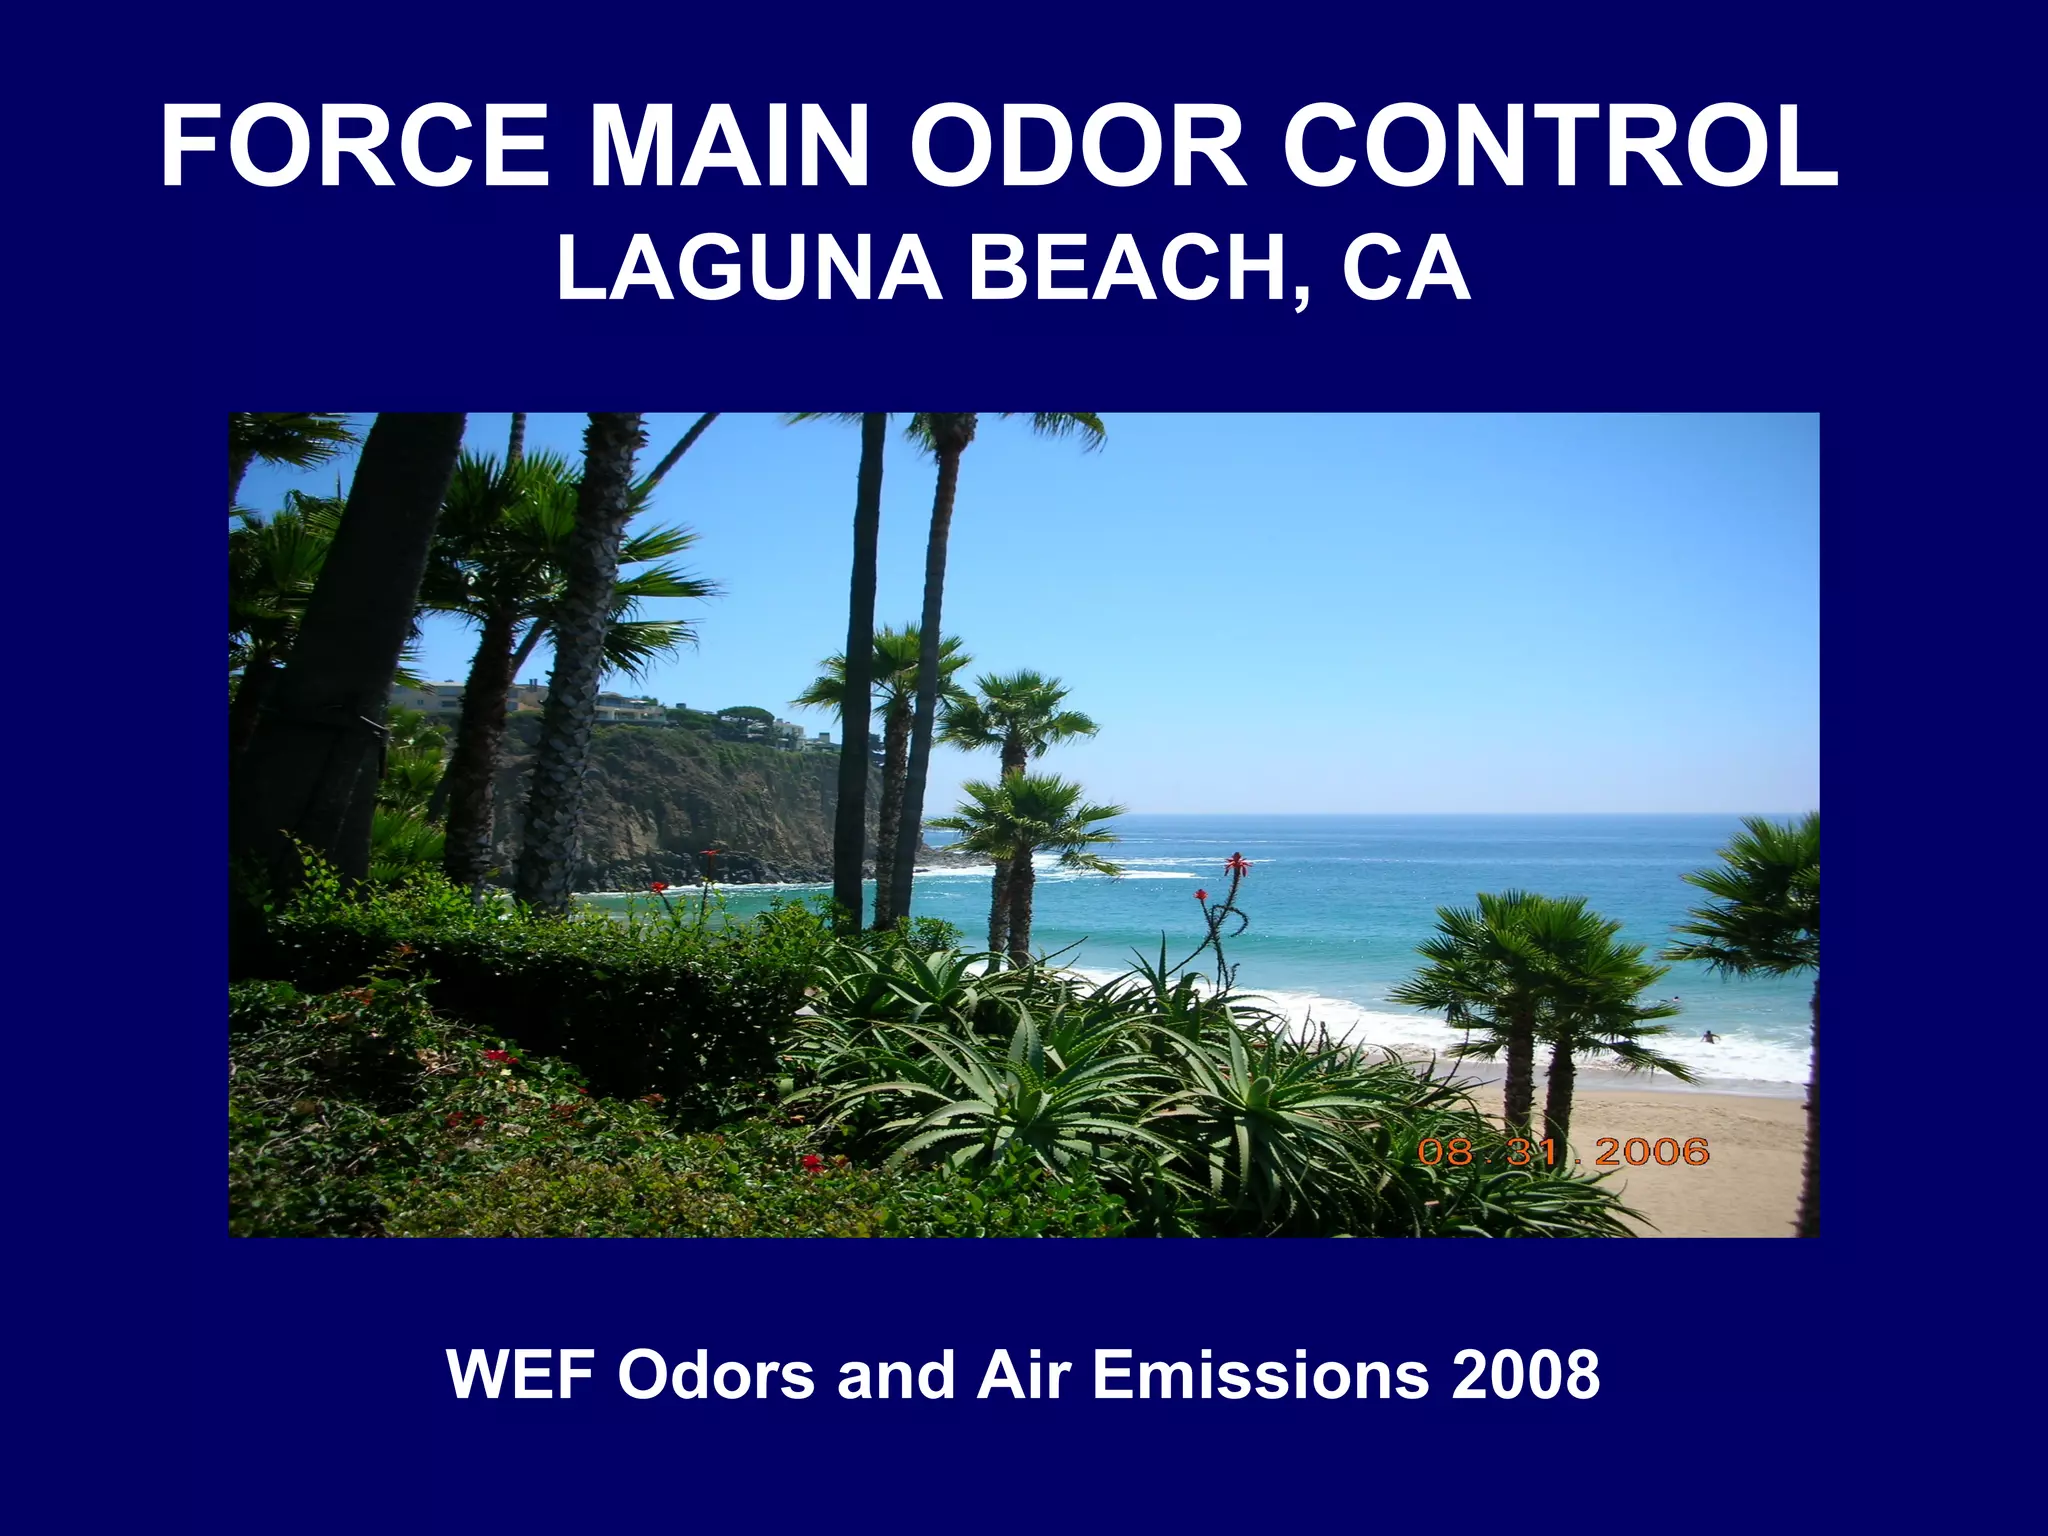
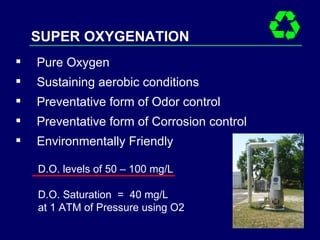
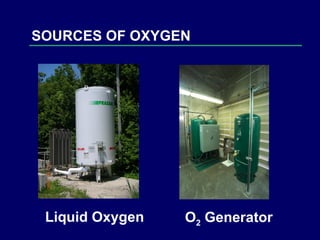
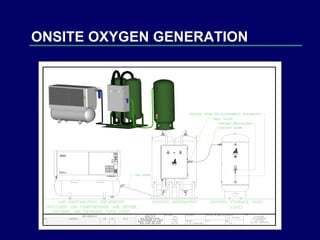
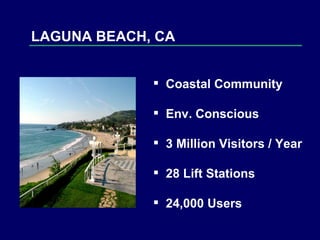
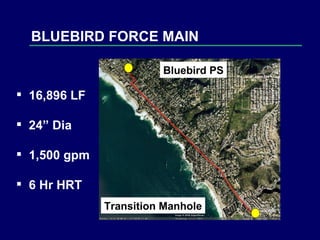
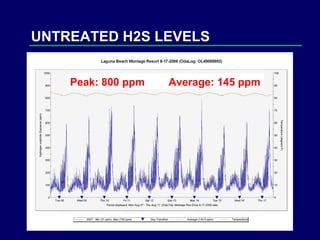
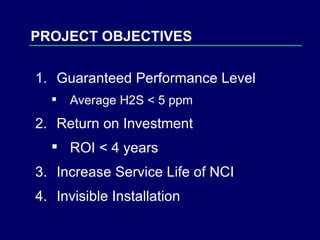
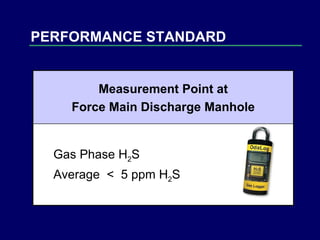
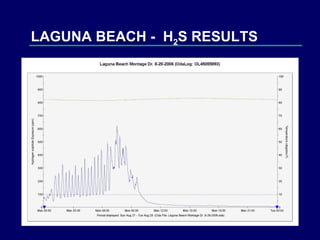
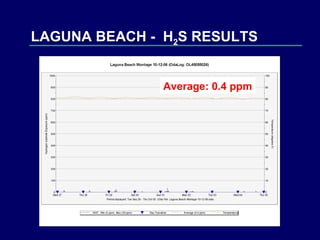
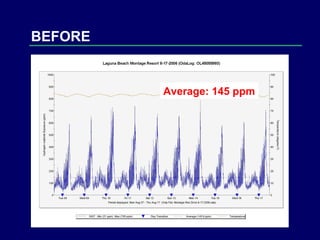
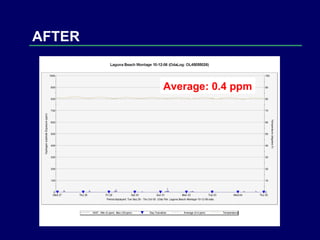
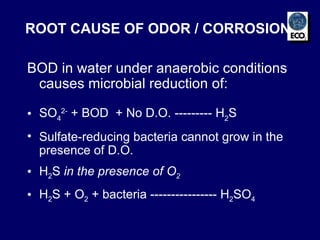
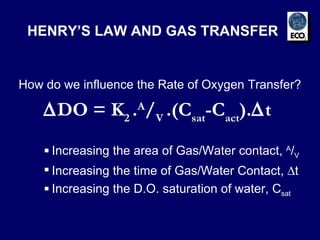
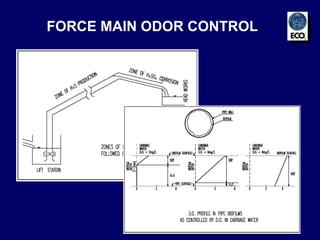
FORCE MAIN ODOR CONTROL   LAGUNA BEACH, CA WEF Odors and Air Emissions 2008
Allow it to form then treat it Chemicals or Scrubbers Prevent its formation SuperOxygenation TWO APPROACHES IN ODOR CONTROL
CORROSION CONCERN
Pure Oxygen Sustaining aerobic conditions Preventative form of Odor control Preventative form of Corrosion control Environmentally Friendly SUPER OXYGENATION D.O. levels of 50 – 100 mg/L D.O. Saturation  =  40 mg/L at 1 ATM of Pressure using O2
TECHNOLOGY OVERVIEW Oxygen Gas Unscreened Raw Wastewater Force Main Oxygenated Raw Water Sidestream  Pump
ECO 2  ®   Oxygenation Cone System Intake System Discharge Oxygen Supply Booster Pump Influent 18” Force main 3 miles long Lift Station Wet Well TYPICAL FORCE MAIN INSTALLATION
SYSTEM COMPONENTS
Liquid Oxygen SOURCES OF OXYGEN O 2  Generator
ONSITE OXYGEN GENERATION
COST – LOX vs. GENERATION 5 Year N/A Payback $14,000 $24,500 Annual Operating Cost Electrical Cost $11,000 O&M Cost $3,000 Product Cost $18,500 Annual Lease $6,000 Operating Cost $53,000 $5,000 Capital Cost 1,000  1,000  Oxygen (lbs / day)  GENERATION LOX
LAGUNA BEACH, CA Coastal Community  Env. Conscious 3 Million Visitors / Year 28 Lift Stations  24,000 Users
BLUEBIRD FORCE MAIN Bluebird PS Transition Manhole 16,896 LF 24” Dia 1,500 gpm 6 Hr HRT
BLUEBIRD PUMP STATION
FORCE MAIN DISCHARGE
MONTAGE RESORT
UNTREATED H2S LEVELS Peak: 800 ppm  Average: 145 ppm
Guaranteed Performance Level Average H2S < 5 ppm Return on Investment ROI < 4 years Increase Service Life of NCI Invisible Installation PROJECT OBJECTIVES
Rules of Thumb Design Data Checklist Design Calculations Performance Standard Economics SYSTEM DESIGN
DESIGN RULES OF THUMB 1.  Oxygen Demand: 1 Hour HRT = 10 mg/L D.O. Uptake 2.  Pressure Check: 1 ft Head Pressure = 1 mg/L D.O.
DESIGN DATA CHECKLIST
Force Main Specifications 16,896 ft 24” diameter  Longest HRT - 6 hr 1,500 gpm ECO 2  System Design O2 Demand =  6 hr  *  10 mg/L/hr = 60 mg/L  60 mg/L * 8.34 *  2.1 MGD = 1,000 lbs / day Pressure check  =  70 ft  = 70 mg/L  (> 70 mg/L) (Rule of thumb = 1 ft of head = 1 mg/L) DESIGN CALCULATIONS
PERFORMANCE STANDARD Measurement Point at Force Main Discharge Manhole Gas Phase H 2 S Average  <  5 ppm H 2 S
INSTALLATION INSIDE STATION
INSTALLATION LAYOUT Oxygen Generator Force Main  Pump Force Main ECO2 Cone Main Level Basement Sidestream  Pump
SYSTEM COMPONENTS
LAGUNA BEACH -  H 2 S RESULTS
Average: 0.4 ppm LAGUNA BEACH -  H 2 S RESULTS
BEFORE Average: 145 ppm
AFTER Average: 0.4 ppm
ECONOMICS - $40,700 Electrical Cost (Oxygen Generator) (15 hp Side stream Pump) - 3.6 Years Payback - $397,000 Capital Cost (Equipment + Installation) - $109,300 Annual Savings $150,000 -  Chemical Cost CHEMICAL ECO2
Force Main Odor Control  Primary Clarifier Odor Control Head Works Odor Control D.O. Discharge / TMDL Standards Lake and River Supplementation APPLICATIONS
TRA - Dallas, TX 150 MGD  .   14,000 lb O 2  / day Anticipated Results:  0.0 mg/L DS into Primary Clarifier
Cheeney Creek WWTP - Fishers, IN 5.0 MGD  .  5 hrs HRT  Results:  5 - 10 mg/L D.O. at Plant Headworks Allisonville Road Smock Creek Hague Road
KSD - Kennebunk, ME 5.0 MGD  .   210 lb O 2  / day Results:  WWTP Plant D.O. Discharge 8 mg/L
GPA - Savannah Harbor, GA 22 MGD  .  30,000 lb O2 / day Results:  Cone D.O. Discharge 150 mg/L
David Shissler, City of Laguna Beach Graham Wright, City of Laguna Beach ACKNOWLEDGMENTS
 
BOD in water under anaerobic conditions causes microbial reduction of: SO 4 2-  + BOD  + No D.O. --------- H 2 S Sulfate-reducing bacteria cannot grow in the presence of D.O. H 2 S  in the presence of O 2 H 2 S + O 2  + bacteria ---------------- H 2 SO 4 ROOT CAUSE OF ODOR / CORROSION
How do we influence the Rate of Oxygen Transfer?  DO = K 2  . A / V  .(C sat -C act ).  t   Increasing the area of Gas/Water contact,  A / V  Increasing the time of Gas/Water Contact,   t   Increasing the D.O. saturation of water, C sat HENRY’S LAW AND GAS TRANSFER
FORCE MAIN ODOR CONTROL

Wef Odors Laguna Beach 4 7 08

  • 1.
    FORCE MAIN ODORCONTROL LAGUNA BEACH, CA WEF Odors and Air Emissions 2008
  • 2.
    Allow it toform then treat it Chemicals or Scrubbers Prevent its formation SuperOxygenation TWO APPROACHES IN ODOR CONTROL
  • 3.
  • 4.
    Pure Oxygen Sustainingaerobic conditions Preventative form of Odor control Preventative form of Corrosion control Environmentally Friendly SUPER OXYGENATION D.O. levels of 50 – 100 mg/L D.O. Saturation = 40 mg/L at 1 ATM of Pressure using O2
  • 5.
    TECHNOLOGY OVERVIEW OxygenGas Unscreened Raw Wastewater Force Main Oxygenated Raw Water Sidestream Pump
  • 6.
    ECO 2 ® Oxygenation Cone System Intake System Discharge Oxygen Supply Booster Pump Influent 18” Force main 3 miles long Lift Station Wet Well TYPICAL FORCE MAIN INSTALLATION
  • 7.
  • 8.
    Liquid Oxygen SOURCESOF OXYGEN O 2 Generator
  • 9.
  • 10.
    COST – LOXvs. GENERATION 5 Year N/A Payback $14,000 $24,500 Annual Operating Cost Electrical Cost $11,000 O&M Cost $3,000 Product Cost $18,500 Annual Lease $6,000 Operating Cost $53,000 $5,000 Capital Cost 1,000 1,000 Oxygen (lbs / day) GENERATION LOX
  • 11.
    LAGUNA BEACH, CACoastal Community Env. Conscious 3 Million Visitors / Year 28 Lift Stations 24,000 Users
  • 12.
    BLUEBIRD FORCE MAINBluebird PS Transition Manhole 16,896 LF 24” Dia 1,500 gpm 6 Hr HRT
  • 13.
  • 14.
  • 15.
  • 16.
    UNTREATED H2S LEVELSPeak: 800 ppm Average: 145 ppm
  • 17.
    Guaranteed Performance LevelAverage H2S < 5 ppm Return on Investment ROI < 4 years Increase Service Life of NCI Invisible Installation PROJECT OBJECTIVES
  • 18.
    Rules of ThumbDesign Data Checklist Design Calculations Performance Standard Economics SYSTEM DESIGN
  • 19.
    DESIGN RULES OFTHUMB 1. Oxygen Demand: 1 Hour HRT = 10 mg/L D.O. Uptake 2. Pressure Check: 1 ft Head Pressure = 1 mg/L D.O.
  • 20.
  • 21.
    Force Main Specifications16,896 ft 24” diameter Longest HRT - 6 hr 1,500 gpm ECO 2 System Design O2 Demand = 6 hr * 10 mg/L/hr = 60 mg/L 60 mg/L * 8.34 * 2.1 MGD = 1,000 lbs / day Pressure check = 70 ft = 70 mg/L (> 70 mg/L) (Rule of thumb = 1 ft of head = 1 mg/L) DESIGN CALCULATIONS
  • 22.
    PERFORMANCE STANDARD MeasurementPoint at Force Main Discharge Manhole Gas Phase H 2 S Average < 5 ppm H 2 S
  • 23.
  • 24.
    INSTALLATION LAYOUT OxygenGenerator Force Main Pump Force Main ECO2 Cone Main Level Basement Sidestream Pump
  • 25.
  • 26.
    LAGUNA BEACH - H 2 S RESULTS
  • 27.
    Average: 0.4 ppmLAGUNA BEACH - H 2 S RESULTS
  • 28.
  • 29.
  • 30.
    ECONOMICS - $40,700Electrical Cost (Oxygen Generator) (15 hp Side stream Pump) - 3.6 Years Payback - $397,000 Capital Cost (Equipment + Installation) - $109,300 Annual Savings $150,000 - Chemical Cost CHEMICAL ECO2
  • 31.
    Force Main OdorControl Primary Clarifier Odor Control Head Works Odor Control D.O. Discharge / TMDL Standards Lake and River Supplementation APPLICATIONS
  • 32.
    TRA - Dallas,TX 150 MGD . 14,000 lb O 2 / day Anticipated Results: 0.0 mg/L DS into Primary Clarifier
  • 33.
    Cheeney Creek WWTP- Fishers, IN 5.0 MGD . 5 hrs HRT Results: 5 - 10 mg/L D.O. at Plant Headworks Allisonville Road Smock Creek Hague Road
  • 34.
    KSD - Kennebunk,ME 5.0 MGD . 210 lb O 2 / day Results: WWTP Plant D.O. Discharge 8 mg/L
  • 35.
    GPA - SavannahHarbor, GA 22 MGD . 30,000 lb O2 / day Results: Cone D.O. Discharge 150 mg/L
  • 36.
    David Shissler, Cityof Laguna Beach Graham Wright, City of Laguna Beach ACKNOWLEDGMENTS
  • 37.
  • 38.
    BOD in waterunder anaerobic conditions causes microbial reduction of: SO 4 2- + BOD + No D.O. --------- H 2 S Sulfate-reducing bacteria cannot grow in the presence of D.O. H 2 S in the presence of O 2 H 2 S + O 2 + bacteria ---------------- H 2 SO 4 ROOT CAUSE OF ODOR / CORROSION
  • 39.
    How do weinfluence the Rate of Oxygen Transfer?  DO = K 2 . A / V .(C sat -C act ).  t Increasing the area of Gas/Water contact, A / V Increasing the time of Gas/Water Contact,  t Increasing the D.O. saturation of water, C sat HENRY’S LAW AND GAS TRANSFER
  • 40.