Call Girls In Sikandarpur Gurgaon ❤️8860477959_Russian 100% Genuine Escorts I...
Strategy Part 3 - Combined Models
1. Combining Multiple Trading Models – Trend and Counter Trend
Markets typically go through cycles of trending and non-trending periods. Ideally at least
two separate models traded simultaneously will smooth out the Equity Curve by limiting
draw downs.
During time periods of consolidation or “side ways” market movements, characterized by
less directionality and volatility. A counter trend system will typically profit during the
time period where the trend following system does not. Conversely the counter trending
strategy will under perform the trend following system during higher directional and
volatility time periods. In addition the counter trending model’s performance can be further
enhanced by knowing when to “turn off” or ignore the counter trending time periods. There
are a variety of very effective filters for markets that are strongly trending.
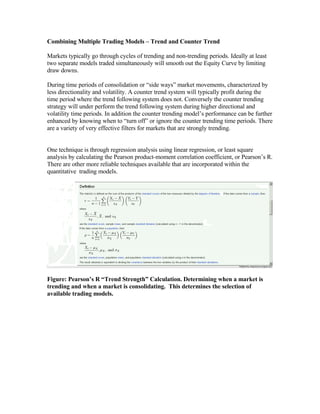
One technique is through regression analysis using linear regression, or least square
analysis by calculating the Pearson product-moment correlation coefficient, or Pearson’s R.
There are other more reliable techniques available that are incorporated within the
quantitative trading models.
Figure: Pearson’s R “Trend Strength” Calculation. Determining when a market is
trending and when a market is consolidating. This determines the selection of
available trading models.
5. Figure: Side by side comparison of Trend (left) and Counter Trend (right) daily P&L
for last two week periods.
6. Notice the largest loosing days on the left trend following column dated 1/22/09 a loss of $
-1386 was offset by a gain of $ +2243 in the trend following system.
Conversely the largest loosing day for the counter trend strategy was today, 2/04/09 for a
loss of $ - 673 which was offset by a gain of $1181 in the trend following system.
The over all effect is that the loosing day percentage goes from approximately 50 percent
to under 25 percent.
7. Figure: February 4, 2009 live trading results combining trend and counter trend
following systems.
8. Strategy Parallel Testing Phase Prior to Automating Trading.
There is only one way to insure with absolute certainty that a trading model’s results are
accurate. Equally important is insuring that there are not and error in sending orders to an
automated brokerage account. Sending automated trades for immediate execution to any
exchange can entail massive financial liability in the event of programming errors.
The system must be traded in real time during market hours in an actual brokerage account.
It is critical as an interim step to manually execute the trades before turning on automatic
execution.
Due to the time lag between recognizing a trade signal and manually entering the order, the
execution prices reported in the back test reports will not completely synchronized. Once
automated execution is implemented execution price should be 100% synchronized minus
slippage and commission costs. The foundation of a trading systems implementation is the
simulated back tested and forward tested results. These results must be meticulously
verified.
The main objective of this process is to manually insure when a trade signal occurs that the
prices reported in the back tester are aligned, to insure no erroneous trade orders are
generated and to insure that the rules designed into the model are being followed.
Programming in any language requires absolute precision and care in the design and
programming. Programming errors can occur this phase will eliminate the possibility that
any errors are present.
The actual results of today’s trading a profit of $527 matches the $515 reported by the back
testing report ($1188 profit in the trend following system minus a loss of $673 in the
counter trend trading system). Part of the trading model that is not yet implemented is a
scaling in and out of a position, e.g. when a significant profit occurs in a position a portion
of the position is closed. The back testing module is using a fixed share size of 100 shares,
the actual trading size for this phase of testing is between 25 and 200 shares, with 100
being the average to synchronize actual with back testing results.