Download to read offline
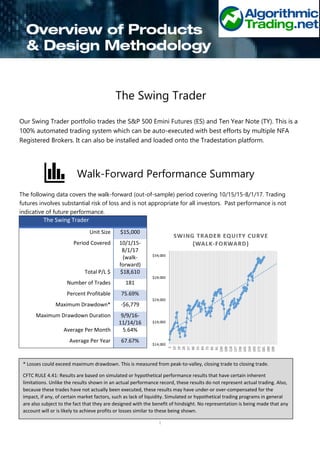
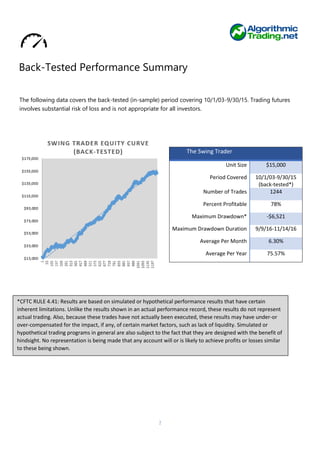


The document summarizes the performance of an automated trading system called the Swing Trader, which trades S&P 500 Emini Futures (ES) and Ten Year Note (TY). It provides details on the walk-forward and back-tested performance from 2003 to 2017, including total profit, number of trades, maximum drawdown, average monthly and annual returns. It also outlines two pricing options - an outright lease or profit share plan - and includes various disclaimers about hypothetical and back-tested performance.


