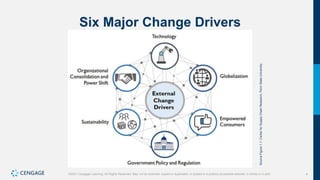
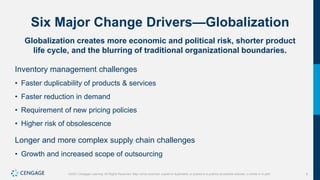
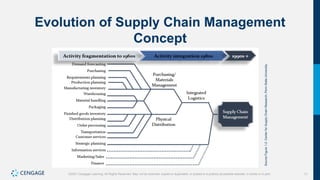
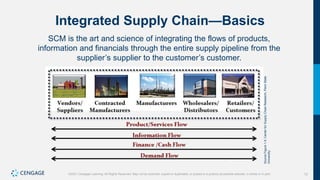
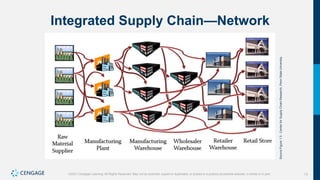
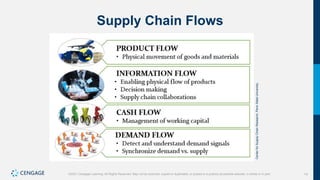
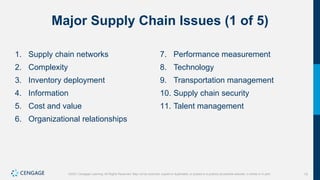
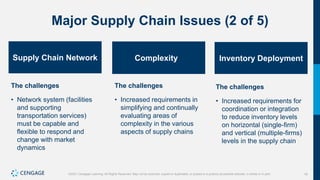
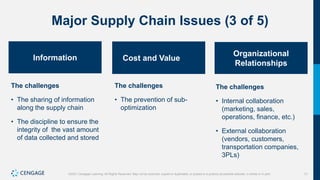
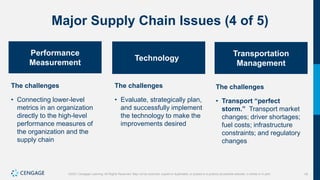
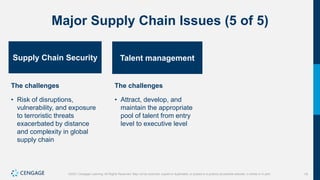
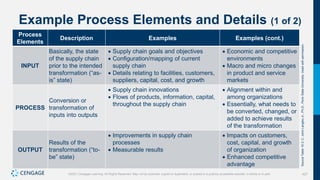
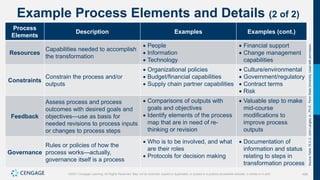
1
©2021 Cengage Learning. All Rights Reserved. May not be scanned, copied or duplicated, or posted to a publicly accessible website, in whole or in part.
Supply Chain
Management,
11e
Chapter 1: Supply Chain Management:
An Overview
©2021 Cengage Learning. All Rights Reserved. May not be scanned, copied or duplicated, or posted to a publicly accessible website, in whole or in part.
2
©2021 Cengage Learning. All Rights Reserved. May not be scanned, copied or duplicated, or posted to a publicly accessible website, in whole or in part.
Discussion Outline
• Five major change drivers
• Development of supply chain management concept
• Integrated supply chain characteristics
• Supply chain flows
• Major supply chain issues
3
©2021 Cengage Learning. All Rights Reserved. May not be scanned, copied or duplicated, or posted to a publicly accessible website, in whole or in part.
Leading Retailers (Sales/Year)
2000 2010 2015 2019
1. Wal-Mart 1. Wal-Mart 1. Wal-Mart 1. Wal-Mart
2. Kroger 2. Kroger 2. Costco 2. Amazon
3. The Home
Depot
3. Target 3. Kroger 3. Kroger
4. Sears, Roebuck
& Company
4. Walgreen 4. The Home Depot 4. Costco
5. Kmart 5. Home Depot 5. Target 5. Walgreens Boots Alliance
6. Albertson’s 6. Costco 6. Walgreen’s 6. The Home Depot
7. Target 7. CVS Caremark 7. CVS Caremark 7. CVS Health Corporation
8. JC Penney 8. Lowe’s 8. Amazon.com 8. Target
9. Costco 9. Best Buy 9. Lowe’s 9. Lowe’s Companies
10. Safeway 10. Sears Holdings 10. Best Buy 10. Albertsons Companies
Source
Table
1.1:
National
Retail
Federation
(NRF)
https://nrf.com/resources/annual-retailer-
lists/top-100-retailers
4
©2021 Cengage Learning. All Rights Reserved. May not be scanned, copied or duplicated, or posted to a publicly accessible website, in whole or in part.
Six Major Change Drivers
Source
Figure
1.1:
Center
for
Supply
Chain
Research,
Penn
State
University.
5
©2021 Cengage Learning. All Rights Reserved. May not be scanned, copied or duplicated, or posted to a publicly accessible website, in whole or in part.
Six Major Change Drivers—Globalization
Globalization creates more economic and political risk, shorter product
life cycle, and the blurring of traditional organizational boundaries.
Inventory management challenges
• Faster duplicability of products & services
• Faster reduction in demand
• Requirement of new pricing policies
• Higher risk of obsolescence
Longer and more complex supply chain challenges
• Growth and increased scope of outsourcing
6
©2021 Cengage Learning. All Rights Reserved. May not be scanned, copied or duplicated, or posted to a publicly accessible website, in whole or in part.
Six Major Change Drivers—Technology
Technology is a facilitator of internal process and supply chain
transformation. It is also a major force in changing the dynamics of
the marketplace.
The Internet. “Connected” 24/7
Social networks. Impact on customer demand and the speed of information
transfers
The world’s “knowledge pool” connection. Opportunities for collaboration in
supply chains.
7
©2021 Cengage Learning. All Rights Reserved. May not be scanned, copied or duplicated, or posted to a publicly accessible website, in whole or in part.
Six Major Change Drivers—Organization
Consolidation and Power Shifts
During the 1980s and especially the 1990s, economic power and the
driving force in supply chains shift from product manufacturers to
the retail end of the supply chain.
More collaboration among organizations in supply chains
• Win-win, improved services such as:
− Scheduled deliveries
− “Rainbow” pallets
− Advance shipments notices (ASNs) shrink-wrapped pallets
• Sharing of point-of-sale data to mitigate “bullwhip effect”
8
©2021 Cengage Learning. All Rights Reserved. May not be scanned, copied or duplicated, or posted to a publicly accessible website, in whole or in part.
Six Major Change Drivers—Empowered
Consumers
Consumers are empowered by exponentially expanded access to
product sources and related information and increased buying
power due to high income levels.
Increased pressures on supply chain due to increased demands at the
retail level in terms of:
• Competitive prices
• High quality in products and services
• Tailored or customized products
• Convenience and responsiveness – 24/7 availability with a minimum of wait time
• Flexibility – Omnichannel distribution strategies
9
©2021 Cengage Learning. All Rights Reserved. May not be scanned, copied or duplicated, or posted to a publicly accessible website, in whole or in part.
Six Major Change Drivers—Government
Policy and Regulation
More competitive environment is a result of the deregulation of
several important sectors in the United States occurred in the
1980s and 1990s.
The transportation industry. Expanded services beyond transportation, with
service providers’ role evolving to outsourcing partners
The financial sector. More flexible and responsive to customer needs, making
businesses more cognizant of supply chain management impact on efficiency and
cash flow
The communications industry. A component of the information revolution,
leading to dramatic improvements and opportunities in logistics and supply chains
10
©2021 Cengage Learning. All Rights Reserved. May not be scanned, copied or duplicated, or posted to a publicly accessible website, in whole or in part.
Six Major Change Drivers—Sustainability
The pursuit of sustainability is widely recognized as a key element
of successful supply chain management. This is critical to effective
risk management and achieving competitive advantage.
Society. Focus on people is a significant concern in the area of sustainability.
Environment. The objective of being “green” is a key element of making positive
contributions to improving our environment. There are many ways in which
supply chains may help to achieve desired outcomes.
Economy. Continued economic and financial sustainability is essential to
making future positive impacts on society and the environment.
11
©2021 Cengage Learning. All Rights Reserved. May not be scanned, copied or duplicated, or posted to a publicly accessible website, in whole or in part.
Evolution of Supply Chain Management
Concept
Source
Figure
1.2:
Center
for
Supply
Chain
Research,
Penn
State
University.
12
©2021 Cengage Learning. All Rights Reserved. May not be scanned, copied or duplicated, or posted to a publicly accessible website, in whole or in part.
Integrated Supply Chain—Basics
SCM is the art and science of integrating the flows of products,
information and financials through the entire supply pipeline from the
supplier’s supplier to the customer’s customer.
Source
Figure
1.4:
Center
for
Supply
Chain
Research,
Penn
State
University.
13
©2021 Cengage Learning. All Rights Reserved. May not be scanned, copied or duplicated, or posted to a publicly accessible website, in whole or in part.
Integrated Supply Chain—Network
Source
Figure
1.5
:
Center
for
Supply
Chain
Research,
Penn
State
University.
14
©2021 Cengage Learning. All Rights Reserved. May not be scanned, copied or duplicated, or posted to a publicly accessible website, in whole or in part.
Supply Chain Flows
Center
for
Supply
Chain
Research,
Penn
State
University.
15
©2021 Cengage Learning. All Rights Reserved. May not be scanned, copied or duplicated, or posted to a publicly accessible website, in whole or in part.
Major Supply Chain Issues (1 of 5)
1. Supply chain networks
2. Complexity
3. Inventory deployment
4. Information
5. Cost and value
6. Organizational relationships
7. Performance measurement
8. Technology
9. Transportation management
10. Supply chain security
11. Talent management
16
©2021 Cengage Learning. All Rights Reserved. May not be scanned, copied or duplicated, or posted to a publicly accessible website, in whole or in part.
Major Supply Chain Issues (2 of 5)
Supply Chain Network
The challenges
• Network system (facilities
and supporting
transportation services)
must be capable and
flexible to respond and
change with market
dynamics
Complexity
The challenges
• Increased requirements in
simplifying and continually
evaluating areas of
complexity in the various
aspects of supply chains
Inventory Deployment
The challenges
• Increased requirements for
coordination or integration
to reduce inventory levels
on horizontal (single-firm)
and vertical (multiple-firms)
levels in the supply chain
17
©2021 Cengage Learning. All Rights Reserved. May not be scanned, copied or duplicated, or posted to a publicly accessible website, in whole or in part.
Major Supply Chain Issues (3 of 5)
Information
The challenges
• The sharing of information
along the supply chain
• The discipline to ensure the
integrity of the vast amount
of data collected and stored
Cost and Value
The challenges
• The prevention of sub-
optimization
Organizational
Relationships
The challenges
• Internal collaboration
(marketing, sales,
operations, finance, etc.)
• External collaboration
(vendors, customers,
transportation companies,
3PLs)
18
©2021 Cengage Learning. All Rights Reserved. May not be scanned, copied or duplicated, or posted to a publicly accessible website, in whole or in part.
Major Supply Chain Issues (4 of 5)
Performance
Measurement
The challenges
• Connecting lower-level
metrics in an organization
directly to the high-level
performance measures of
the organization and the
supply chain
Technology
The challenges
• Evaluate, strategically plan,
and successfully implement
the technology to make the
improvements desired
Transportation
Management
The challenges
• Transport “perfect
storm.” Transport market
changes; driver shortages;
fuel costs; infrastructure
constraints; and regulatory
changes
19
©2021 Cengage Learning. All Rights Reserved. May not be scanned, copied or duplicated, or posted to a publicly accessible website, in whole or in part.
Major Supply Chain Issues (5 of 5)
Supply Chain Security
The challenges
• Risk of disruptions,
vulnerability, and exposure
to terroristic threats
exacerbated by distance
and complexity in global
supply chain
Talent management
The challenges
• Attract, develop, and
maintain the appropriate
pool of talent from entry
level to executive level
20
©2021 Cengage Learning. All Rights Reserved. May not be scanned, copied or duplicated, or posted to a publicly accessible website, in whole or in part.
Summary
• The rate of change has been driven by a set of external forces including
globalization, technology, organizational consolidation and shifts in power in
supply chains, empowered consumers, and government policy and regulations.
• Supply chains are extended enterprises which require managing four flows—
products, information, financials (cash), and demand on a collaborative basis.
• The global supply chains of the best companies must be adaptive, resilient,
and responsive to meet the challenges of the global economy and develop
mitigating strategies for disruptive forces.
21
©2021 Cengage Learning. All Rights Reserved. May not be scanned, copied or duplicated, or posted to a publicly accessible website, in whole or in part.
Supply Chain
Management,
11e
Chapter 2: Global Dimensions of
Supply Chains
©2021 Cengage Learning. All Rights Reserved. May not be scanned, copied or duplicated, or posted to a publicly accessible website, in whole or in part.
22
©2021 Cengage Learning. All Rights Reserved. May not be scanned, copied or duplicated, or posted to a publicly accessible website, in whole or in part.
Discussion Outline
• Rationale for global trade and commerce
• Contributing factors for global commerce and supply chain flows
• Supply chains in global economy
• Global markets and strategy
• Supply chain security and role of ports
• Free trade agreements
23
©2021 Cengage Learning. All Rights Reserved. May not be scanned, copied or duplicated, or posted to a publicly accessible website, in whole or in part.
Rationale for Global Trade and Commerce
• Absolute advantage
− Lower cost and/or access to items not available locally
• Comparative advantage
− Differences in the cost of producing products in different countries
24
©2021 Cengage Learning. All Rights Reserved. May not be scanned, copied or duplicated, or posted to a publicly accessible website, in whole or in part.
Contributing Factors for
Global Flows and Supply
Chain Flows
25
©2021 Cengage Learning. All Rights Reserved. May not be scanned, copied or duplicated, or posted to a publicly accessible website, in whole or in part.
Contributing Factors for Global Flows
and Trade
1. Population size and distribution
2. Urbanization
3. Land and resources
4. Technology and information
5. Globalized economy
26
©2021 Cengage Learning. All Rights Reserved. May not be scanned, copied or duplicated, or posted to a publicly accessible website, in whole or in part.
Population = Labor (1 of 3)
Rank Country
2000 Population
(in thousands)
2010 Population
(in thousands)
2019 Population
(in thousands)
2050 Expected
Population (in
thousands)
1 China 1,268,302 1,336,681 1,389,619 1,301,627
2 India 1,006,300 1,173,108 1,311,559 1,656,554
3 United States 282,162 309,338 331,884 398,328
4 Indonesia 214,091 243,423 264,936 300,183
5 Pakistan 152,429 195,834 210,798 290,848
6 Brazil 174,315 184,405 210,302 232,304
7 Nigeria 125,581 165,905 208,679 416,996
8 Bangladesh 128,735 146,616 161,063 193,093
9 Russia 147,054 142,527 141,945 129,908
10 Mexico 99,775 114,061 127,318 150,568
Source
Table
2.1:
U.S.
and
World
Population
Clock
and
International
Data
Base
(IDB),
U.S.
Census
Bureau
(https://www.census.gov/popclock/),
and
U.S.
Census
Bureau
(https://www.census.gov/data-
tools/demo/idb/informationGateway.php).
27
©2021 Cengage Learning. All Rights Reserved. May not be scanned, copied or duplicated, or posted to a publicly accessible website, in whole or in part.
Population = Labor (2 of 3)
Totals
2000 Population (in
thousands)
2010 Population
(in thousands)
2019 Population
(in thousands)
2050 Expected
Population
(in thousands)
TOP TEN
Countries
3,598,744 4,011,898 4,358,102 5,070,409
Top Ten
Percentage
of World
Population
59% 58% 58% 53%
TOTAL World
Population
6,086,149 6,872,671 7,560,290 9,488,153
Source
Table
2.1:
U.S.
and
World
Population
Clock
and
International
Data
Base
(IDB),
U.S.
Census
Bureau
(https://www.census.gov/popclock/),
and
U.S.
Census
Bureau
(https://www.census.gov/data-
tools/demo/idb/informationGateway.php).
28
©2021 Cengage Learning. All Rights Reserved. May not be scanned, copied or duplicated, or posted to a publicly accessible website, in whole or in part.
Population = Labor (3 of 3)
Source:
United
Nations,
Department
of
Economic
and
Social
Affairs,
Population
Division
(2017).
World
Population
Prospects:
The
2017
Revision,
custom
data
acquired
via
website.
(https://population.un.org/wpp/Publications/).
29
©2021 Cengage Learning. All Rights Reserved. May not be scanned, copied or duplicated, or posted to a publicly accessible website, in whole or in part.
Urbanization
• The rise of “megacities”
− By 2030, 60% of the world’s
population will live in urban
areas (vs. 47% in 2000)
• Change most profound in less
and least developed countries of
the world
− Urban sustainability challenges
Urban sustainability challenges
• Waste and pollution
• Water and energy
• Traffic congestions
• Health problems
• Green spaces
• Poverty
• Social security
30
©2021 Cengage Learning. All Rights Reserved. May not be scanned, copied or duplicated, or posted to a publicly accessible website, in whole or in part.
Land and Resources
Critical role of technology in mitigating resource scarcity
Crop & forest
Land
Water Food Energy
31
©2021 Cengage Learning. All Rights Reserved. May not be scanned, copied or duplicated, or posted to a publicly accessible website, in whole or in part.
Technology and Information
Technology has two important dimensions.
• Technology as an “internal” change agent
− Enhanced efficiency, effectiveness, and ability of an organization to compete
in the global marketplace
• Technology as an “external” change agent
− New forms of competition or new business models (e.g. omnichannel
distribution, global outsourcing)
32
©2021 Cengage Learning. All Rights Reserved. May not be scanned, copied or duplicated, or posted to a publicly accessible website, in whole or in part.
Globalized Economy
Export-Trade Flows of Merchandise (2018)
Source
Figure
2.2:
©
World
Trade
Organization
2019
“International
Trade
and
Market
Access
Data”
33
©2021 Cengage Learning. All Rights Reserved. May not be scanned, copied or duplicated, or posted to a publicly accessible website, in whole or in part.
Globalized Economy
Import-Trade Flows of Merchandise (2018)
Source
Figure
2.3:
©
World
Trade
Organization
2019
“International
Trade
and
Market
Access
Data”
34
©2021 Cengage Learning. All Rights Reserved. May not be scanned, copied or duplicated, or posted to a publicly accessible website, in whole or in part.
Top U.S. Trading Partners (US$ Billions)
2010 2014 2018
China $ 456.80 $ 590.70 $ 659.80
Canada $ 525.30 $ 658.10 $ 617.20
Mexico $ 393.00 $ 534.50 $ 611.50
Japan $ 180.90 $ 200.90 $ 217.60
Germany $ 130.90 $ 172.60 $ 183.60
South Korea $ 87.70 $ 114.10 $ 130.60
United Kingdom $ 98.30 $ 107.90 $ 127.00
France $ 65.60 $ 78.20 $ 88.80
India $ 48.80 $ 66.90 $ 87.50
Italy $ 42.73 $ 59.10 $ 77.90
Total Top Ten $ 2,030.03 $ 2,583.00 $ 2,801.50
Top Ten Percentage of Total, All Countries 63.63% 65.08% 66.59%
TOTAL All Countries $ 3,190.20 $ 3,969.10 $ 4,206.90
Source
Table
2.5:
Source:
U.S.
Census
Bureau
(Top
Trading
Partners
(https://www.census.gov/foreign-trade/statistics/highlights/top/index.html);
and
U.S.
Census
Bureau
(https://www.census.gov/foreign-trade/balance/index.html).
35
©2021 Cengage Learning. All Rights Reserved. May not be scanned, copied or duplicated, or posted to a publicly accessible website, in whole or in part.
Supply Chains in Global
Economy
36
©2021 Cengage Learning. All Rights Reserved. May not be scanned, copied or duplicated, or posted to a publicly accessible website, in whole or in part.
Supply Chain in Global Economy
Global trade growth has been fueled by free trade agreements (FTAs) that lift most
tariff, quota, and fee/tax limitations on trade.
The best supply chains compete successfully on a national, regional, and global basis.
Bilateral  FTAs  Regional
• Bi-lateral
agreements are
between two
nations
• US currently in 20
bi-lateral FTAs
• Regional trade agreements involve 3 or more nations
• US currently involved in:
− Free Trade Area of Americas
− Middle East Free Trade Initiatives
− Enterprise for ASEAN Initiatives
− North American Free Trade Agreement (NAFTA)
− USMCA (US-Mexico-Canada) Agreement (proposed)
37
©2021 Cengage Learning. All Rights Reserved. May not be scanned, copied or duplicated, or posted to a publicly accessible website, in whole or in part.
Micro Perspective of
Global Supply Chains
Global Markets and Strategy
38
©2021 Cengage Learning. All Rights Reserved. May not be scanned, copied or duplicated, or posted to a publicly accessible website, in whole or in part.
Global Markets and Strategy
Success in the global market-place requires development of a cohesive set
of strategies including product development, technology, marketing,
manufacturing, and supply chains.
• Supply chain perspective
• Customer service perspective
39
©2021 Cengage Learning. All Rights Reserved. May not be scanned, copied or duplicated, or posted to a publicly accessible website, in whole or in part.
Global Markets and Strategy
Supply Chain Perspective
1. Strategically sourcing materials and components worldwide
2. Selecting global locations for key supply depots and DCs
3. Evaluating transportation alternatives and channel intermediaries
4. Understanding governmental influences on global SC flows
5. Examining opportunities for collaboration with 3PLs or 4PLs
40
©2021 Cengage Learning. All Rights Reserved. May not be scanned, copied or duplicated, or posted to a publicly accessible website, in whole or in part.
Global Markets and Strategy
Customer Service Perspective
1. Standardization to reduce complexity must maintain some customization.
2. Global competition often reduces the product life cycle.
3. Organizational structures and business models change with more outsourcing.
4. Globalization introduces more volatility and complexity.
41
©2021 Cengage Learning. All Rights Reserved. May not be scanned, copied or duplicated, or posted to a publicly accessible website, in whole or in part.
Supply Chain Security and
Role of Ports
42
©2021 Cengage Learning. All Rights Reserved. May not be scanned, copied or duplicated, or posted to a publicly accessible website, in whole or in part.
Supply Chain Security
A Balancing Act
Security Measures
• The Trade Act of 2002
• The U.S. Maritime Transportation
Security Act of 2002
• The Customs Trade Partnership
Against Terrorism (C-TPAT)
Global Trade Flows
• Electronic filing of cargo information
• Standards for container seals and
locks, cargo tracking, identification,
and screening systems for ocean
containers
• A “green lane”
43
©2021 Cengage Learning. All Rights Reserved. May not be scanned, copied or duplicated, or posted to a publicly accessible website, in whole or in part.
Role of Ports
Global Supply Chain and Security
Ports are a critical part of global supply chains and a major
focus for global security.
• Over 90 percent of U.S. international trade passes through ports.
• Ports are bases of operation to deploy troops and equipment.
44
©2021 Cengage Learning. All Rights Reserved. May not be scanned, copied or duplicated, or posted to a publicly accessible website, in whole or in part.
Free Trade Agreements
45
©2021 Cengage Learning. All Rights Reserved. May not be scanned, copied or duplicated, or posted to a publicly accessible website, in whole or in part.
Supply Chain in Global Economy
NAFTA  USMCA Agreement
• NAFTA
− Established free trade among Canada, the U.S., and Mexico.
− Goals involved making structural changes to operate a borderless logistics
network in North America.
• USMCA (2020)
− Proposed multi-lateral trade agreement with U.S., Mexico, and Canada
46
©2021 Cengage Learning. All Rights Reserved. May not be scanned, copied or duplicated, or posted to a publicly accessible website, in whole or in part.
Summary
• Trade flows between the United States and other countries have grown
considerably, resulting in global supply chains becoming increasingly important.
• The increased complexity and competitiveness of a global economy have
resulted in shorter product life cycles, new forms of competition, and new
business models.
• Success in the global marketplace requires ongoing development of a cohesive
set of strategies that has implications to both supply chains and customer
services.
• Companies individually, jointly, and in cooperation with the government are
actively involved in supply chain security.
• With increasing regional economic integration, NAFTA has helped to
foster trade in North America. Proposed USMCA Agreement should
exceed benefits of NAFTA
47
©2021 Cengage Learning. All Rights Reserved. May not be scanned, copied or duplicated, or posted to a publicly accessible website, in whole or in part.
Supply Chain
Management,
11e
Chapter 3: Role of Logistics in Supply
Chains
©2021 Cengage Learning. All Rights Reserved. May not be scanned, copied or duplicated, or posted to a publicly accessible website, in whole or in part.
48
©2021 Cengage Learning. All Rights Reserved. May not be scanned, copied or duplicated, or posted to a publicly accessible website, in whole or in part.
Discussion Outline
• Value-added roles of logistics
• Key logistics activities
• Macro perspective on logistics
• Micro dimension of logistics
• Logistics and systems analysis
49
©2021 Cengage Learning. All Rights Reserved. May not be scanned, copied or duplicated, or posted to a publicly accessible website, in whole or in part.
What Is Logistics?
Logistics can be viewed as part of organizational management with four
major subdivisions.
1. Business Logistics. Part of supply chain that plans, implements, and controls
the flow and storage of goods, services, and related information.
2. Military Logistics. Design and integration of all aspects of support for the
operational capability of the military forces and their equipment.
3. Event Logistics. Network of activities, facilities & personnel required to
organize, schedule & deploy the resources for an event to take place and
withdraw after the event.
4. Service Logistics. Acquisition, scheduling & management of facilities, assets,
personnel & materials to support a service operation & business.
50
©2021 Cengage Learning. All Rights Reserved. May not be scanned, copied or duplicated, or posted to a publicly accessible website, in whole or in part.
Value-added Roles of Logistics
Five Principal Types of Economic Utility
Economic Utility
 Time
 Form
 Possession
 Quantity
 Place
51
©2021 Cengage Learning. All Rights Reserved. May not be scanned, copied or duplicated, or posted to a publicly accessible website, in whole or in part.
Value-added Roles of Logistics
Generally, production/manufacturing activities are credited with providing form
utility; logistics activities with time, place, and quantity utilities; and marketing
activities with possession utility.
52
©2021 Cengage Learning. All Rights Reserved. May not be scanned, copied or duplicated, or posted to a publicly accessible website, in whole or in part.
Key Logistics Activities
1. Transportation
2. Storage
3. Industrial packaging
4. Materials handling
5. Inventory control
6. Order fulfillment
7. Demand forecasting
8. Production planning & scheduling
9. Procurement
10.Customer service
11.Plant & warehouse site location
12.Others*
* Others include parts and service
support, return goods handling, and
salvage and scrap disposal.
53
©2021 Cengage Learning. All Rights Reserved. May not be scanned, copied or duplicated, or posted to a publicly accessible website, in whole or in part.
Macro Perspective on
Logistics
54
©2021 Cengage Learning. All Rights Reserved. May not be scanned, copied or duplicated, or posted to a publicly accessible website, in whole or in part.
Macro Perspective on Logistics
U.S. Business Logistics Costs
Source
Figure
3.2:
Reproduced
with
permission
from
Council
of
Supply
Chain
Management
Professionals.
55
©2021 Cengage Learning. All Rights Reserved. May not be scanned, copied or duplicated, or posted to a publicly accessible website, in whole or in part.
Macro Perspective on Logistics
U.S. Logistics Costs as Percent of GDP
56
©2021 Cengage Learning. All Rights Reserved. May not be scanned, copied or duplicated, or posted to a publicly accessible website, in whole or in part.
Macro Perspective of Logistics
U.S. Business Logistics Costs – 2018 (1 of 2)
US business logistics costs ($ billion) 2018 YoY 18/17 5-yr. CAGR
Transportation costs
Full truckload 296.1 7.6% 3.6%
Less-than-truckload 71.8 8.3% 3.5%
Private or dedicated 300.9 13.1% 7.1%
Motor carriers 668.8 10.1% 5.1%
Parcel 104.9 8.7% 8.0%
Carload 61.4 7.2% −0.6%
Intermodal 27.0 28.7% 8.1%
Rail 88.4 12.9% 1.6%
Air freight (includes domestic, import, export, cargo, and express) 76.5 9.2% 3.8%
Water and ports (includes domestic, import, and export) 45.7 12.8% 1.5%
Pipeline 53.0 12.7% 12.7%
Subtotal 1,037.4 10.4% 5.1%
Source:
CSCMP’s
30
th
Annual
State
of
Logistics
Report,
2019
57
©2021 Cengage Learning. All Rights Reserved. May not be scanned, copied or duplicated, or posted to a publicly accessible website, in whole or in part.
Macro Perspective of Logistics
U.S. Business Logistics Costs – 2018 (2 of 2)
US business logistics costs ($ billion) 2018 YoY 18/17 5-yr. CAGR
Inventory carrying costs
Storage 153.1 3.2% 3.0%
Financial cost (WACC × total business inventory) 192.5 26.0% 3.0%
Other (obsolescence, shrinkage, insurance, handling, others) 148.1 14.8% 3.0%
Subtotal 493.7 14.8% 3.0%
Other costs
Carriers’ support activities 52.3 10.3% 4.5%
Shippers’ administrative costs 52.1 2.8% 5.3%
Subtotal 104.4 6.4% 4.9%
Total US business logistics costs 1,635.46 11.4% 4.4%
Source:
CSCMP’s
30
th
Annual
State
of
Logistics
Report,
2019
58
©2021 Cengage Learning. All Rights Reserved. May not be scanned, copied or duplicated, or posted to a publicly accessible website, in whole or in part.
Micro Dimensions of
Logistics
Logistics Interface with other functional areas
Factors affecting cost & importance of logistics
59
©2021 Cengage Learning. All Rights Reserved. May not be scanned, copied or duplicated, or posted to a publicly accessible website, in whole or in part.
Micro Dimensions of Logistics
Logistics Interfaces with Other Functional Areas
Logistics
Manufacturing
• Length of the production run
• Available quantity of raw material and
component
• Industrial packaging
Marketing (4 Ps – Marketing Mix)
• Price (e.g. purchase quantity
discounts)
• Product (e.g. size, shape, weight,
packaging)
• Promotion
• Place (distribution channel selection)
Finance
• Inventory
• Warehouses & transportation fleet
owned and/or outsourced
• Customer service
Accounting
• Cost information for analysis of
alternative logistics options
• Supply chain tradeoffs and
performance measurement
60
©2021 Cengage Learning. All Rights Reserved. May not be scanned, copied or duplicated, or posted to a publicly accessible website, in whole or in part.
Micro Dimensions of Logistics (1 of 5)
Factors Affecting Cost & Importance of Logistics
1. Competitive relationships
2. Order cycle length
3. Substitutability
4. Inventory effect
5. Transportation effect
6. Product-related factors
7. Spatial relationships
61
©2021 Cengage Learning. All Rights Reserved. May not be scanned, copied or duplicated, or posted to a publicly accessible website, in whole or in part.
Micro Dimensions of Logistics (2 of 5)
Factors Affecting Cost & Importance of Logistics
Competitive
Relationships
• Customer service can
be a very important
form of competition.
Order Cycle Length
• Shorter order cycles
reduce the inventory
required by the
customer.
Substitutability
• Customer service is
important for highly
substitutable products
to reduce lost sales
cost.
62
©2021 Cengage Learning. All Rights Reserved. May not be scanned, copied or duplicated, or posted to a publicly accessible website, in whole or in part.
Micro Dimensions of Logistics (3 of 5)
Factors Affecting Cost & Importance of Logistics
Inventory Effect
• Increasing inventory
costs can reduce the
cost of lost sales.
Transportation Effect
• Cost of lost sales can
be reduced by
spending more on
transportation service
to improve customer
service.
Spatial Relationships
• The location of fixed
points in the logistics
system with respect to
demand and supply
points are very
important to
transportation costs.
63
©2021 Cengage Learning. All Rights Reserved. May not be scanned, copied or duplicated, or posted to a publicly accessible website, in whole or in part.
Micro Dimensions of Logistics (4 of 5)
Factors Affecting Cost & Importance of Logistics
Product-related Factors
• Dollar value. The product’s dollar value typically affects warehousing costs, inventory
costs, transportation costs, packaging costs, and even materials-handling costs.
• Density. Weight/space ratio affects transportation and warehousing costs. As
density increases for a product, its transportation and warehousing costs tend to
decrease.
• Susceptibility to damage. The greater the risk of damage to a product, the higher
the transportation and warehousing cost.
• Special handling requirements. Need for special handling (e.g. refrigeration,
heating, or strapping) will usually increase warehousing, transportation, and
packaging costs.
64
©2021 Cengage Learning. All Rights Reserved. May not be scanned, copied or duplicated, or posted to a publicly accessible website, in whole or in part.
Micro Dimensions of Logistics (5 of 5)
Factors Affecting Cost & Importance of Logistics
Spatial Relationship Example
Source
Figure
3.11:
Center
for
Supply
Chain
Research,
Penn
State
University.
65
©2021 Cengage Learning. All Rights Reserved. May not be scanned, copied or duplicated, or posted to a publicly accessible website, in whole or in part.
Logistics and Systems
Analysis
66
©2021 Cengage Learning. All Rights Reserved. May not be scanned, copied or duplicated, or posted to a publicly accessible website, in whole or in part.
Logistics and Systems Analysis
Short-run and Long-run Analysis
Short-run or Static Analysis
• Concentrates on a specific point in time or level of production output.
Long-run or Dynamic Analysis
• Examines a logistics system over a long time period or range of output.
67
©2021 Cengage Learning. All Rights Reserved. May not be scanned, copied or duplicated, or posted to a publicly accessible website, in whole or in part.
Logistics and Systems Analysis
Approaches to Analyzing Logistics Systems
The analysis of logistics systems may require different views or perspectives of logistics activities.
• Materials management vs. physical distribution
− Examine logistics as inbound vs. outbound logistics.
• Cost centers
− Examine logistics activities as cost centers, allowing tradeoffs between them to be analyzed.
• Nodes vs. links
− Examine nodes (fixed spatial points where goods stop for storage or processing) vs. links
(transportation network that connect the nodes in the logistics system).
• Logistics channels
− Examine supply chain of network organizations engaged in transfer, storage, handling,
communication, and other functions that contribute to product flow.
68
©2021 Cengage Learning. All Rights Reserved. May not be scanned, copied or duplicated, or posted to a publicly accessible website, in whole or in part.
Summary
• Logistics adds place, time, and quantity utilities to products and enhances the
form and possession utilities added by manufacturing and marketing.
• Key logistics activities are transportation, inventory, warehousing, materials
handling, industrial packaging, customer service, and forecasting.
• On a macro basis, logistics-related costs have helped the U.S. economy maintain
its competitive position on a global basis.
• On a micro basis, logistics interface with other functional areas which aids in
making organizations more efficient and effective.
• The cost of logistics systems can be affected by market competition, spatial
relationship of nodes, and product characteristics.
• Four approaches to analyzing logistics systems are: materials
management vs. physical distribution, cost centers, nodes vs. links,
and distribution channels.
69
©2021 Cengage Learning. All Rights Reserved. May not be scanned, copied or duplicated, or posted to a publicly accessible website, in whole or in part.
Supply Chain
Management,
11e
Chapter 4: Distribution and Omni-
Channel Network Design
©2021 Cengage Learning. All Rights Reserved. May not be scanned, copied or duplicated, or posted to a publicly accessible website, in whole or in part.
70
©2021 Cengage Learning. All Rights Reserved. May not be scanned, copied or duplicated, or posted to a publicly accessible website, in whole or in part.
Discussion Outline
• Drivers of supply chain network redesign
• Process of comprehensive supply chain network design
• Major locational determinants
• Modeling approaches for supply chain network design
• Omni-channel network design
71
©2021 Cengage Learning. All Rights Reserved. May not be scanned, copied or duplicated, or posted to a publicly accessible website, in whole or in part.
Drivers of Supply Chain Network Redesign
1. Changes in global trade patterns
2. Changes in customer service requirements – The emergence of omni-channel
supply chains
3. Shifts in customer and/or supply market locations
4. Changes in corporate ownership/merger and acquisition activity
5. Cost pressures
6. Competitive capabilities
7. Corporate organizational change
72
©2021 Cengage Learning. All Rights Reserved. May not be scanned, copied or duplicated, or posted to a publicly accessible website, in whole or in part.
Macro Perspective on Logistics
U.S. Business Logistics Costs
Source
Figure
4.1:
C.
John
Langley
Jr.,
Ph.D.,
Penn
State
University.
Used
with
permission.
73
©2021 Cengage Learning. All Rights Reserved. May not be scanned, copied or duplicated, or posted to a publicly accessible website, in whole or in part.
Supply Chain Network Design Process
Step 1: Define the Supply Chain Network Design Process
• Form a supply chain network transformation team.
• Establish the parameters and objectives of the network design or redesign
process.
• Evaluate the potential involvement of third-party suppliers of logistics services.
74
©2021 Cengage Learning. All Rights Reserved. May not be scanned, copied or duplicated, or posted to a publicly accessible website, in whole or in part.
Supply Chain Network Design Process
Step 2: Perform a Supply Chain Audit
1. Fundamental Business Information
2. Logistics/Supply Chain System
3. Key Logistics/Supply Chain Activities
4. Measurement and Evaluation
5. Strategic Logistics/Supply Chain Issues
6. Logistics/Supply Chain Strategic Plan
75
©2021 Cengage Learning. All Rights Reserved. May not be scanned, copied or duplicated, or posted to a publicly accessible website, in whole or in part.
Supply Chain Network Design Process
Step 3: Examine the Supply Chain Network Alternatives
• Apply suitable quantitative models to the current logistics system and to the
alternatives under consideration.
• Identify preliminary supply chain network design solutions consistent with the
key objectives identified during the audit phase.
• Conduct “what-if” analysis to test the sensitivity of recommended network
designs to changes in key variables.
76
©2021 Cengage Learning. All Rights Reserved. May not be scanned, copied or duplicated, or posted to a publicly accessible website, in whole or in part.
Supply Chain Network Design Process
Step 4: Conduct a Facility Location Analysis
• Form a location selection team.
• Qualitatively and quantitatively analyze the attributes of specific regions and
locales.
• Identify recommended specific sites for logistics facilities.
77
©2021 Cengage Learning. All Rights Reserved. May not be scanned, copied or duplicated, or posted to a publicly accessible website, in whole or in part.
Supply Chain Network Design Process
Step 5: Make Decisions Regarding Network and Facility Location
Evaluate the recommended network and specific sites for logistics facilities
(Steps 3 and 4) for consistency with the design criteria identified in Step 1.
78
©2021 Cengage Learning. All Rights Reserved. May not be scanned, copied or duplicated, or posted to a publicly accessible website, in whole or in part.
Supply Chain Network Design Process
Step 6: Develop an Implementation Plan
• Develop a “blueprint for change” as a road map for moving from the current
supply chain network to the desired new one.
• Commit the resources necessary to assure a smooth, timely implementation,
and the continuous improvement of the network decisions.
79
©2021 Cengage Learning. All Rights Reserved. May not be scanned, copied or duplicated, or posted to a publicly accessible website, in whole or in part.
Major Locational
Determinants
80
©2021 Cengage Learning. All Rights Reserved. May not be scanned, copied or duplicated, or posted to a publicly accessible website, in whole or in part.
Broad Geographic and Site-Specific
Locational Determinants
Global/National/ Regional Determinants
• Labor climate
• Transportation services and infrastructure
• Proximity to markets and customers
• Quality of life
• Taxes and industrial development incentives
• Supplier networks
• Land costs and utilities
• IT infrastructure
• Company preference
Site-Specific Determinants
• Transportation access
− Truck
− Air
− Rail
− Water
• Inside/outside metropolitan area
• Availability of workforce and needed skill sets
• Land costs and taxes
• Utilities
81
©2021 Cengage Learning. All Rights Reserved. May not be scanned, copied or duplicated, or posted to a publicly accessible website, in whole or in part.
Current Trends Governing Site Selection
Site Selection
• Strategic positioning of inventories (fast-moving, profitable items vs. slower-
moving, less-profitable items)
• Greater use of “Customer-direct” delivery from manufacturing
• Growing use of and need for strategically located cross-docking facilities
• Greater emphasis on access to major airports and/or ocean ports for import and
export shipments
• Greater use of providers of third-party-logistics services
82
©2021 Cengage Learning. All Rights Reserved. May not be scanned, copied or duplicated, or posted to a publicly accessible website, in whole or in part.
Modeling Approaches for
Supply Chain Network Design
83
©2021 Cengage Learning. All Rights Reserved. May not be scanned, copied or duplicated, or posted to a publicly accessible website, in whole or in part.
A Network Design Model
The Challenge of Supply Chain Complexity
Source
Figure
4.4:
SAILS:
Strategic
Analysis
of
Integrated
Logistics
Systems
(Manassas,
VA:
Insight,
Inc.):
Reproduced
by
permission.
84
©2021 Cengage Learning. All Rights Reserved. May not be scanned, copied or duplicated, or posted to a publicly accessible website, in whole or in part.
A Network Design Model
Objective and Need for Decision Support Tools
Answering network design questions today is virtually impossible
without the help of very powerful decision support tools.
Classic Objective
• Finished goods DCs
• Expanded scope &
complexity of network
design model
Today’s Objective
• Procurement
• Various stages of manufacturing
• DCs
• Transport flows
85
©2021 Cengage Learning. All Rights Reserved. May not be scanned, copied or duplicated, or posted to a publicly accessible website, in whole or in part.
Types of Modeling Approaches
Modeling Approaches
• Optimization Models
− Designed to find the “best,” or optimum solution, while recognizing relevant
constraints.
• Simulation Models
− Designed to develop a computer representation of supply chain network &
observe changes as cost structures, constraints, and other factors are varied.
• Heuristic Models (e.g. grid technique)
− Designed to reduce a problem to a manageable size and search
automatically through various alternatives in an attempt to find a better
solution.
86
©2021 Cengage Learning. All Rights Reserved. May not be scanned, copied or duplicated, or posted to a publicly accessible website, in whole or in part.
Potential Supply Chain Modeling
Pitfalls to Avoid
• Inaccurate or incomplete data
• Level of detail
• Sensitivity analysis
• Linearity of transportation costs
• Geographic concerns
• Time horizon
• Use of appropriate analytical techniques
• “Fluctuating” model inputs
87
©2021 Cengage Learning. All Rights Reserved. May not be scanned, copied or duplicated, or posted to a publicly accessible website, in whole or in part.
Omni-Channel
Network Design
88
©2021 Cengage Learning. All Rights Reserved. May not be scanned, copied or duplicated, or posted to a publicly accessible website, in whole or in part.
Omni-Channel Retailing Defined
“A direct to consumer (D2C) business model where all sales channels
ranging from online, mobile, telephonic, mail order, self-service, and
physical retail establishments are aligned and fulfillment processes
integrated to provide consumers with a seamless shopping experience in
alignment with the company’s brand proposition.”
Three Important Elements
• Omni-channel strategy must align with the firm’s “go to market” strategy.
• The fulfillment processes must be integrated regardless of order entry point.
• Ease of shopping” for the consumer is a priority regardless of where or how the
order is placed.
89
©2021 Cengage Learning. All Rights Reserved. May not be scanned, copied or duplicated, or posted to a publicly accessible website, in whole or in part.
Omni-Channel Network Design
Marketing Channel vs. Logistics Channel
Source
Figure
4.7:
Robert
A.
Novack,
Ph.D.
Used
with
permission.
90
©2021 Cengage Learning. All Rights Reserved. May not be scanned, copied or duplicated, or posted to a publicly accessible website, in whole or in part.
Omni-Channel Network Design
Cost Consideration
Fixed Cost and Variable Cost Consideration:
A Rule of Thumb in Channel Design
“Assuming that the origin and destination remain the same, the more
intermediaries used to deliver the product the higher the fixed cost and the
lower the variable cost, and vice versa.”
91
©2021 Cengage Learning. All Rights Reserved. May not be scanned, copied or duplicated, or posted to a publicly accessible website, in whole or in part.
Omni-Channel Network Design (1 of 2)
Customer Order Fulfillment Models
• Integrated Fulfillment
• Store Fulfillment
• Flow-Through Fulfillment
• Direct Store Delivery (DSD)
• Pool Distribution
• Dedicated Fulfillment
92
©2021 Cengage Learning. All Rights Reserved. May not be scanned, copied or duplicated, or posted to a publicly accessible website, in whole or in part.
Omni-Channel Network Design (2 of 2)
Customer Order Fulfillment Models
Source
Figure
4.9:
Robert
A.
Novack,
Ph.D.
Used
with
permission.
93
©2021 Cengage Learning. All Rights Reserved. May not be scanned, copied or duplicated, or posted to a publicly accessible website, in whole or in part.
Omni-Channel Customer Fulfillment Models
Integrated Fulfillment
Source
Figure
4.10:
Robert
A.
Novack,
Ph.D.
Used
with
permission.
Integrated fulfillment means the retailer operates one distribution network to service both “bricks-and-
mortar” (retail stores) and “clicks-and-mortar” (Internet sites) channels.
• Advantages: Low start-up costs for retailers, Workforce efficiency
• Disadvantages: Order profile changes, Unavailability of products in eaches, “Fast pick” or broken case
operation requirements for unit pick (each pick)
94
©2021 Cengage Learning. All Rights Reserved. May not be scanned, copied or duplicated, or posted to a publicly accessible website, in whole or in part.
Omni-Channel Customer Fulfillment Models
Dedicated Fulfillment
Source
Figure
4.11:
Robert
A.
Novack,
Ph.D.
Used
with
permission.
Dedicated fulfillment means the retailer operates two separate distribution networks to service “bricks-and-
mortar” (retail stores) and “clicks-and-mortar” (Internet sites).
• Advantages: Elimination of most of the disadvantages of integrated fulfillment
• Disadvantages: Duplicate facilities and duplicate inventories
95
©2021 Cengage Learning. All Rights Reserved. May not be scanned, copied or duplicated, or posted to a publicly accessible website, in whole or in part.
Omni-Channel Customer Fulfillment Models
Pool Distribution
Source
Figure
4.12:
Robert
A.
Novack,
Ph.D.
Used
with
permission.
In pool distribution, small retailers use third party logistics companies, or pool distributors, for
store delivery, allowing them to achieve efficiency of a truckload shipment for the line haul and
the effectiveness of allowing stores to receive LTL orders on a regular schedule
96
©2021 Cengage Learning. All Rights Reserved. May not be scanned, copied or duplicated, or posted to a publicly accessible website, in whole or in part.
Omni-Channel Customer Fulfillment Models
Direct Store Delivery
Source
Figure
4.13:
Robert
A.
Novack,
Ph.D.
Used
with
permission.
Direct store delivery involves a manufacturer delivering its product directly to a retailer’s stores,
bypassing the retailer’s distribution network.
• Advantages: Reduction of inventory in the distribution network
• Disadvantages: Possible reduction of inventory visibility of the products to the retailers, Requirements
of close collaboration and agreement between the manufacturer and retailer
97
©2021 Cengage Learning. All Rights Reserved. May not be scanned, copied or duplicated, or posted to a publicly accessible website, in whole or in part.
Omni-Channel Customer Fulfillment Models
Store Fulfillment
Source
Figure
4.14:
Robert
A.
Novack,
Ph.D.
Used
with
permission.
In store fulfillment model, the order is placed through the Internet site. The order is sent to the nearest
retail store where it is picked and put aside for the customer to pick up or the store can arrange for delivery.
• Advantages: Short lead time to the customer, Low start-up costs for the retailer, Returns handled
through the retail store, Product available in consumer units
• Disadvantages: Reduced control and consistency over order fill, Conflicts between store and Internet
order inventories, Requirements of real-time visibility to in-store inventories, Requirements of stores’
space to store and stage products for pickups
98
©2021 Cengage Learning. All Rights Reserved. May not be scanned, copied or duplicated, or posted to a publicly accessible website, in whole or in part.
Summary
• The strategic importance of supply chain network design decision is growing with
the increasing globalization of manufacturing, marketing, sourcing, and
procurement.
• A formal, structured process for network design or redesign is preferable to an
informal, unstructured one.
• Numerous factors may affect the design of a logistics network and the location of
specific facilities within the context of the network.
• Principal modeling approaches to gain insight into the topic of supply chain
network design include optimization, simulation, and heuristic models.
• In an omni-channel environment, many network models exist that can
be used to service retail stores and Internet consumers, each of which
has its advantages and disadvantages. Trade-offs must be taken
into consideration when deciding which network model to use.
99
©2021 Cengage Learning. All Rights Reserved. May not be scanned, copied or duplicated, or posted to a publicly accessible website, in whole or in part.
Supply Chain
Management,
11e
Chapter 5: Sourcing Materials and
Services
©2021 Cengage Learning. All Rights Reserved. May not be scanned, copied or duplicated, or posted to a publicly accessible website, in whole or in part.
100
©2021 Cengage Learning. All Rights Reserved. May not be scanned, copied or duplicated, or posted to a publicly accessible website, in whole or in part.
Discussion Outline
• Strategic evolution of sourcing process (purchasing, procurement,
and strategic sourcing)
• Types of purchasing activity and quadrant technique
• Strategic sourcing process
• Total landed cost concept
• E-sourcing, e-procurement, and e-commerce
101
©2021 Cengage Learning. All Rights Reserved. May not be scanned, copied or duplicated, or posted to a publicly accessible website, in whole or in part.
Strategic Evolution of
Sourcing Process
(Purchasing, Procurement,
and Strategic Sourcing)
102
©2021 Cengage Learning. All Rights Reserved. May not be scanned, copied or duplicated, or posted to a publicly accessible website, in whole or in part.
Purchasing vs. Procurement vs.
Strategic Sourcing
Purchasing is an activity that follows conduct of a formal sourcing process,
while procurement and strategic sourcing are best described as processes.
Strategic Sourcing
• Managing procurement priorities such that they are well-aligned with goals and objectives of the supply
chain and of the overall organization.
Procurement
• Managing a broad range of activities within the procurement process (e.g. supplier selection, price
negotiation, contract management, supplier performance management).
Purchasing
• Managing a firm’s acquisition procedures and standards, involving largely transactional activity of the
buying of products & services.
103
©2021 Cengage Learning. All Rights Reserved. May not be scanned, copied or duplicated, or posted to a publicly accessible website, in whole or in part.
Unique Aspects of Strategic Sourcing
1. Consolidation/leveraging of purchasing power
2. Emphasis on value
3. More meaningful supplier relationships
4. Attention directed to process improvement
5. Enhanced teamwork and professionalism
6. Enhanced teamwork and professionalism
Source Figure 5.1: C. John Langley Jr., Ph.D., Penn State University, Used with permission.
104
©2021 Cengage Learning. All Rights Reserved. May not be scanned, copied or duplicated, or posted to a publicly accessible website, in whole or in part.
Strategic Evolution of Sourcing Process
Source
Figure
5.2:
C.
John
Langley
Jr.,
Ph.D.,
Penn
State
University,
Used
with
permission.
105
©2021 Cengage Learning. All Rights Reserved. May not be scanned, copied or duplicated, or posted to a publicly accessible website, in whole or in part.
Types of Purchasing
Activity and Quadrant
Technique
106
©2021 Cengage Learning. All Rights Reserved. May not be scanned, copied or duplicated, or posted to a publicly accessible website, in whole or in part.
Types and Importance of Purchases –
The Quadrant Technique
Not all items /services purchased are of equal importance, requiring varying
procurement strategies based on their value and risk.
Source
Figure
5.3:
C.
John
Langley
Jr.,
Ph.D.,
Penn
State
University,
Used
with
permission.
107
©2021 Cengage Learning. All Rights Reserved. May not be scanned, copied or duplicated, or posted to a publicly accessible website, in whole or in part.
Three Types of Purchasing Activity
Source
Figure
5.4:
C.
John
Langley
Jr.,
Ph.D.,
Penn
State
University,
Used
with
permission.
108
©2021 Cengage Learning. All Rights Reserved. May not be scanned, copied or duplicated, or posted to a publicly accessible website, in whole or in part.
Strategic Sourcing
109
©2021 Cengage Learning. All Rights Reserved. May not be scanned, copied or duplicated, or posted to a publicly accessible website, in whole or in part.
Strategic Sourcing
Five Core Principles
1. Assess total value. Emphasis beyond acquisition cost, evaluating total cost of ownership and the value
of the supplier relationship.
2. Develop individual sourcing strategies. Individual spend categories need customized sourcing
strategies.
3. Evaluate internal requirements. Requirements and specifications thoroughly assessed and rationalized
as part of the sourcing process.
4. Focus on supplier economics. Suppliers’ economics understood before identifying buying tactics (e.g.
volume leveraging, price unbundling, price adjustment mechanisms).
5. Drive continuous improvement. Strategic sourcing initiatives as subset of continuous improvement
process for procurement and sourcing organizations.
110
©2021 Cengage Learning. All Rights Reserved. May not be scanned, copied or duplicated, or posted to a publicly accessible website, in whole or in part.
Strategic Sourcing Process
Source
Figure
5.5:
C.
John
Langley
Jr.,
Ph.D.,
Penn
State
University,
Used
with
permission.
111
©2021 Cengage Learning. All Rights Reserved. May not be scanned, copied or duplicated, or posted to a publicly accessible website, in whole or in part.
Strategic Sourcing Process
Step 1: Develop Strategic Plan
• Create cross-functional planning committee
• Identify key members of sourcing team
• Agree on scope of sourcing processes
112
©2021 Cengage Learning. All Rights Reserved. May not be scanned, copied or duplicated, or posted to a publicly accessible website, in whole or in part.
Strategic Sourcing Process
Step 2: Understand Spend
• Refine understanding of sourcing needs of process-owners, with the nature of
the requirement being represented by some type of measurable criteria
• Perform spend analysis to:
− Understand spend by supplier, category, and internal user
− Profile current sourcing approaches and areas for improvement
• Address issues of make vs. buy
113
©2021 Cengage Learning. All Rights Reserved. May not be scanned, copied or duplicated, or posted to a publicly accessible website, in whole or in part.
Strategic Sourcing (1 of 2)
Steps 3–5: Supplier Portfolio Screening
Source
Figure
5.6:
C.
John
Langley
Jr.,
Ph.D.,
Penn
State
University,
Used
with
permission.
114
©2021 Cengage Learning. All Rights Reserved. May not be scanned, copied or duplicated, or posted to a publicly accessible website, in whole or in part.
Strategic Sourcing (2 of 2)
Steps 3–5: Supplier Portfolio Screening
Source
Figure
5.7:
C.
John
Langley
Jr.,
Ph.D.,
Penn
State
University,
Used
with
permission.
115
©2021 Cengage Learning. All Rights Reserved. May not be scanned, copied or duplicated, or posted to a publicly accessible website, in whole or in part.
Strategic Sourcing Process
Step 6: Onboarding and Transitioning
• Finalize understandings and agreements with suppliers
• Create management processes for new suppliers
• Conduct transition and onboarding processes
116
©2021 Cengage Learning. All Rights Reserved. May not be scanned, copied or duplicated, or posted to a publicly accessible website, in whole or in part.
Strategic Sourcing Process
Step 7: Collaborative Process Improvement
• Regular feedback and communications
• Analyze net savings and compare with goals and objectives
• Process improvement for both suppliers and customers
117
©2021 Cengage Learning. All Rights Reserved. May not be scanned, copied or duplicated, or posted to a publicly accessible website, in whole or in part.
Total Landed Cost
118
©2021 Cengage Learning. All Rights Reserved. May not be scanned, copied or duplicated, or posted to a publicly accessible website, in whole or in part.
Total Landed Cost (TLC)
Source
Figure
5.8:
C.
John
Langley
Jr.,
Ph.D.,
Penn
State
University,
Used
with
permission.
119
©2021 Cengage Learning. All Rights Reserved. May not be scanned, copied or duplicated, or posted to a publicly accessible website, in whole or in part.
TLC Example: Cost Comparisons of Alternative
Sourcing Options
Destination Country – Switzerland
Country
of Origin
Price Components – all prices in Euros China Vietnam EU
Net purchasing price for a specific volume of the product from
3 different suppliers
10,000 8,000 12,000
Total transportation cost to Switzerland (Ocean freight from
China/Vietnam – Road freight within Europe)
4,000 6,000 1,200
Customs according trade agreement 1,000 1,500 n.a.
VAT (Switzerland 7.6%) based on value of goods 1,140 1,178 1,003
Total Landed Cost 16,140 16,678 14,203
Source
Figure
5.9:
Source:
C.
John
Langley
Jr.,
Ph.D.,
Penn
State
University,
Used
with
permission.
120
©2021 Cengage Learning. All Rights Reserved. May not be scanned, copied or duplicated, or posted to a publicly accessible website, in whole or in part.
E-sourcing,
E-procurement, and E-
commerce
121
©2021 Cengage Learning. All Rights Reserved. May not be scanned, copied or duplicated, or posted to a publicly accessible website, in whole or in part.
E-sourcing and E-procurement Functionality
1. Industry analysis and supplier
identification
2. Analytical tools
3. Management of RFI/RFP processes
4. Process automation
5. Online negotiations
6. Collaboration tools
7. Logistics procurement
8. Project management
9. Knowledge management
10.Contract management
Source Figure 5.10: Source: C. John Langley Jr., Ph.D., Penn State University, Used with permission.
122
©2021 Cengage Learning. All Rights Reserved. May not be scanned, copied or duplicated, or posted to a publicly accessible website, in whole or in part.
Advantages and Concerns
of Electronic Procurement
Concerns
• Cyber-security
• Lack of face-to-face contact between the buyer and seller
• Technology-related concerns (lack of standard protocols, system reliability, time & money investment)
Advantages
• Lower operating costs (reduce paperwork & sourcing time, improve control over inventory & spending)
• Improve procurement and sourcing efficiency (find new supply sources, improve communications,
improve personnel use, lower cycle times)
• Reduce procurement prices
• Improve communications
• Easier access to more suppliers
Source Figure 5.11: Source: C. John Langley Jr., Ph.D., Penn State University, Used with permission.
123
©2021 Cengage Learning. All Rights Reserved. May not be scanned, copied or duplicated, or posted to a publicly accessible website, in whole or in part.
Four Basic Types
of E-commerce Business Models
• “Sell-side” vs. “buy-side” system: Whether e-Commerce capabilities are seller-centric or buyer-centric.
• B2B and B2C: Online businesses selling to businesses or consumers, respectively. These are both “sell-
side.” Examples include Delta Air Lines (www.delta.com), Barnes & Noble (www.barnesandnoble.com),
Amazon (www.amazon.com), and Office Depot (officedepot.com).
• Online marketplace: e-Commerce site where product or service information is provided by multiple third
parties, whereas transactions are processed by the marketplace operator. Examples include Amazon
(www.amazon.com), Expedia (www.expedia.com), and Uber (www.uber.com).
• Online trading community: A system maintained by a 3rd party technology supplier that provides buyers
and sellers with a structured method for trading, bartering, or selling goods and services. Examples
include eBay (www.ebay.com), Craigslist (www.craigslist.org), and NTE (www.nteinc.com).
124
©2021 Cengage Learning. All Rights Reserved. May not be scanned, copied or duplicated, or posted to a publicly accessible website, in whole or in part.
Summary
• Different procurement and sourcing strategies devised based on the risk and
value or profit potential from needed products/services that can be classified into:
generics, commodities, distinctives, and criticals.
• Strategic sourcing process includes: develop strategic plan, understand spend,
evaluate supply sources, finalize sourcing strategy, implement sourcing strategy,
transition and onboarding, and collaborative process improvement.
• The concept of total landed cost is a highly-valuable element of the overall
procurement process.
• Advantages of e-sourcing and e-procurement include lower operating
costs, improved efficiency, and reduced prices.
• Four popular e-commerce model types are: “sell-side” vs. “buy-side;”
B2B and B2C; online marketplace; and online trading community.
125
©2021 Cengage Learning. All Rights Reserved. May not be scanned, copied or duplicated, or posted to a publicly accessible website, in whole or in part.
Supply Chain
Management,
11e
Chapter 6: Producing Goods and
Services
©2021 Cengage Learning. All Rights Reserved. May not be scanned, copied or duplicated, or posted to a publicly accessible website, in whole or in part.
126
©2021 Cengage Learning. All Rights Reserved. May not be scanned, copied or duplicated, or posted to a publicly accessible website, in whole or in part.
Discussion Outline
• The role of production operations in supply chain management
• Operations strategy and planning
• Production execution decisions
• Production metrics
• Production technology
127
©2021 Cengage Learning. All Rights Reserved. May not be scanned, copied or duplicated, or posted to a publicly accessible website, in whole or in part.
Role of Production
Operations in SCM
128
©2021 Cengage Learning. All Rights Reserved. May not be scanned, copied or duplicated, or posted to a publicly accessible website, in whole or in part.
Role of Production Operations in SCM
Production Process Functionality
Source
Figure
6.1:
Brian
J.
Gibson,
Ph.D.
Used
with
permission.
129
©2021 Cengage Learning. All Rights Reserved. May not be scanned, copied or duplicated, or posted to a publicly accessible website, in whole or in part.
Production Tradeoffs
1. Volume vs. Variety
2. Responsiveness vs. Efficiency
3. Production costs vs. Supply chain costs
4. In-house (Make) vs. Outsource (Buy)
130
©2021 Cengage Learning. All Rights Reserved. May not be scanned, copied or duplicated, or posted to a publicly accessible website, in whole or in part.
Production Tradeoffs
Volume vs. Variety in Production Process Decisions
Economies of Scale
• Higher-volume production with lower
cost per unit of output
• Suitable in situations where
production processes have high fixed
costs and equipment.
Economies of Scope
• Low-volume production with flexible
capabilities of producing a wide
variety of products
• Important in markets characterized
by changing customer demand.
131
©2021 Cengage Learning. All Rights Reserved. May not be scanned, copied or duplicated, or posted to a publicly accessible website, in whole or in part.
Production Tradeoffs
Responsiveness vs. Efficiency in Production Facility Decisions
Centralized vs. Regional
• Centralized production facilities provide operating cost and inventory efficiencies.
• Regional production facilities allow companies to be closer to customers and more responsive.
Large vs. Small
• Larger facilities with excess capacity provide the flexibility to respond to demand spikes.
• Smaller facilities that are better utilized are more cost efficient.
Product-focused vs. Process-focused
• Product-focused facilities performing many processes on a single product type are more responsive.
• Process-focused facilities concentrating on a few functions across multiple product types are more efficient
at its limited scope of activities.
132
©2021 Cengage Learning. All Rights Reserved. May not be scanned, copied or duplicated, or posted to a publicly accessible website, in whole or in part.
Production Tradeoffs
Production Costs vs. Other Supply Chain Costs
Source
Figure
6.2:
Adapted
from
Bowersox,
Closs,
and
Cooper,
Supply
Chain
Logistics
Management,
4th
ed.
(Boston,
MA:
McGraw
Hill/Irwin,
2012).
Copyright
©
2012
by
McGraw-Hill.
Reproduced
by
permission
of
McGraw-Hill
Companies,
Inc.
133
©2021 Cengage Learning. All Rights Reserved. May not be scanned, copied or duplicated, or posted to a publicly accessible website, in whole or in part.
Production Tradeoffs
In-house (Make) vs. Outsource (Buy)
In-house (Make)
• Internal production processes are
more directly visible.
• Internal processes are easier to
control from a quality standpoint.
Outsource (Buy)
• Lower product costs
• Free-up resources for other, more
strategic needs
BUT
• More difficult to maintain visibility and
synchronize activities.
• More difficult to control over quality,
intellectual property rights, and
customer relationships.
134
©2021 Cengage Learning. All Rights Reserved. May not be scanned, copied or duplicated, or posted to a publicly accessible website, in whole or in part.
Operations Strategy and
Planning
135
©2021 Cengage Learning. All Rights Reserved. May not be scanned, copied or duplicated, or posted to a publicly accessible website, in whole or in part.
Operations Strategy and Planning
Evolution of Production Strategies
Source
Figure
6.3:
Adapted
from
Manufacturing
Strategy:
An
Adaptive
Perspective
(Newton
Square,
PA:
SAP
AG,
2003).
136
©2021 Cengage Learning. All Rights Reserved. May not be scanned, copied or duplicated, or posted to a publicly accessible website, in whole or in part.
Operations Strategy and Planning (1 of 2)
Production Strategy Challenges
Mass Production
• Limitation on producer’s responsive-ness
• Potential for the bullwhip effect
Lean Manufacturing
• Difficult to achieve economies of scale
• Require technological capabilities to achieve the supply chain visibility and
synchronization
• Increased risk of disruption
137
©2021 Cengage Learning. All Rights Reserved. May not be scanned, copied or duplicated, or posted to a publicly accessible website, in whole or in part.
Operations Strategy and Planning (2 of 2)
Production Strategy Challenges
Flexible Manufacturing
• High capital investment
• System complexity
• Require skilled technician
• Require disciplined & high level of planning
Adaptive Manufacturing
• Require seamless transfer of knowledge and real-time information
Smart Manufacturing
• Require capabilities of a network with messaging standards
• Require analytical toolkit
• Require flexible automation
138
©2021 Cengage Learning. All Rights Reserved. May not be scanned, copied or duplicated, or posted to a publicly accessible website, in whole or in part.
Operations Strategy and Planning
Production Planning
Source
Figure
6.4:
Adapted
from
Wisner,
Tan,
and
Leong,
Principles
of
Supply
Chain
Management:
A
Balanced
Approach,
5th
ed.
(Boston,
MA:
Cengage
Learning,
2019).
Reproduced
by
permission.
139
©2021 Cengage Learning. All Rights Reserved. May not be scanned, copied or duplicated, or posted to a publicly accessible website, in whole or in part.
Production Execution
Decisions
Assembly Processes
Production Process Layout
Packaging
140
©2021 Cengage Learning. All Rights Reserved. May not be scanned, copied or duplicated, or posted to a publicly accessible website, in whole or in part.
Production Execution Decisions
Assembly Processes
Assembly Processes
• Make-to-Stock (MTS)
• Make-to-Order (MTO)
− Assemble-to-Order (ATO)
− Build-to-Order (BTO)
− Engineer-to-Order (ETO)
141
©2021 Cengage Learning. All Rights Reserved. May not be scanned, copied or duplicated, or posted to a publicly accessible website, in whole or in part.
Production Execution Decisions
Comparison of Make-to-Order (MTO) Options
ATO BTO ETO
Level of customization Limited Moderate Total
Cost of finished goods Moderate High Very high
Order fulfillment speed Days to weeks Weeks to months Month to years
Production process
complexity
Moderate High Extreme
Example products
Personal computers
Automobiles
Computer servers
Private jets
Stadium JumboTron
Nuclear power plant
Source
Table
6.2:
Brian
J.
Gibson,
Ph.D.
Used
with
permission.
142
©2021 Cengage Learning. All Rights Reserved. May not be scanned, copied or duplicated, or posted to a publicly accessible website, in whole or in part.
Production Execution Decisions (1 of 2)
Production Process Layout
Production process layout involves the arrangement of machines, storage areas, and other
resources within the four walls of a manufacturing or an assembly facility. The layout is
influenced by a number of factors.
• The production strategy and assembly process employed
• Product characteristics (weight, fragility, size)
• Demand characteristics (volume & variability)
• Service commitments
• Production mixes
• Facility costs
143
©2021 Cengage Learning. All Rights Reserved. May not be scanned, copied or duplicated, or posted to a publicly accessible website, in whole or in part.
Production Execution Decisions (2 of 2)
Production Process Layout
Production process layouts generally fit into a spectrum of work flow that moves from
projects to continuous processes.
Source
Figure
6.5:
Adapted
from
Jacobs
and
Chase,
Operation
and
Supply
Chain
Management
15th
ed.
(Boston,
MA:
McGraw-
Hill
Irwin,
2018).
Reprinted
with
permission
of
McGraw-Hill
Companies,
Inc.
144
©2021 Cengage Learning. All Rights Reserved. May not be scanned, copied or duplicated, or posted to a publicly accessible website, in whole or in part.
Production Execution Decisions
Packaging
Well-designed packaging can: (1) Facilitate efficient handling and shipping of the finished
goods; (2) Improve labor and facility efficiency (space & equipment utilization); and (3)
Provide another level of product differentiation sought by the customer.
Key Considerations:
• Ease of handling (materials handling & transportation)
• Protection of goods in the package
• Compatibility with customers’ materials-handling equipment
• Information provision to production & logistics personnel
• Sustainability
145
©2021 Cengage Learning. All Rights Reserved. May not be scanned, copied or duplicated, or posted to a publicly accessible website, in whole or in part.
Production Metrics
146
©2021 Cengage Learning. All Rights Reserved. May not be scanned, copied or duplicated, or posted to a publicly accessible website, in whole or in part.
Establishing Production Metrics
Pursue Goals
• Align metrics with corporate
objectives
• Limit the number of metrics used to 5
or 6 per function
• Measure performance of individual
activities
Avoid Mistakes
• Using KPIs that are too narrow.
• Encouraging wrong outcomes.
• Focusing on issues that are not key
priorities.
147
©2021 Cengage Learning. All Rights Reserved. May not be scanned, copied or duplicated, or posted to a publicly accessible website, in whole or in part.
Key Groups of Production Metrics
1. Customer experience and responsiveness
2. Quality
3. Efficiency
4. Inventory
5. Compliance
6. Maintenance
7. Flexibility and innovation
8. Cost and profitability
148
©2021 Cengage Learning. All Rights Reserved. May not be scanned, copied or duplicated, or posted to a publicly accessible website, in whole or in part.
Production Technology
149
©2021 Cengage Learning. All Rights Reserved. May not be scanned, copied or duplicated, or posted to a publicly accessible website, in whole or in part.
Manufacturing Execution System
Technology that connects, monitors, and controls complex
manufacturing systems and data flows on the factory floor.
Core Functionality:
• Data collection & acquisition
• Scheduling
• Staff controls
• Resource management
• Production tracking & dispatch
• Product traceability & genealogy
• Quality management
• Process management
• Performance analysis
• Document management
• Maintenance management
150
©2021 Cengage Learning. All Rights Reserved. May not be scanned, copied or duplicated, or posted to a publicly accessible website, in whole or in part.
Manufacturing Execution System Benefits
Initial 3-12 months
• Efficiency gains
• Cost reductions
• Quality
improvements
Next 12-36 months
• Process
improvements
• Cycle time & work
flow compression
• Inventory carrying
cost reductions
36 months +
• New product
development
acceleration
• Indirect labor cost
reduction
• Agility & asset
utilization
improvements
151
©2021 Cengage Learning. All Rights Reserved. May not be scanned, copied or duplicated, or posted to a publicly accessible website, in whole or in part.
Summary
• Process functionality can create a competitive advantage such as: low cost, high quality, fast
delivery speed, high delivery reliability, ability to cope with demand change, and the flexibility to
offer variety.
• Production strategies have advanced from forecast-driven mass production to demand-driven,
lean, flexible, adaptive, and smart manufacturing approaches.
• Most manufacturers use a combination of make-to-stock and make-to-order (including assemble-
to-order, build-to-order, and engineer-to-order) production methods to satisfy demand for their
products.
• Tradeoffs made regarding production are: volume vs. variety, responsiveness vs. efficiency, in-
house vs. outsource, and production costs vs. other supply chain costs and services.
• Critical production KPIs address total cost, total cycle time, delivery performance,
quality, and safety.
152
©2021 Cengage Learning. All Rights Reserved. May not be scanned, copied or duplicated, or posted to a publicly accessible website, in whole or in part.
Supply Chain
Management,
11e
Chapter 7: Demand Management
©2021 Cengage Learning. All Rights Reserved. May not be scanned, copied or duplicated, or posted to a publicly accessible website, in whole or in part.
153
©2021 Cengage Learning. All Rights Reserved. May not be scanned, copied or duplicated, or posted to a publicly accessible website, in whole or in part.
Discussion Outline
• Essence and importance of demand management
• Balancing supply and demand
• Demand forecasting
• Sales and Operations Planning (S&OP)
• Collaborative Planning, Forecasting, and Replenishment (CPFR)
154
©2021 Cengage Learning. All Rights Reserved. May not be scanned, copied or duplicated, or posted to a publicly accessible website, in whole or in part.
Demand Management
The Essence of Demand Management
• To estimate and manage customer demand and use this information to make
operating decisions.
• To further ability of firms throughout the supply chain to collaborate on activities
related to the flow of products, services, information, and capital.
Desired end result: Greater value for the end user or consumer
155
©2021 Cengage Learning. All Rights Reserved. May not be scanned, copied or duplicated, or posted to a publicly accessible website, in whole or in part.
Demand Management (1 of 4)
Importance of Demand Management
Common Problems in Demand Management
• Lack of coordination between departments
• Too much emphasis placed on forecasts of demand, with less attention on the
collaborative efforts and plans needed to be developed from the forecasts
• Non-strategic uses of demand information
156
©2021 Cengage Learning. All Rights Reserved. May not be scanned, copied or duplicated, or posted to a publicly accessible website, in whole or in part.
Demand Management (2 of 4)
Importance of Demand Management
Effective demand management unifies channel members with the common goals of
satisfying customers and solving customer problems.
1. Gather & analyze knowledge about consumers, their problems, and their unmet needs.
2. Identify partners to perform functions needed in demand chain.
3. Move functions to the channel member that can perform them most effectively and efficiently.
4. Share with other supply chain members knowledge about customers, technology, and logistics
challenges and opportunities.
5. Developing products and services that solve customers’ problems.
6. Develop & execute best methods to deliver products & services to consumers in the desired format.
157
©2021 Cengage Learning. All Rights Reserved. May not be scanned, copied or duplicated, or posted to a publicly accessible website, in whole or in part.
Demand Management (3 of 4)
Importance of Demand Management
Effective demand management supports business strategy.
STRATEGY EXAMPLES OF HOW TO USE DEMAND MANAGEMENT
Growth strategy • Perform “what if” analyses on total industry volume to gauge how specific mergers
and acquisitions might leverage market share.
• Analyze industry supply/demand to predict changes in product pricing structure
and market economics based on mergers and acquisitions.
• Build staffing models for merged company using demand data.
Portfolio strategy • Manage maturity of products in current portfolio to optimally time overlapping life
cycles.
• Create new product development/introduction plans based on life cycle.
• Balance combination of demand and risk for consistent “cash cows” with demand
for new products.
• Ensure diversification of product portfolio through demand forecasts.
Source
Table
7.1:
Jim
R.
Langabeer
II,
“Aligning
Demand
Management
with
Human
Strategy,”
Supply
Chain
Management
Review
(May/June
2000):
58.
Copyright
©
2000
Reed
Business
Information,
a
division
of
Reed
Elsevier.
Reproduced
by
permission.
158
©2021 Cengage Learning. All Rights Reserved. May not be scanned, copied or duplicated, or posted to a publicly accessible website, in whole or in part.
Demand Management (4 of 4)
Importance of Demand Management
Effective demand management supports business strategy.
STRATEGY EXAMPLES OF HOW TO USE DEMAND MANAGEMENT
Positioning
strategy
• Manage product sales through each channel based on demand and product
economics.
• Manage positioning of finished goods at appropriate distribution centers, to reduce
working capital, based on demand.
• Define capability to supply for each channel.
Investment
strategy
• Manage capital investments, marketing expenditures, and research and
development budgets based on demand forecasts of potential products and
maturity of current products.
• Determine whether to add manufacturing capacity.
Source
Table
7.1:
Jim
R.
Langabeer
II,
“Aligning
Demand
Management
with
Human
Strategy,”
Supply
Chain
Management
Review
(May/June
2000):
58.
Copyright
©
2000
Reed
Business
Information,
a
division
of
Reed
Elsevier.
Reproduced
by
permission.
159
©2021 Cengage Learning. All Rights Reserved. May not be scanned, copied or duplicated, or posted to a publicly accessible website, in whole or in part.
Balancing Supply and
Demand
160
©2021 Cengage Learning. All Rights Reserved. May not be scanned, copied or duplicated, or posted to a publicly accessible website, in whole or in part.
Balancing Supply and Demand
Problem of Supply-Demand Misalignment
Source
Figure
7.1:
Accenture,
Stanford
University,
and
Northwestern
University,
Customer-Driven
Demand
Networks:
Unlocking
Hidden
Value
in
the
Personal
Computer
Supply
Chain
(Accenture,
1997):
15.
161
©2021 Cengage Learning. All Rights Reserved. May not be scanned, copied or duplicated, or posted to a publicly accessible website, in whole or in part.
Balancing Supply and Demand
Supply-Demand Balancing Methods
Some combinations of supply-demand balancing methods are used,
depending on the nature of the product, the cost of stocking out, and the
organization’s ability to properly forecast customer demand.
External Balancing Methods
Change the manner in which
the customer orders:
• Price
• Lead time
Internal Balancing Methods
Manage gap using internal
processes:
• Inventory
• Production flexibility
162
©2021 Cengage Learning. All Rights Reserved. May not be scanned, copied or duplicated, or posted to a publicly accessible website, in whole or in part.
Demand Forecasting
Types of Forecast Error Measures
Common Forecasting Techniques
163
©2021 Cengage Learning. All Rights Reserved. May not be scanned, copied or duplicated, or posted to a publicly accessible website, in whole or in part.
Demand Forecasting
Demand forecasting is a major component of demand management.
Forecasts serve as a plan for both marketing and operations to set goals
and develop execution strategies.
Two Types of Demand: Most forecasting techniques focus on independent
demand.
1. Independent Demand
− The demand for the primary item, known as base demand
2. Dependent Demand
− The demand directly influenced by demand for independent item
164
©2021 Cengage Learning. All Rights Reserved. May not be scanned, copied or duplicated, or posted to a publicly accessible website, in whole or in part.
Demand Forecasting
Factors Affecting Demand
All demand is subject to certain fluctuations.
Random fluctuation
• A development that cannot be anticipated and is usually the cause to hold
safety stocks to avoid stockouts.
Trend fluctuation
• Gradual increase or decrease in demand over time for an organization.
Seasonal fluctuation
• Seasonal patterns that will normally repeat themselves during a year for most
organizations.
165
©2021 Cengage Learning. All Rights Reserved. May not be scanned, copied or duplicated, or posted to a publicly accessible website, in whole or in part.
Demand Forecasting (1 of 2)
Types of Forecast Error Measures
CFE
• Cumulative sum of forecast errors (CFE) calculates the total forecast error for a set of data, taking into
consideration both negative and positive errors.
CFE =
𝑛
𝑡−1
𝑒𝑡
MSE
• Mean squared error (MSE) squares each period error so the negative and positive errors do not cancel
each other out.
MSE =
𝐸𝑡
2
𝑛
166
©2021 Cengage Learning. All Rights Reserved. May not be scanned, copied or duplicated, or posted to a publicly accessible website, in whole or in part.
Demand Forecasting (2 of 2)
Types of Forecast Error Measures
MAD
• Mean absolute deviation (MAD) takes absolute value of each error, so the negative and positive signs are
removed.
MAD =
| 𝐸𝑡|
𝑛
MAPE
MAPE =
( |𝐸𝑡 | 𝐷𝑡)100
𝑛
TRACK Signal
• Tracking signal can be used to measure forecast error, especially good at identifying if a “bias” exists in the
forecast errors.
CFE/MAD
167
©2021 Cengage Learning. All Rights Reserved. May not be scanned, copied or duplicated, or posted to a publicly accessible website, in whole or in part.
Demand Forecasting (1 of 2)
Common Forecasting Techniques
All statistical techniques used to generate forecasts require accurate data and rely on the assumption
that the future will repeat the past. The key to good forecasting is to minimize forecast error by utilizing
a forecasting technique that best fits the nature of the data. Three common forecasting techniques are:
Simple moving average
• Makes forecasts based on
recent demand history and
allows for the removal of
random effects.
• Pros: quick and easy to
use
• Cons: old demand
dropped quickly; not
accommodate seasonal,
trend, or business cycle
influences
Weighted moving average
• Assigns a weight to each
previous period with higher
weights usually given to
more recent demand.
• Pros: allows emphasis on
more recent demand as a
predictor of future demand.
• Cons: not easily
accommodate seasonal
demand patterns
Exponential smoothing
• Pros: simplicity and limited
requirements for data,
good for relatively constant
demand
• Cons: forecasts will lag
actual demand; Not
appropriate for highly
seasonal demand patterns
or patterns with trends
168
©2021 Cengage Learning. All Rights Reserved. May not be scanned, copied or duplicated, or posted to a publicly accessible website, in whole or in part.
Demand Forecasting (2 of 2)
Common Forecasting Techniques
Forecast Accuracy Summary
(1)
BIAS (CFE)
(2)
MAD
(3)
MSE
(4)
MAPE
(5)
TRACKING
SIGNAL
Simple moving average + 3,087 731.08 862,696.75 7.43 4.2
Weighted moving average + 1,274 886.2 1,169,415.5 9.03 1.44
Experimental Smoothing - 5,554 520.67 403,033.5 5.52 - 10.67
Source Table 7.6: Robert A. Novack, Ph.D. Used with permission.
169
©2021 Cengage Learning. All Rights Reserved. May not be scanned, copied or duplicated, or posted to a publicly accessible website, in whole or in part.
Sales and Operations
Planning (S&OP)
170
©2021 Cengage Learning. All Rights Reserved. May not be scanned, copied or duplicated, or posted to a publicly accessible website, in whole or in part.
Sales and Operations Planning (S&OP)
Arriving at Internal Consensus Forecast
It is necessary for an organization to arrive at a forecast internally that all
functional areas agree upon and can execute. A process that can be used to
arrive at this consensus forecast is called sales and operations planning (S&OP).
Preliminary demand forecast
Marketing forecast
Financial forecast
Distribution forecast
Manufacturing forecast
S&OP
Internal
Consensus
Forecast
171
©2021 Cengage Learning. All Rights Reserved. May not be scanned, copied or duplicated, or posted to a publicly accessible website, in whole or in part.
Sales and Operations Planning (S&OP)
A Five-Step Process
Source
Figure
7.2:
Thomas
F.
Wallace,
Sales
and
Operations
Planning:
The
How-To
Book,
(Cincinnati,
OH:
T.
F.
Wallace
and
Company,
2000):
43.
Copyright
©
2000
by
Thomas
F.
Wallace.
Reproduced
by
permission.
172
©2021 Cengage Learning. All Rights Reserved. May not be scanned, copied or duplicated, or posted to a publicly accessible website, in whole or in part.
Collaborative Planning,
Forecasting, and
Replenishment (CPFR)
173
©2021 Cengage Learning. All Rights Reserved. May not be scanned, copied or duplicated, or posted to a publicly accessible website, in whole or in part.
Collaborative Planning, Forecasting, and
Replenishment (CPFR)
Arriving at Inter-Organizational Consensus Forecast
Trading partners (retailers,
distributors, and
manufacturers) use
available Internet-based
technologies to collaborate
on operational planning,
allowing them to agree to a
single forecast for an item
where each partner
translates this forecast into
a single execution plan.
Source Figure 7.3: Larry Smith, “West Marine: A CPFR Success Story,” Supply Chain Management Review (March
2006): 31. Copyright © 2006 Reed Business Information, a division of Reed Elsevier. Reproduced by permission.
174
©2021 Cengage Learning. All Rights Reserved. May not be scanned, copied or duplicated, or posted to a publicly accessible website, in whole or in part.
Summary
• Demand management involves “focused efforts to estimate and manage customers’
demand, with the intention of using this information to shape operating decisions.”
• Three common techniques for demand forecast are simple moving average, weighted
moving average, and exponential smoothing. Using a forecasting technique that best fits
the nature of the data is key to minimize forecast error.
• Many forecasts are made across internal functions and throughout the supply chain.
− The S&OP process involves participation from sales, operations, and finance to
arrive at an internal consensus forecast.
− CPFR is a method to allow trading partners in the supply chain to
collaboratively develop and agree upon a forecast of sales to enable
integrated operational planning and execution.
175
©2021 Cengage Learning. All Rights Reserved. May not be scanned, copied or duplicated, or posted to a publicly accessible website, in whole or in part.
Supply Chain
Management,
11e
Chapter 8: Order Management and
Customer Service
©2021 Cengage Learning. All Rights Reserved. May not be scanned, copied or duplicated, or posted to a publicly accessible website, in whole or in part.
176
©2021 Cengage Learning. All Rights Reserved. May not be scanned, copied or duplicated, or posted to a publicly accessible website, in whole or in part.
Discussion Outline
• Order management and customer service: Concept and
relationships
• Order management
• Customer Service
• Order management influences on customer service
• Service recovery
177
©2021 Cengage Learning. All Rights Reserved. May not be scanned, copied or duplicated, or posted to a publicly accessible website, in whole or in part.
Order Management Concept
Two Phases of Order Management
Phase 1: Influence and Order
• Organization attempts to change the manner by which its customers place
orders.
Phase 2: Execute the Order
• Order receipt
− Electronically vs. manually
• Order fulfillment
− Inventory policy; number & location of warehouses
• Order shipments
− Transport mode choice
178
©2021 Cengage Learning. All Rights Reserved. May not be scanned, copied or duplicated, or posted to a publicly accessible website, in whole or in part.
Customer Service Concept
Customer service is anything that touches the customer, including all activities
that impact information flow, product flow, and cash flow between the organization
and its customers.
• Customer service as a philosophy
− Elevates customer service as an organization-wide commitment.
• Customer service as performance measures
− Emphasizes customer service as specific performance measures.
• Customer service as an activity
− Treats customer service as a particular task that an organization must
perform.
179
©2021 Cengage Learning. All Rights Reserved. May not be scanned, copied or duplicated, or posted to a publicly accessible website, in whole or in part.
Relationship between Order Management and
Customer Service
Source
Figure
8.1:
Robert
A.
Novack,
Ph.D.
Used
with
permission.
180
©2021 Cengage Learning. All Rights Reserved. May not be scanned, copied or duplicated, or posted to a publicly accessible website, in whole or in part.
Order Management
Influencing the Order: Customer Relationship Management (CRM)
Executing the Order: Order Management & Order Fulfillment
181
©2021 Cengage Learning. All Rights Reserved. May not be scanned, copied or duplicated, or posted to a publicly accessible website, in whole or in part.
Order Management: Influencing Order (1 of 5)
Customer Relationship Management
The concept behind customer relationship management (CRM) is simple: Align
the supplier’s resources with its customers in a manner that increases both
customer satisfaction and supplier profits.
How? How much? What? When?
CRM
Maximize the efficiencies of the shipping organization’s logistics network
182
©2021 Cengage Learning. All Rights Reserved. May not be scanned, copied or duplicated, or posted to a publicly accessible website, in whole or in part.
Order Management: Influencing Order (2 of 5)
Customer Relationship Management
Four basic steps in the implementation of the CRM process
Step 1: Segment the Customer Base by Profitability
• Use techniques such as activity-based costing and cost-to-serve (CTS) model
Step 2: Identify the Product/Service Package for Each Customer Segment
• Determine what each customer segment values in its relationship with the supplier based on
feedback from customers and sales representatives
Step 3: Develop and Execute the Best Processes
• Deliver on customer expectations determined and set in Step 2
Step 4: Measure Performance and Continuously Improve
• Determining if (1) the different customer segments are satisfied and (2) the supplier’s overall
profitability has improved.
183
©2021 Cengage Learning. All Rights Reserved. May not be scanned, copied or duplicated, or posted to a publicly accessible website, in whole or in part.
Order Management: Influencing Order (3 of 5)
Customer Relationship Management
Product/Service Package Examples: Option 1 (most commonly used)
Offer the same product/service offering to each customer segment, while varying the product quality or
service levels. Pro: Easy for the supplier to manage. Con: Assumes that all customer segments value the
same types of supplier offerings.
PRODUCT/SERVICE
OFFERING
CUSTOMER
SEGMENT A
CUSTOMER
SEGMENT B
CUSTOMER
SEGMENT C
Product quality (%
defects)
Less than 1% 5%–10% 10%–15%
Order fill 98% 92% 88%
Lead time 3 days 7 days 14 days
Delivery time Within 1 hour of request On day requested During week requested
Payment terms 4/10 net 30 3/10 net 30 2/10 net 30
Customer service support Dedicated rep Next available rep Through Web site
Source
Table
8.1:
Robert
A.
Novack,
Ph.D.
Used
with
permission.
184
©2021 Cengage Learning. All Rights Reserved. May not be scanned, copied or duplicated, or posted to a publicly accessible website, in whole or in part.
Order Management: Influencing Order (4 of 5)
Customer Relationship Management
Product/Service Package Examples: Option 2
Vary the service offerings for each customer segment. Pro: Meet the needs of each segment.
Con: Difficult for the supplier to manage.
CUSTOMER SEGMENT A
Product quality (% defects) Less than 1%
Order fill 98%
Lead time 3 days
Delivery time Within 1 hour of request
Payment terms 4/10 net 30
Customer service support Dedicated rep
Source Table 8.2: Robert A. Novack, Ph.D. Used with permission.
185
©2021 Cengage Learning. All Rights Reserved. May not be scanned, copied or duplicated, or posted to a publicly accessible website, in whole or in part.
Order Management: Influencing Order (5 of 5)
Customer Relationship Management
Product/Service Package Examples: Option 2
Vary the service offerings for each customer segment. Pro: Meet the needs of each segment.
Con: Difficult for the supplier to manage.
CUSTOMER SEGMENT B
Product quality (% defects) 5%–10%
Credit hold Less than 48 hours
Return policy Up to 10 days after delivery
CUSTOMER SEGMENT C
Order fill 88%
Ordering process Through Web site
Source Table 8.2: Robert A. Novack, Ph.D. Used with permission.
186
©2021 Cengage Learning. All Rights Reserved. May not be scanned, copied or duplicated, or posted to a publicly accessible website, in whole or in part.
Order Management: Influencing Order
Activity-Based Costing and Customer Profitability
Combining Activity-Based Costing (ABC), customer profitability, and customer segmentation tools to build
profitable revenue is a strategy being utilized by an increasing number of organizations today.
Source
Figure
8.2:
Robert
A.
Novack,
Ph.D.
Used
with
permission.
187
©2021 Cengage Learning. All Rights Reserved. May not be scanned, copied or duplicated, or posted to a publicly accessible website, in whole or in part.
Order Management: Influencing Order
ABC and Customer Profitability
ABC Example: Flow-Through Costing for a Distribution Center
Source
Figure
8.4:
Robert
A.
Novack,
Ph.D.
Used
with
permission.
188
©2021 Cengage Learning. All Rights Reserved. May not be scanned, copied or duplicated, or posted to a publicly accessible website, in whole or in part.
Order Management: Influencing Order
Customer Profitability Analysis
Traditional Customer
Profitability Analyses
• Start with gross sales less returns and
allowances (net sales) and subtract the
cost of goods sold to arrive at a gross
margin figure.
• Provides a general guideline for the
profitability of a customer, but falls
short on capturing the real costs of
serving a customer.
Cost-to-Serve Model
• Identifies many other cost drivers that
are impacted by customers and how
they interact with the shipper.
189
©2021 Cengage Learning. All Rights Reserved. May not be scanned, copied or duplicated, or posted to a publicly accessible website, in whole or in part.
Order Management: Influencing Order
Customer Segmentation
Source
Figure
8.5:
Robert
A.
Novack,
Ph.D.
Used
with
permission.
• Danger zone segment strategies are: (1)
Change the manner in which the customer
interacts with the shipper to move the
customer to another segment; (2) Charge
the customer the actual cost of doing; or (3)
Switch the customer to an alternative
distribution channel.
• Build segment strategies aim to maintain
the cost to serve but build net sales value to
help drive the customer into the “Protect”
segment.
• Cost engineer segment strategies aim to
find more efficient ways for the customer to
interact with the shipper.
190
©2021 Cengage Learning. All Rights Reserved. May not be scanned, copied or duplicated, or posted to a publicly accessible website, in whole or in part.
Order Management: Executing Order
Order-to-Cash (OTC) vs. Replenishment Cycles
OTC: Refer to outbound-to-
customer shipments. The order
to cash (or order cycle) is all of
the activities that occur from
when an order is received by a
seller until the product is
received by the buyer, plus the
flow of funds back to the seller
based on the invoice.
Replenishment Cycle: The
term replenishment cycle is
used more frequently when
referring to the acquisition of
additional inventory as in
materials management.
Basically, one organization’s order cycle is another’s replenishment cycle.
191
©2021 Cengage Learning. All Rights Reserved. May not be scanned, copied or duplicated, or posted to a publicly accessible website, in whole or in part.
Order Management: Executing Order
Order-to-Cash (OTC) Cycle
Illustration
modified
from
image
courtesy
of
CSCMP”s
Supply
Chain
Quarterly
Process D1: The Order to Cash (Process in a Deliver from Stock Environment)
192
©2021 Cengage Learning. All Rights Reserved. May not be scanned, copied or duplicated, or posted to a publicly accessible website, in whole or in part.
Order Management: Executing Order
Length and Variability of the OTC Cycle
Source
Figure
8.7:
Adapted
from
Douglas
M.
Lambert
and
James
R.
Stock,
“Using
Advanced
Order-Processing
Systems
to
Improve
Profitability,”
Business
(April–June
1982):
26.
Copyright
©
1982
by
Douglas
Lambert.
Reproduced
by
permission.
193
©2021 Cengage Learning. All Rights Reserved. May not be scanned, copied or duplicated, or posted to a publicly accessible website, in whole or in part.
Customer Service
194
©2021 Cengage Learning. All Rights Reserved. May not be scanned, copied or duplicated, or posted to a publicly accessible website, in whole or in part.
Customer Service
The Logistics/Marketing Interface
Source
Figure
8.8:
Adapted
from
Douglas
M.
Lambert,
The
Development
of
an
Inventory
Costing
Methodology:
A
Study
of
the
Costs
Associated
with
Holding
Inventory
(Chicago:
National
Council
of
Physical
Distribution
Management,
1976):
7.
Reproduced
with
permission
of
Council
of
Supply
Chain
Management
Professionals.
• Marketing Objective:
Allocate resources to the
marketing mix to maximize
long-term profitability of the
firm.
• Logistics Objective:
Minimize total costs, given
customer service objective,
where:
Total costs = Transportation
costs + Warehousing costs +
Order processing &
Information costs + Lot
quantity costs + Inventory
carrying costs
195
©2021 Cengage Learning. All Rights Reserved. May not be scanned, copied or duplicated, or posted to a publicly accessible website, in whole or in part.
Customer Service
Customer Service and ROI
Source
Figure
8.9:
Robert
A.
Novack,
Ph.D.
Used
with
permission.
196
©2021 Cengage Learning. All Rights Reserved. May not be scanned, copied or duplicated, or posted to a publicly accessible website, in whole or in part.
Customer Service (1 of 2)
Elements of Customer Service
From the perspective of logistics, customer service can be viewed as having
four distinct dimensions.
1. Time (absolute length of lead time)
2. Dependability (consistent lead time, safe delivery, correct orders)
3. Communications (pretransaction, transaction, & posttransaction)
4. Convenience (flexible logistics service level)
197
©2021 Cengage Learning. All Rights Reserved. May not be scanned, copied or duplicated, or posted to a publicly accessible website, in whole or in part.
Customer Service (2 of 2)
Elements of Customer Service
Lead Time Frequency Distribution Example
Source
Figure
8.10:
Robert
A.
Novack,
Ph.D.
Used
with
permission.
198
©2021 Cengage Learning. All Rights Reserved. May not be scanned, copied or duplicated, or posted to a publicly accessible website, in whole or in part.
Customer Service
Performance Measures: SCOR Metrics Level 1
Supply Chain Responsiveness
• Order fulfillment cycle time
Supply Chain Agility
• Upside SC flexibility
• Upside SC adaptability
• Downside SC adaptability
Supply Chain Costs
• SC management costs
• COGS
Supply Chain Asset Management
• Cash to cash cycle time
• Return on SC fixed assets
Supply Chain Reliability
• Perfect order
199
©2021 Cengage Learning. All Rights Reserved. May not be scanned, copied or duplicated, or posted to a publicly accessible website, in whole or in part.
Customer Service
Stockout Issues
A stockout occurs when desired quantities of finished goods
are not available when or where a customer needs them.
As a result, one of four possible events might occur.
1. The buyer waits until the product is available.
2. The buyer back-orders the product.
3. The seller loses current revenue.
4. The seller loses a buyer and future revenue.
200
©2021 Cengage Learning. All Rights Reserved. May not be scanned, copied or duplicated, or posted to a publicly accessible website, in whole or in part.
Order Management
Influences on Customer
Service
201
©2021 Cengage Learning. All Rights Reserved. May not be scanned, copied or duplicated, or posted to a publicly accessible website, in whole or in part.
Order Management Influences on Customer Service
Linking Order Management Outputs
Each of the five major outputs of order management impacts customer service/satisfaction, and the
performance of each is determined by the seller’s order management and logistics systems.
Source
Figure
8.12:
Robert
A.
Novack,
Ph.D.
Used
with
permission.
202
©2021 Cengage Learning. All Rights Reserved. May not be scanned, copied or duplicated, or posted to a publicly accessible website, in whole or in part.
Order Management Influences on Customer Service
Product Availability Metrics
• Internal Metrics
− Item fill rate
− Line fill rate
• External Metrics
− Order fill rate
− Perfect order
Source Figure 8.13: Robert A. Novack, Ph.D. Used with permission.
203
©2021 Cengage Learning. All Rights Reserved. May not be scanned, copied or duplicated, or posted to a publicly accessible website, in whole or in part.
Order Management Influences on Customer Service
Product Availability Financial Impacts
Financial Impact of Order Fill Rate
Improvement in order fill results in improvement in cash flow, but might require some type of investment in
inventories and/or technology.
Source
Figure
8.14:
Robert
A.
Novack,
Ph.D.
Used
with
permission.
204
©2021 Cengage Learning. All Rights Reserved. May not be scanned, copied or duplicated, or posted to a publicly accessible website, in whole or in part.
Order Management Influences on Customer
Service
Order Cycle Time Metric: Customer Wait Time
Source Figure 8.15: Robert A. Novack, Ph.D. Used with permission.
Often overlooked
definition of order cycle
time is customer wait
time (CWT). CWT
includes not only order
cycle time but also
maintenance time.
205
©2021 Cengage Learning. All Rights Reserved. May not be scanned, copied or duplicated, or posted to a publicly accessible website, in whole or in part.
Order Management Influences on Customer Service
Logistics Operations Responsiveness
The concept of logistics operations responsiveness (LOR) examines how well
a seller can respond to a buyer’s needs. This “response” can take two forms:
• How well a seller can customize its service offerings to the unique requirements
of a buyer
• How quickly a seller can respond to a sudden change in a buyer’s demand
pattern.
206
©2021 Cengage Learning. All Rights Reserved. May not be scanned, copied or duplicated, or posted to a publicly accessible website, in whole or in part.
Order Management Influences on Customer Service
Logistics Operations Responsiveness Metrics
Metrics for LOR
Flexibility/Adaptability of Process
• Delivery Agility Metrics
− Upside deliver adaptability
− Downside deliver adaptability
− Upside deliver flexibility
Customization of Product/Service
• Customization Metrics
− The time it takes the seller to offer a new package for sale in the retailers’ stores.
207
©2021 Cengage Learning. All Rights Reserved. May not be scanned, copied or duplicated, or posted to a publicly accessible website, in whole or in part.
Order Management Influences on Customer Service
Logistics System Information
LSI is critical to successful order management and customer service.
1. Pretransaction information is used for planning,
2. Transaction information is used for execution
3. Posttransaction information is used for evaluation.
INFORMATION USER
TRANSPORTATION
ACTIVITY
SHIPPER CARRIER RECEIVER
Pretransaction P.O. Information
Forecasts
Equipment Availability
BOL Information
Forecasts
Pickup/Delivery Time
Advance
Advance Ship Notice
Transaction Shipment Status Shipment Status Shipment Status
Posttransaction Freight Bill
Carrier Performance
Proof of Delivery
Claim Information
Payment Claim
Information
Carrier Performance
Proof of Delivery Claim
Information
Source
Table
8.9:
Robert
A.
Novack,
Ph.D.
Used
with
permission.
208
©2021 Cengage Learning. All Rights Reserved. May not be scanned, copied or duplicated, or posted to a publicly accessible website, in whole or in part.
Order Management Influences on Customer Service
Logistics System Information Metrics
Most metrics involved with LSI address how accurate and timely the data are to
allow a decision to be made or an activity to be performed.
Examples
• Forecast accuracy (measure accuracy of data on past consumption and
predictions on future consumption)
• Inventory accuracy (measure accuracy of inventory counts in a distribution
center)
• Data integrity (measure the quality/accuracy of inputs to an LSI)
• EDI compliance (measure how well trading partners are complying with EDI
standards when sharing data).
209
©2021 Cengage Learning. All Rights Reserved. May not be scanned, copied or duplicated, or posted to a publicly accessible website, in whole or in part.
Order Management Influences on Customer Service
Postsale Logistics Support and Metrics
Two Forms of Postsale Logistics Support (PLS)
The management of product
returns from the customer to the
supplier
• For the most part, the PLS
that manages product
returns is measured by the
ease with which a
customer can return a
product.
The delivery and installation of
spare parts
• Metrics for a PLS that
manages spare parts are
the same as those used for
all products, but availability
and time are relatively
more critical for spare parts
logistics.
210
©2021 Cengage Learning. All Rights Reserved. May not be scanned, copied or duplicated, or posted to a publicly accessible website, in whole or in part.
Service Recovery
211
©2021 Cengage Learning. All Rights Reserved. May not be scanned, copied or duplicated, or posted to a publicly accessible website, in whole or in part.
Service Recovery
Key Aspects
Service recovery requires an organization to realize that mistakes will occur and
to have plans in place to fix them.
Key Aspects of Service Recovery
• Measuring the costs of poor service.
• Anticipating the needs for recovery.
• Developing employee training and empowerment.
212
©2021 Cengage Learning. All Rights Reserved. May not be scanned, copied or duplicated, or posted to a publicly accessible website, in whole or in part.
Summary
• Order management and customer service are not mutually exclusive; there is a direct
and critical relationship between these two concepts.
• Two distinct, yet related, aspects of order management are: influencing the customer’s
order and executing the customer’s order.
− Combining ABC, customer profitability, and customer segmentation tools with CRM
allows companies to differentiate their offerings to different customer segments.
− Order execution is the buyer-seller interface in the market and directly influences
customer service (time, dependability, communications, and convenience).
• Five outputs from order management influencing customer service, customer
satisfaction, and profitability are: (1) Product availability, (2) Order cycle time,
(3) Logistics operations responsiveness, (4) Logistics system information,
and (5) Postsale logistics support.
213
©2021 Cengage Learning. All Rights Reserved. May not be scanned, copied or duplicated, or posted to a publicly accessible website, in whole or in part.
Supply Chain
Management,
11e
Chapter 9: Managing Inventory in the
Supply Chain
©2021 Cengage Learning. All Rights Reserved. May not be scanned, copied or duplicated, or posted to a publicly accessible website, in whole or in part.
214
©2021 Cengage Learning. All Rights Reserved. May not be scanned, copied or duplicated, or posted to a publicly accessible website, in whole or in part.
Discussion Outline
• Importance of inventory in the economy and in the firm
• Major types of inventory and reasons for carrying them
• Major types of costs associated with inventory
• Approaches to managing inventory
• Inventory classification
215
©2021 Cengage Learning. All Rights Reserved. May not be scanned, copied or duplicated, or posted to a publicly accessible website, in whole or in part.
Inventory in the US Economy
Image
courtesy
of
qainfotech.com,
innorange.fi,
studiotheory.net
216
©2021 Cengage Learning. All Rights Reserved. May not be scanned, copied or duplicated, or posted to a publicly accessible website, in whole or in part.
Inventory in the Firm (1 of 2)
2018 Total Logistics Costs ($ Billion)
Carrying Costs—$2.750 Trillion All Business Inventory
Interest 192.5
Taxes, Obsolescence, Depreciation, Insurance 148.1
Warehousing 153.1
SUBTOTAL 493.7
Transportation Costs—Motor Carriers
Truck—Intercity 688.8
Truck—Local 104.9
SUBTOTAL 773.7
Source Table 9.2: Cresting the Hill4, CSCMP’s Annual State of Logistics Report, 2018. Reproduced with permission of Council of Supply Chain Management Professionals.
217
©2021 Cengage Learning. All Rights Reserved. May not be scanned, copied or duplicated, or posted to a publicly accessible website, in whole or in part.
Inventory in the Firm (2 of 2)
2018 Total Logistics Costs ($ Billion)
Transportation Costs—Other Carriers
Railroads 88.4
Water (international 31, domestic 9) 45.7
Oil Pipelines 53.0
Air (international 12, domestic 16) 76.5
SUBTOTAL 263.6
Carrier Support Activities 52.3
Shipper’s Administrative Costs 52.1
TOTAL LOGISTICS COST 1,635.46
Source Table 9.2: Cresting the Hill4, CSCMP’s Annual State of Logistics Report, 2018. Reproduced with permission of Council of Supply Chain Management Professionals.
218
©2021 Cengage Learning. All Rights Reserved. May not be scanned, copied or duplicated, or posted to a publicly accessible website, in whole or in part.
Major Types of Inventory and
Reasons for Carrying Them
219
©2021 Cengage Learning. All Rights Reserved. May not be scanned, copied or duplicated, or posted to a publicly accessible website, in whole or in part.
Types of Inventory and Rationales
1. Procurement (purchase discounts), production (long production run), and
transportation (freight rate discounts)
2. Demand- and supply-side uncertainties
3. Inventory costs associated with goods in motion during transportation time period.
4. Inventory costs associated with goods in process during manufacture or assembly
of a complex product.
5. Seasonality in raw materials supply (e.g. production, transportation), in demand for
finished product, or in both
6. Inventory hold in anticipation that an unusual event (e.g. strikes, significant price
increase, extreme weather)
220
©2021 Cengage Learning. All Rights Reserved. May not be scanned, copied or duplicated, or posted to a publicly accessible website, in whole or in part.
The Importance of Inventory in Other
Functional Areas
Objectives of the finance area might obviously conflict with marketing and manufacturing
objectives. A more subtle conflict sometimes arises between marketing and manufacturing as the
long production runs can cause shortages of some products needed by marketing.
• Marketing
− In favor of holding sufficient, or extra, inventory to ensure product availability to meet
customer needs and new product offerings for continued market growth.
• Manufacturing
− In favor of long production runs of a single product with minimal changeovers to lower labor
and machine costs per unit, resulting in high inventory levels of the product.
• Finance
− In favor of low inventories to increase inventory turns, reduce liabilities and assets, and
increase cash flow to the organization.
221
©2021 Cengage Learning. All Rights Reserved. May not be scanned, copied or duplicated, or posted to a publicly accessible website, in whole or in part.
Inventory Costs
222
©2021 Cengage Learning. All Rights Reserved. May not be scanned, copied or duplicated, or posted to a publicly accessible website, in whole or in part.
Inventory Costs
Major Types of Costs
Emphasis of inventory cost analysis should be placed on the variable components of these costs.
Inventory Costs
• Inventory Carrying Cost
− Inventory carrying costs incurred by inventory at rest and waiting to be used. Four major components:
Capital cost, Storage space cost, Inventory service cost, and Inventory risk cost.
• Ordering and Setup Cost
− Ordering cost refers to expense of placing an order, excluding the cost of the product itself. Setup cost
refers to the expense of changing/modifying a production/assembly process to facilitate line
changeovers.
• Expected Stockout Cost
− The cost associated with not having a product/materials available to meet customer/production
demand. Most organizations hold safety stock or buffer stock, to minimize the possibility of a stockout
and costs of lost sales.
• In-transit Inventory Carrying Cost
− Generally, carrying inventory in transit costs less than in warehouses. But, in-transit inventory carrying
cost becomes especially important on global moves since both distance & time increase.
223
©2021 Cengage Learning. All Rights Reserved. May not be scanned, copied or duplicated, or posted to a publicly accessible website, in whole or in part.
Inventory Costs
Carrying Cost vs. Ordering Cost
Ordering cost and carrying cost respond in opposite ways to changes in the
number of orders or size of individual orders.
Source
Figure
9.2:
C.
John
Langley
Jr.,
Ph.D.
Used
with
permission.
224
©2021 Cengage Learning. All Rights Reserved. May not be scanned, copied or duplicated, or posted to a publicly accessible website, in whole or in part.
Inventory Costs
Safety Stocks and Service Levels
The higher the service level requirement (lower stockout rate), the higher the inventory level requirement.
Source
Figure
9.3
C.
John
Langley
Jr.,
Ph.D.
Used
with
permission.
225
©2021 Cengage Learning. All Rights Reserved. May not be scanned, copied or duplicated, or posted to a publicly accessible website, in whole or in part.
Approaches to Managing
Inventory
Fundamental Approaches: Fixed order quantity & Fixed order interval EOQ
Additional Approaches: JIT, MRP, DRP, and VMI
226
©2021 Cengage Learning. All Rights Reserved. May not be scanned, copied or duplicated, or posted to a publicly accessible website, in whole or in part.
Inventory Management Approaches
Managing inventory involved four fundamental questions:
• How much should inventory be ordered?
• When should inventory be ordered?
• Where should inventory be held?
• What specific line items should be available at specific locations?
227
©2021 Cengage Learning. All Rights Reserved. May not be scanned, copied or duplicated, or posted to a publicly accessible website, in whole or in part.
Inventory Management Approaches
Cost vs. Service Tradeoff Considerations
Regardless of the approach selected, inventory decisions must consider the basic
tradeoff between cost and service.
Source
Figure
9.4:
Robert
A.
Novack,
Ph.D.
Used
with
permission.
228
©2021 Cengage Learning. All Rights Reserved. May not be scanned, copied or duplicated, or posted to a publicly accessible website, in whole or in part.
Inventory Management Approaches
Key Factors of Difference
Inventory management approaches differ in terms of three key factors.
Key Factors
1. Dependent vs. Independent demand. Independent demand is unrelated to the demand
for other items, while dependent demand is directly related to, or derives from, the demand
for another inventory item or product.
2. Pull vs. Push. The “pull” approach relies on customer orders to move product through a
logistics system, while the “push” approach uses inventory replenishment techniques in
anticipation of demand to move products.
3. System-wide vs. Single-facility solutions. A system-wide approach plans and executes
inventory decisions across multiple nodes in the logistics system. A single-facility approach
does so for shipments and receipts between a single shipping and receiving point.
229
©2021 Cengage Learning. All Rights Reserved. May not be scanned, copied or duplicated, or posted to a publicly accessible website, in whole or in part.
Inventory Management Approaches
Key Differences
Key Factors of
Difference
EOQ JIT MRP DRP VMI
Dependent vs.
Independent demand
Both Dependent Dependent
Independen
t
Both
Pull vs. Push Both Pull Push Push Push
System-wide vs. Single-
facility solution
Single
facility
Single
facility
System-
wide
System-
wide
Both
Inventory Management Approaches
230
©2021 Cengage Learning. All Rights Reserved. May not be scanned, copied or duplicated, or posted to a publicly accessible website, in whole or in part.
Inventory Management Approaches
EOQ Approach
Two basic forms of the economic order quantity (EOQ) model
Fixed Order Quantity
• Involves ordering a fixed amount of product each time reordering takes place.
• Also called two-bin model.
Fixed Order Interval
• Involves ordering inventory at fixed or regular intervals.
• Also called the fixed period or fixed review period approach.
• Generally, the amount ordered depends on how much is in stock and available at
the time of review.
231
©2021 Cengage Learning. All Rights Reserved. May not be scanned, copied or duplicated, or posted to a publicly accessible website, in whole or in part.
Inventory Management Approaches (1 of 3)
Fixed Order Quantity EOQ Approach: Condition of Certainty
In fixed order quantity EOQ model, inventory is reordered when the amount on hand reaches
the reorder point. The reorder point quantity depends on the time it takes to get the new order and
on the demand for the item during this lead time.
Source
Figure
9.5:
John
J.
Coyle,
DBA.
Used
with
permission.
232
©2021 Cengage Learning. All Rights Reserved. May not be scanned, copied or duplicated, or posted to a publicly accessible website, in whole or in part.
Inventory Management Approaches (2 of 3)
Fixed Order Quantity EOQ: Condition of Certainty
Given the assumptions, the simple EOQ model considers only
2 basic types of cost: inventory carrying cost and ordering cost.
Source
Figure
9.11:
C.
John
Langley
Jr.,
Ph.D.
Used
with
permission.
Basic assumptions of the
simple EOQ model
• Continuous, constant, and
known rate of demand
• Constant and known
replenishment or lead time
• All demand is satisfied.
• Constant price or cost that
is independent of the
order quantity
• No inventory in transit
• One item of inventory or
no interaction between
items
• Infinite planning horizon
• Unlimited capital
233
©2021 Cengage Learning. All Rights Reserved. May not be scanned, copied or duplicated, or posted to a publicly accessible website, in whole or in part.
Inventory Management Approaches (3 of 3)
Fixed Order Quantity EOQ: Condition of Certainty
Because several factors can influence the reliability of demand (or usage rate) and lead time, the
fixed order quantity model is adjusted by reformulating the reorder point to allow for safety stock.
Source
Figur
9.12e:
John
J.
Coyle,
DBA.
Used
with
permission.
234
©2021 Cengage Learning. All Rights Reserved. May not be scanned, copied or duplicated, or posted to a publicly accessible website, in whole or in part.
Inventory Management Approaches (1 of 2)
Additional Approaches: Just-in-Time (JIT)
JIT systems are designed to
manage lead times and
eliminate waste. Many JIT
systems place a high priority
on short, consistent lead
times. However, the length of
the lead time is not as
important as the reliability of
the lead time.
EOQ vs. JIT:
Attitudes and
Behaviors
FACTOR EOQ JIT
Inventory Asset Liability
Safety stock Yes No
Production runs Long Short
Setup times Amortize Minimize
Lot sizes EOQ 1 for 1
Queues Eliminate Necessary
Lead times Tolerate Shorten
Quality inspection Important parts 100% process
Suppliers/customers Adversaries Partners
Supply sources Multiple Single
Employees Instruct Involve
Source
Table
9.18:
Adapted
from
William
M.
Boyst,
III,
“JIT
American
Style,”
Proceedings
of
the
1988
Conference
of
the
American
Production
&
Inventory
Control
Society
(APICS,
1988):
468.
Reproduced
by
permission.
235
©2021 Cengage Learning. All Rights Reserved. May not be scanned, copied or duplicated, or posted to a publicly accessible website, in whole or in part.
Inventory Management Approaches (2 of 2)
Additional Approaches: Just-in-Time (JIT)
• JIT commitment to short, consistent lead times and to minimizing or eliminating
inventories is JIT principal differentiator from the more traditional approaches.
• JIT saves money on downstream inventories by placing greater reliance on
improved responsiveness and flexibility.
• Successful JIT applications:
− Place a high priority on efficient and dependable manufacturing processes.
− Demand effective and dependable communications & information systems,
and high-quality, consistent transportation services.
236
©2021 Cengage Learning. All Rights Reserved. May not be scanned, copied or duplicated, or posted to a publicly accessible website, in whole or in part.
Inventory Management Approaches (1 of 3)
Additional Approaches: Materials Requirements Planning (MRP)
MRP deals specifically with supplying materials and component parts whose
demand depends on the demand for a specific end product.
1. Ensure the availability of materials, components, and products for planned
production and for customer delivery.
2. Maintain the lowest possible inventory levels that support service
objectives.
3. Plan manufacturing activities, delivery schedules, and purchasing
activities.
237
©2021 Cengage Learning. All Rights Reserved. May not be scanned, copied or duplicated, or posted to a publicly accessible website, in whole or in part.
Inventory Management Approaches (2 of 3)
Additional Approaches: MRP
An MRP system is designed to translate a master production schedule into time-phased net
inventory requirements and the planned coverage of such requirements for each component item
needed to implement this schedule.
Source
Figures
9.15
and
9.16:
John
J.
Coyle,
DBA.
Used
with
permission.
238
©2021 Cengage Learning. All Rights Reserved. May not be scanned, copied or duplicated, or posted to a publicly accessible website, in whole or in part.
Inventory Management Approaches (3 of 3)
Additional Approaches: MRP
Principal advantages of MRP-based systems
• Maintain reasonable safety stock levels &
minimize or eliminate inventories whenever
possible.
• Identify process problems and potential supply
chain disruptions before they occur, allowing
necessary corrective actions.
• Base production schedules on actual demand and
forecasts of independent demand items.
• Coordinate materials ordering across multiple
points in a firm’s logistics network.
• Suitable for batch, intermittent assembly, or
project processes.
Principal shortcomings of MRP-based systems
• Computer-intensive applications, making changes
difficult once the system is in operation.
• Might increase ordering and transportation costs as
firms moving toward a more coordinated system of
ordering product in smaller amounts.
• Not as sensitive to short-term fluctuations in demand
as order point approaches
• Frequently become quite complex and sometimes do
not work exactly as intended.
239
©2021 Cengage Learning. All Rights Reserved. May not be scanned, copied or duplicated, or posted to a publicly accessible website, in whole or in part.
Inventory Management Approaches
Additional Approaches: Distribution Requirements Planning (DRP)
DRP systems accomplish for outbound shipments what MRP accomplishes for inbound shipments. DRP
determines replenishment schedules between a firm’s manufacturing facilities and its distribution centers.
DRP is usually coupled with MRP systems to manage the flow and timing of both inbound materials and
outbound finished goods.
COLUMBUS DISTRIBUTION CENTER—DISTRIBUTION RESOURCE PLANNING
CHICKEN NOODLE: Current BOH = 4.314; Q = 3,800; SS = 1,956; LT = 1
Q = Quantity; SS = Safety stock; LT = Lead time
WEEK JAN.
1 2 3 4
FEB.
5 6 7 8
MAR.
9
Forecast 974 974 974 974 989 1,002 1,002 1,002 1,061
Sched. Receipt 0 0 3,800 0 0 0 3,800 0 0
BOH—Ending 3,340 2,366 5,192 4,218 3,229 2,227 5,025 4,023 2,962
Planned Order 0 3,800 0 0 0 3,800 0 0 3,800
Actual Order
Source
Table
9.20:
A.
J.
Stenger,
“Distribution
Resources
Planning,”
Penn
State
University,
class
example.
240
©2021 Cengage Learning. All Rights Reserved. May not be scanned, copied or duplicated, or posted to a publicly accessible website, in whole or in part.
Inventory Management Approaches
Additional Approaches: Vendor-Managed Inventory (VMI)
Vendor-managed inventory manages inventories OUTSIDE a firm’s logistics network, specifically inventories
held in its customer’s distribution centers.
How VMI Works
1. The supplier and its customer agree on which products are to be managed using VMI in the customer’s
distribution centers.
2. An agreement is made on reorder points and economic order quantities for each of these products.
3. As these products are shipped from the customer’s distribution center, the customer notifies the
supplier, by SKU, of the volumes shipped on a real-time basis.
4. The supplier monitors on-hand inventories in the customer’s distribution center, and when the on-hand
inventory reaches the agreed-upon reorder point, the supplier creates an order for replenishment,
notifies the customer’s distribution center of the quantity and time of arrival, and ships the order to
replenish the distribution center.
241
©2021 Cengage Learning. All Rights Reserved. May not be scanned, copied or duplicated, or posted to a publicly accessible website, in whole or in part.
Inventory Management Approaches
Additional Approaches: VMI
Principal advantages of
VMI systems
• The knowledge gained by the
supplier of real-time inventory levels
of its products at its customer
locations allows the shipper more
time to react to sudden swings in
demand to assure that stockouts do
not occur.
Principal shortcomings of
VMI systems
• Suppliers’ uses of VMI to push excess
inventory to a customer distribution
center at the end of the month in order
to meet monthly sales quotas, resulting
in the customer holding extra inventory,
adding costs to its operations.
242
©2021 Cengage Learning. All Rights Reserved. May not be scanned, copied or duplicated, or posted to a publicly accessible website, in whole or in part.
Inventory Management Approaches
Inventory Management Techniques in the Logistics Network
Many organizations today use all of the techniques shown in managing inventories in
their logistics networks. In general, as an inventory technique manages inventory closer
to the point of real demand (e.g. VMI and CPFR), forecast accuracy increases, forecast
cycles decrease, and product availability increases.
Source
Figure
9.19:
Robert
A.
Novack,
Ph.D.
Used
with
permission.
243
©2021 Cengage Learning. All Rights Reserved. May not be scanned, copied or duplicated, or posted to a publicly accessible website, in whole or in part.
Inventory Classification
244
©2021 Cengage Learning. All Rights Reserved. May not be scanned, copied or duplicated, or posted to a publicly accessible website, in whole or in part.
Inventory Classification
Techniques
Multiple product lines and inventory control require organizations to focus on more important inventory items
and use more sophisticated and effective approaches to inventory management.
ABC Analysis
ABC classification technique assigns inventory items to one of three groups according to the relative
impact or value of the items that make up the group. A items are considered to be the most important, B
items lesser importance, and C items least important.
Pareto’s Law (The “80–20” Rule)
Pareto’s Law “80–20” rule suggests that a relatively small percentage of inventory might account for a
large percentage of the overall impact or value.
Quadrant Model
Quadrant model classifies finished goods inventories using value and risk to the firm as the criteria.
Value is measured as the value contribution to profit; risk is the negative impact of not having the product
available when it is needed.
245
©2021 Cengage Learning. All Rights Reserved. May not be scanned, copied or duplicated, or posted to a publicly accessible website, in whole or in part.
Inventory Classification
ABC Classification
Source
Figure
9.20:
John
J.
Coyle,
DBA.
Used
with
permission.
In many ABC analyses, a common
mistake is to think of the B and C
items as being far less important
than the A items. However, all items
in the A, B, and C categories are
important to some extent and each
category deserves its own strategy to
assure availability at an appropriate
level of cost (stockout cost vs.
inventory carrying cost).
246
©2021 Cengage Learning. All Rights Reserved. May not be scanned, copied or duplicated, or posted to a publicly accessible website, in whole or in part.
Inventory Classification
Quadrant Model
Items with high value and high risk (critical items) need to be managed carefully to ensure adequate supply.
Items with low risk and low value (generic or routine items) can be managed much less carefully.
Source
Figure
9.21:
Robert
A.
Novack,
Ph.D.
Used
with
permission.
247
©2021 Cengage Learning. All Rights Reserved. May not be scanned, copied or duplicated, or posted to a publicly accessible website, in whole or in part.
Summary (1 of 2)
• Principal types of inventory are: cycle stock, work-in-process, inventory in transit,
safety stock, seasonal stock, and anticipatory stock.
• Principal types of inventory costs are: inventory carrying, ordering and setup,
expected stockout, and in-transit inventory.
• Four major components of inventory carrying costs are: Capital cost, Storage
space cost, Inventory service cost, and Inventory risk cost.
• Choosing appropriate inventory model considers three key differences:
Independent vs. dependent demand, Push vs. pull distribution system, and
system-wide vs. specific facility decisions.
248
©2021 Cengage Learning. All Rights Reserved. May not be scanned, copied or duplicated, or posted to a publicly accessible website, in whole or in part.
Summary (2 of 2)
• Two basic forms of the EOQ model are the fixed quantity model and the fixed
interval model. The former is the most widely used.
• JIT model aims to minimize inventory levels, emphasizing frequent deliveries of
smaller quantities and alliances with suppliers or customers.
• MRP and DRP are typically used in conjunction to manage the flow and timing of
both inbound materials and outbound finished goods.
• VMI is used to manage a firm’s inventories in its customers’ distribution centers.
• Inventory classification is vital initial step toward efficient
inventory management.
249
©2021 Cengage Learning. All Rights Reserved. May not be scanned, copied or duplicated, or posted to a publicly accessible website, in whole or in part.
Supply Chain
Management,
11e
Chapter 10: Distribution—Managing
Fulfillment Operations
©2021 Cengage Learning. All Rights Reserved. May not be scanned, copied or duplicated, or posted to a publicly accessible website, in whole or in part.
250
©2021 Cengage Learning. All Rights Reserved. May not be scanned, copied or duplicated, or posted to a publicly accessible website, in whole or in part.
Discussion Outline
• Roles and functionality
• Trade-offs and challenges
• Planning and strategy
• Execution
• Metrics
• Technology
251
©2021 Cengage Learning. All Rights Reserved. May not be scanned, copied or duplicated, or posted to a publicly accessible website, in whole or in part.
Roles & Functionality
252
©2021 Cengage Learning. All Rights Reserved. May not be scanned, copied or duplicated, or posted to a publicly accessible website, in whole or in part.
The Role of Distribution Operations in SCM
1. Enhance customer service
2. Balance supply & demand
3. Protect against uncertainty
4. Allow quantity purchase discounts
5. Support production requirements
6. Fulfill omni-channel demand
7. Promote transport economies
253
©2021 Cengage Learning. All Rights Reserved. May not be scanned, copied or duplicated, or posted to a publicly accessible website, in whole or in part.
Distribution Facility Functionality
• Primary Functions
1. Accumulation
2. Sortation
3. Allocation
4. Assortment
• Value-Adding Roles
− Examples: Assembly, kitting, product postponement, sequencing
254
©2021 Cengage Learning. All Rights Reserved. May not be scanned, copied or duplicated, or posted to a publicly accessible website, in whole or in part.
Distribution Facility Functionality
Primary Functions: Accumulation
The DC serves as a collection point for product coming from multiple origins and provides required
transfer, storage, or processing services, allowing firms to consolidate orders and shipments for
production and fulfillment processes.
Source
Figure
10.1:
Brian
J.
Gibson,
Ph.D.
Used
with
permission.
255
©2021 Cengage Learning. All Rights Reserved. May not be scanned, copied or duplicated, or posted to a publicly accessible website, in whole or in part.
Distribution Facility Functionality
Primary Functions: Sortation and Allocation
Sortation
• Sortation focuses on assembling like products together for storage in the
distribution facility, processing or transfer to customers.
• Proper sortation is essential for effective inventory & order fulfillment.
Allocation
• Allocation focuses on matching available inventory to customer orders for an
SKU.
• This break-bulk capacity promotes product availability for multiple customers
and in desired quantities.
256
©2021 Cengage Learning. All Rights Reserved. May not be scanned, copied or duplicated, or posted to a publicly accessible website, in whole or in part.
Distribution Facility Functionality
Primary Functions: Assortment
Assortment involves the assembly of customer orders for multiple SKUs held in the distribution facility. This
mixing capability avoids the expenses related to placing numerous orders and having them shipped from a
variety of locations.
Source
Figure
10.2:
Brian
J.
Gibson,
Ph.D.
Used
with
permission.
257
©2021 Cengage Learning. All Rights Reserved. May not be scanned, copied or duplicated, or posted to a publicly accessible website, in whole or in part.
Distribution Facility Functionality
Value-Adding Roles
• Light assembly services
• Inventory management and visibility
• Product kitting, bundling, and unbundling
• Product postponement
• Production sequencing
• Quality control
• Recycling, repair, and returns management
258
©2021 Cengage Learning. All Rights Reserved. May not be scanned, copied or duplicated, or posted to a publicly accessible website, in whole or in part.
Trade-offs and Challenges
259
©2021 Cengage Learning. All Rights Reserved. May not be scanned, copied or duplicated, or posted to a publicly accessible website, in whole or in part.
Key Distribution Tradeoffs
Functional Tradeoffs
How to best balance customer service
and costs.
• Warehouse
• Transportation
• Inventory
• Customer service
Facility-Level Tradeoffs
How to best balance financial and
performance.
• Space
• Equipment
• People
260
©2021 Cengage Learning. All Rights Reserved. May not be scanned, copied or duplicated, or posted to a publicly accessible website, in whole or in part.
Key Distribution Tradeoffs
Functional Tradeoffs
Source
Figure
10.3:
Brian
J.
Gibson,
Ph.D.
Used
with
permission.
261
©2021 Cengage Learning. All Rights Reserved. May not be scanned, copied or duplicated, or posted to a publicly accessible website, in whole or in part.
Key Distribution Tradeoffs
Facility-Level Tradeoffs
• Space vs. Equipment. The larger the facility and the more space used for
distribution operations; the more equipment will be needed in the facility.
• Equipment vs. People. The greater the use of equipment to automate
materials handling and distribution activity, the lower the labor requirements of
a facility.
• People vs. Space. The larger the facility workforce, the larger the facility size
and throughput possible.
262
©2021 Cengage Learning. All Rights Reserved. May not be scanned, copied or duplicated, or posted to a publicly accessible website, in whole or in part.
Key Distribution Challenges
Labor Availability
Issues
• Historically low U.S.
unemployment rates
• Nature of DC operations
work creates ongoing
turnover challenge
• Smaller labor pool due to
aging workforce
• Solution: DC automation
and assistive technology
Demand Variation
• Seasonal demand creates
space and equipment
utilization challenges, as
well as labor retention
problem.
• Solution: Third party
logistics facility use during
peak season, shared
capacity with seasonal
products that have
alternate primary selling
seasons
Increasing Customer
Requirements
• Strong desire for value-
added capabilities and
services.
• Growing expectations for
faster, smaller, and more
frequent order fulfillment.
• Solution: Flexible
fulfillment processes
263
©2021 Cengage Learning. All Rights Reserved. May not be scanned, copied or duplicated, or posted to a publicly accessible website, in whole or in part.
Planning and Strategy
264
©2021 Cengage Learning. All Rights Reserved. May not be scanned, copied or duplicated, or posted to a publicly accessible website, in whole or in part.
Distribution Planning and Strategy
Distribution strategies should tailor to products being handled, customer requirements, and available internal
expertise and resources. A series of interrelated planning decisions must be made to ensure that the
strategy can be executed at a reasonable cost while supporting supply chain demands.
Source
Figure
10.4:
Brian
J.
Gibson,
Ph.D.
Used
with
permission.
265
©2021 Cengage Learning. All Rights Reserved. May not be scanned, copied or duplicated, or posted to a publicly accessible website, in whole or in part.
Distribution Planning and Strategy
Cross-Docking: Low-Tech Option
Source
Figure
10.5:
Brian
J.
Gibson,
Ph.D.
Used
with
permission.
266
©2021 Cengage Learning. All Rights Reserved. May not be scanned, copied or duplicated, or posted to a publicly accessible website, in whole or in part.
Distribution Planning and Strategy
Cross-Docking: High-Tech Options
Source
Figure
10.5:
Brian
J.
Gibson,
Ph.D.
Used
with
permission.
267
©2021 Cengage Learning. All Rights Reserved. May not be scanned, copied or duplicated, or posted to a publicly accessible website, in whole or in part.
Distribution Planning and Strategy
Network Design Issues: Number & Location
Source
Figure
10.6:
Edward
J.
Bardi,
Ph.D.
Used
with
permission.
• Determining the number of
facilities needed for a supply
chain involves the evaluation
of cost tradeoffs with other
functional areas.
• Effective location selection
requires analysis of the DC’s
intended function, sources
and volume of supply,
customer locations and
demand patterns, and related
fulfillment costs.
268
©2021 Cengage Learning. All Rights Reserved. May not be scanned, copied or duplicated, or posted to a publicly accessible website, in whole or in part.
Distribution Planning and Strategy (1 of 2)
Network Design Issues: Ownerships
Decisions on facility ownerships – private facilities, public facilities, or contract facilities – should
be made based on the organization’s expertise vs. scope of tasks required & financial resources
relative to the number and size of facilities needed.
Source
Figure
10.7:
Edward
J.
Bardi,
Ph.D.
Used
with
permission.
269
©2021 Cengage Learning. All Rights Reserved. May not be scanned, copied or duplicated, or posted to a publicly accessible website, in whole or in part.
Distribution Planning and Strategy (2 of 2)
Network Design Issues: Ownerships
Factors Affecting Distribution Facility Ownership
Firm Characteristics
Favors Private
Distribution
Favors 3PL
Distribution
Throughput volume Higher Lower
Demand variability Stable Fluctuating
Market density Higher Lower
Special physical control needs Yes No
Security requirements Higher Lower
Customer service requirements Higher Lower
Multiple use needs Yes No
Source
Table
10.2:
Brian
J.
Gibson,
Ph.D.
Used
with
permission.
270
©2021 Cengage Learning. All Rights Reserved. May not be scanned, copied or duplicated, or posted to a publicly accessible website, in whole or in part.
Distribution Planning and Strategy
Facility Considerations: Size
• Typically, the more facilities in the distribution network, the smaller they need
to be.
• Demand forecasts for the facility can be used to create a rough estimate of
space requirements.
• Given forecasted demand, each facility must be large enough to:
− Accommodate the distribution activities that will be performed within the
four walls.
− Interface with the transportation network.
271
©2021 Cengage Learning. All Rights Reserved. May not be scanned, copied or duplicated, or posted to a publicly accessible website, in whole or in part.
Distribution Planning and Strategy
Facility Considerations: Layout
The company must make decisions regarding aisle space, shelving,
materials-handling equipment, and interior dimensions of the facility.
Facility Layout Principle Benefit
Use a one-story facility  Provides more usable space per investment dollar
 Results in lower construction costs
Use vertical capacity  Reduces building footprint and land requirements
Minimize aisle space  Provides more storage and processing capacity
Use direct product flows  Avoids backtracking and costly travel time
Deploy warehouse automation solutions  Improves facility productivity and safety
 Reduces travel time
 Reduces labor needs
Use an appropriate product storage plan  Maximizes space utilization and product protection
Source
Table
10.3:
Brian
J.
Gibson,
Ph.D.
Used
with
permission.
272
©2021 Cengage Learning. All Rights Reserved. May not be scanned, copied or duplicated, or posted to a publicly accessible website, in whole or in part.
Distribution Planning and Strategy
Facility Considerations: Product Location (Slotting)
Slotting is defined as the placement of product in a facility for the purpose of
optimizing materials-handling and space efficiency.
Commonly Used Criteria
1. Popularity. Locate high volume (popular) items near the shipping area and
the low volume (unpopular) items away from the shipping area.
2. Unit size. Locate small-size items (cubic dimensions) near the shipping
area and larger-size items farther away from the shipping area.
3. Cube. Locate the items with smaller total cubic space requirements (item
cube multiplied by the number of items held) near the shipping area and
those with larger space requirements farther away from the shipping area.
273
©2021 Cengage Learning. All Rights Reserved. May not be scanned, copied or duplicated, or posted to a publicly accessible website, in whole or in part.
Distribution Planning and Strategy
Facility Considerations: Slotting
Proper product slotting can improve fulfillment performance and generate other
advantages for the organization & its customers.
• Picking productivity
• Efficient replenishment
• Work balancing
• Load building
• Picking accuracy
• Ergonomics
• Pre-consolidation
274
©2021 Cengage Learning. All Rights Reserved. May not be scanned, copied or duplicated, or posted to a publicly accessible website, in whole or in part.
Execution
275
©2021 Cengage Learning. All Rights Reserved. May not be scanned, copied or duplicated, or posted to a publicly accessible website, in whole or in part.
Distribution Execution
Product-Handling Functions
Source
Figure
10.8:
Brian
J.
Gibson,
Ph.D.
Used
with
permission.
276
©2021 Cengage Learning. All Rights Reserved. May not be scanned, copied or duplicated, or posted to a publicly accessible website, in whole or in part.
Distribution Execution
Order Picking Best Practices
For many organizations, order picking is the most labor-intensive and expensive
distribution activity, often accounting for more than half of DC operating costs.
Principle Best Practices
Minimize travel time  Sequence pick patterns for single trip
 Use batch picking or zone picking
Maximize time spent picking product  Eliminate paperwork
 Store like items near each other
Facilitate accurate order picking  Provide clean, well-lit work areas
 Identify all pick locations clearly
 Require location validation during picking
Leverage materials-handling equipment  Use carousels and AS/RS systems
 Deploy conveyors and shuttle systems
Minimize idle time  Slot fast-moving inventory for easy access
 Use time standards for picking operations
 Maintain inventory in pick slots
Source
Table
10.4:
Adapted
from
Gwynne
Richards,
Warehouse
Management:
A
Complete
Guide
to
Improving
Efficiency
and
Minimizing
Cost
in
the
Modern
Warehouse
,
3
rd
Edition,
(London
England:
Kogan
Page,
2018),
Chapter
5;
WIQ
Editor,
“Order
Picking
Strategies
for
a
Warehouse,”
Warehouse
IQ
(April
20,
2017).
Retrieved
June
24,
2019
from
https://www.warehouseiq.com/order-picking-strategies-warehouse/;
and,
“Tips
for
Improving
Warehouse
Efficiency,”
Cherry’s
Industrial
Equipment
(August
27,
2018).
Retrieved
June
24,
2019
from
https://www.material-handling.com/blogs/improve-picking-efficiency/.
277
©2021 Cengage Learning. All Rights Reserved. May not be scanned, copied or duplicated, or posted to a publicly accessible website, in whole or in part.
Distribution Execution
Support Functions
Support functions provide coordination between key processes and across the supply chain,
protect the organization’s inventory investment, and improve working conditions within the facility.
Key support functions
• Inventory control
• Safety, maintenance, and sanitation
• Security
• Performance analysis
• Information technology
278
©2021 Cengage Learning. All Rights Reserved. May not be scanned, copied or duplicated, or posted to a publicly accessible website, in whole or in part.
Metrics
279
©2021 Cengage Learning. All Rights Reserved. May not be scanned, copied or duplicated, or posted to a publicly accessible website, in whole or in part.
Distribution Metrics
Customer service aspects of distribution performance should target order accuracy,
completeness, and timeliness.
Customer-Facing Metrics Calculation
Unit Fill Rate Total units shipped / Total units ordered
Case Fill Rate Total cases shipped / Total cases ordered
Order Value Fill Rate Total value shipped / Total value ordered
Order Accuracy Total correct units shipped / Total units shipped
Document Accuracy
Total correct customer invoices / Total customer
invoices
On Time Dispatch
Total orders ready by deadline / Total orders
dispatched
Perfect Order Index
Complete Order % x Damage-Free % x Billing
Accuracy % x On-Time Dispatch %
Source
Table
10.5:
Brian
J.
Gibson,
Ph.D.
Used
with
permission.
280
©2021 Cengage Learning. All Rights Reserved. May not be scanned, copied or duplicated, or posted to a publicly accessible website, in whole or in part.
Distribution Metrics
Key elements of distribution performance address the efficiency, utilization, and
productivity of operations
Distribution Operation Metrics Calculation
Distribution cost per unit Total distribution cost/Total number of units processed
Distribution cost ratio Total distribution cost/Total cost of goods sold
Capacity utilization Total storage slots used/Total storage slots available
Equipment utilization Total operational time/Total time available
Labor productivity Total number of cases processed/Total hours paid
Distribution efficiency Task completion time/Standard time allowed
Source
Table
10.6:
Brian
J.
Gibson,
Ph.D.
Used
with
permission.
281
©2021 Cengage Learning. All Rights Reserved. May not be scanned, copied or duplicated, or posted to a publicly accessible website, in whole or in part.
Technology
282
©2021 Cengage Learning. All Rights Reserved. May not be scanned, copied or duplicated, or posted to a publicly accessible website, in whole or in part.
Distribution Technology
Warehouse Management Systems (WMS)
• Core software used to manage fulfillment processes, with value-added capabilities, including
labor management, automated data collection, task interleaving, fulfillment flexibility, and
systems convergence.
Automatic Identification (Auto-ID) Tools
• Auto-ID technologies help machines identify objects. Examples: Bar codes, smart cards, voice
recognition, biometric technologies, radio-frequency identification (RFID).
Source Figure 10.9: Courtesy of GS1 https://www.gs1.org/standards/barcodes/databar. Used with permission.
283
©2021 Cengage Learning. All Rights Reserved. May not be scanned, copied or duplicated, or posted to a publicly accessible website, in whole or in part.
Distribution Technology
The increasing use of technology and automation in distribution operations requires a new breed of
warehouse control systems (WCS) and warehouse execution systems (WES) to supplement traditional WMS.
284
©2021 Cengage Learning. All Rights Reserved. May not be scanned, copied or duplicated, or posted to a publicly accessible website, in whole or in part.
Summary
• Four primary functions of distribution facilities are: Accumulation, Sortation,
Allocation, and Assortment.
• Value-adding roles of distribution facilities complement the primary functions and
support evolving supply chain needs.
• Distribution strategy and planning involves decisions regarding capability
requirements, network design issues, and facility considerations.
• Distribution execution involves five primary processes related to the handling and
storage of product: (1) receiving, (2) put-away, (3) order picking, (4)
replenishment, and (5) shipping.
• Distribution KPIs address asset utilization, labor productivity,
cost efficiency of the operation, and customer service quality.
285
©2021 Cengage Learning. All Rights Reserved. May not be scanned, copied or duplicated, or posted to a publicly accessible website, in whole or in part.
Supply Chain
Management,
11e
Chapter 11: Transportation—Managing
the Flow of the Supply Chain
©2021 Cengage Learning. All Rights Reserved. May not be scanned, copied or duplicated, or posted to a publicly accessible website, in whole or in part.
286
©2021 Cengage Learning. All Rights Reserved. May not be scanned, copied or duplicated, or posted to a publicly accessible website, in whole or in part.
Discussion Outline
• The role of transportation in SCM
• Modes of transportation
• Transportation planning and strategy
• Transportation execution and control
• Transportation technology
287
©2021 Cengage Learning. All Rights Reserved. May not be scanned, copied or duplicated, or posted to a publicly accessible website, in whole or in part.
The Role of Transportation in SCM
Transportation Spend
Transportation accounts for nearly $1.04 trillion of the $1.6 trillion
spent on U.S. business logistics costs in 2018.
That’s 63% of the total!
288
©2021 Cengage Learning. All Rights Reserved. May not be scanned, copied or duplicated, or posted to a publicly accessible website, in whole or in part.
The Role of Transportation in Supply Chain
Management (SCM)
Transportation provides the critical links between organizations in a
supply chain network, permitting goods to flow between their facilities.
Transportation also influences supply chain design, strategy
development, and total cost management.
289
©2021 Cengage Learning. All Rights Reserved. May not be scanned, copied or duplicated, or posted to a publicly accessible website, in whole or in part.
The Role of Transportation in SCM
Role Inhibitors
• Offshore manufacturing
• Changing customer requirements
• Transportation capacity constraints
• Transportation rate variation
• Growing governmental requirements
290
©2021 Cengage Learning. All Rights Reserved. May not be scanned, copied or duplicated, or posted to a publicly accessible website, in whole or in part.
The Role of Transportation in SCM
Transportation Challenges
In 2018
Major transportation challenges
• Qualified driver availability – 56%
• Rising customer expectations – 48%
• managerial talent retention – 48%
• Service capacity availability – 45%
• Technology deployment cost – 42%
• Operating cost volatility – 34%
By 2030
The single most important challenge
• Rising customer expectations – 23%
• Technology deployment cost – 16%
• Qualified driver availability – 13%
• Operating cost volatility – 13%
• Capacity availability – 10%
291
©2021 Cengage Learning. All Rights Reserved. May not be scanned, copied or duplicated, or posted to a publicly accessible website, in whole or in part.
Modes of Transportation
292
©2021 Cengage Learning. All Rights Reserved. May not be scanned, copied or duplicated, or posted to a publicly accessible website, in whole or in part.
Modes of Transportation
Five Basic and Intermodal
The five basic modes of transportation and intermodal transportation each has different economic
and technical structures, and each can provide different qualities of link service.
Freight Shipments within the US (2019)
Mode of
Transportation
Value of Goods Tons (Millions) Ton-Miles (Billions)
Truck 69.3% 65.7% 39.6%
Rail 4.6% 10.4% 27.9%
Water 2.6% 4.2% 6.9%
Air 3.0% <1% <1%
Pipeline 7.4% 16.4% 17.5%
Multiple modes 12.3% 2.7% 7.8%
Other/Unknown <1% <1% <1%
Source
Table
11.1:
U.S.
Department
of
Transportation
Bureau
of
Transportation
Statistics,
2019
Pocket
Guide
to
Transportation
(2019):19.
293
©2021 Cengage Learning. All Rights Reserved. May not be scanned, copied or duplicated, or posted to a publicly accessible website, in whole or in part.
Modes of Transportation (1 of 2)
Motor Carriers
• Motor carriage is the most widely used mode of transportation in the US
domestic supply chain, and is useful for shipping goods to an adjacent countries
like Canada and Mexico.
• Much of the freight moved by the trucking industry is regional in nature, moving
within a 500-mile radius of the origin.
• Multiple equipment types and sizes allow motor carriers to transport a wide
variety of commodities and shipment sizes.
• Trucking is a high-variable-cost, low-fixed-cost business.
294
©2021 Cengage Learning. All Rights Reserved. May not be scanned, copied or duplicated, or posted to a publicly accessible website, in whole or in part.
Modes of Transportation (2 of 2)
Motor Carriers
The trucking industry is highly competitive, comprising of 543,061 interstate carriers and intrastate
hazardous materials carriers that range in size from single-truck, owner-operator service providers to
conglomerate like UPS.
Key challenges: Labor, costs, and competition
Motor Carrier Industry
• For-Hire (54%)
− Truckload (TL) – Less-than-Truckload (LTL) – Small Package
• Private (36%)
• For-Hire/Private Hybrid (9%)
• Others (1%)
295
©2021 Cengage Learning. All Rights Reserved. May not be scanned, copied or duplicated, or posted to a publicly accessible website, in whole or in part.
Modes of Transportation (1 of 2)
Railroads
• Railroads is a high ton-mile mode of transportation, moving nearly 1.8 billion
tons of freight with average shipment length of 554 miles annually.
• Railroad transportation is primarily used for the long-distance movement of low-
value goods. Railroads also handle some high-value goods, primarily
automobiles and intermodal containers.
• Railroads cost structure consists of high fixed costs in proportion to variable
costs due to a large investment in terminals, equipment, and trackage.
• Rail equipment can be organized into loads and transported in one of the three
primary ways: mixed trains, unit trains, and intermodal trains.
296
©2021 Cengage Learning. All Rights Reserved. May not be scanned, copied or duplicated, or posted to a publicly accessible website, in whole or in part.
Modes of Transportation (2 of 2)
Railroads
There are 600 railroads in the US, but the industry is dominated by seven Class I railroads. No
single rail carrier services the entire country. Carriers use interline agreements to provide
coast-to-coast rail service.
Key challenges: Captive shippers’ demand for rate relief, external factors e.g. fluctuating
economic conditions & severe weather events, and capacity.
• 600 Freight Rail Carriers
− 7 Class-I Linehaul Freight Carriers (BNSF, Canadian National, Canadian
Pacific, CSX, Kansas City Southern, Norfolk Southern, Union Pacific)
− 593 Shortline Carriers
297
©2021 Cengage Learning. All Rights Reserved. May not be scanned, copied or duplicated, or posted to a publicly accessible website, in whole or in part.
Modes of Transportation (1 of 2)
Air Carriers
• Air cargo transportation is specialized mode in terms of tonnage with U.S.
spending at $76.5 billion in 2018.
• Air transportation is used to ship small quantities of high-value, low-weight
goods.
• The air carrier cost structure consists of high variable costs in proportion to fixed
costs.
298
©2021 Cengage Learning. All Rights Reserved. May not be scanned, copied or duplicated, or posted to a publicly accessible website, in whole or in part.
Modes of Transportation (2 of 2)
Air Carriers
Key challenges: Decreased demand for products previously moved in large volume via air,
mode-shifting of freight from air to ocean, new rail connections in Asia, near-shoring and on-
shoring strategies.
Air Carriers
• Combination Carriers
• Air Cargo Carriers
− Integrated carriers (e.g. FedEx and UPS) provide door-to-door service, scheduled pickup
and delivery windows, and expedited service through their hub-and-spoke networks.
− Nonintegrated carriers provide on-demand, air-only service from airport to airport.
299
©2021 Cengage Learning. All Rights Reserved. May not be scanned, copied or duplicated, or posted to a publicly accessible website, in whole or in part.
Modes of Transportation (1 of 2)
Water Carriers
• Globally, water carriers dominate all other modes, garnering approximately half
of the international freight revenue and handling nearly all tonnage.
• The international ocean fleet includes approximately 53,000 merchant ships:
16,958 general cargo ships, 14,929 tankers, 11,379 bulk cargo ships, and 5,152
containerships.
• Domestic water carriers compete with railroads for long-distance movement of
low-value, high-density, bulk cargoes.
• The fleet of U.S. flagged fleet moves 6.9 percent of the nation’s freight value.
• Water transportation is a high variable cost business.
300
©2021 Cengage Learning. All Rights Reserved. May not be scanned, copied or duplicated, or posted to a publicly accessible website, in whole or in part.
Modes of Transportation (2 of 2)
Water Carriers
Key challenges: Significant overcapacity in the container shipping sector, congestion at major ports
and transfer points for containers, schedule reliability of liner service lagging behind other modes.
Water Carriers. Widely used specialized ships include: containerships, bulk
carriers, tankers, general cargo ships, roll-on/roll-off (RO-RO) vessels.
• Private
• For-Hire
− Liner services
− Charter services
301
©2021 Cengage Learning. All Rights Reserved. May not be scanned, copied or duplicated, or posted to a publicly accessible website, in whole or in part.
Modes of Transportation (1 of 2)
Pipelines
• The United States has the largest network of energy pipelines of any nation in the world.
• Pipelines is the most economical form of transport with the lowest cost per ton of any mode.
• Pipelines handled 5.6 percent of U.S. freight tonnage, the vast majority of products moved are
liquids and gases.
• Pipeline costs are predominantly fixed as pipeline operators must build their own right-of-way.
• The oil system is made up of three primary types of pipelines: gathering lines, trunk lines, and
refined product pipelines.
• The major difference of natural gas pipeline network from that of oil is the direct delivery of
natural gas to homes & businesses via local distribution lines.
302
©2021 Cengage Learning. All Rights Reserved. May not be scanned, copied or duplicated, or posted to a publicly accessible website, in whole or in part.
Modes of Transportation (2 of 2)
Pipelines
Key challenges: Network capacity, Health and environmental safety
Pipeline Carriers
• For-Hire
− For-hire carriers of liquid products can move different products through their system at the
same time.
• Private
− Private carriers include petroleum & natural gas companies that use pipelines to move
product to and from their facilities. Companies, like a power plant or a chemical plant, may
operate a small pipeline system to move fuel or feed-stocks.
303
©2021 Cengage Learning. All Rights Reserved. May not be scanned, copied or duplicated, or posted to a publicly accessible website, in whole or in part.
Modes of Transportation (1 of 2)
Intermodal
Intermodal transportation service refers to uses of two or more carriers of different modes in the
origin-to-destination movement of freight.
Primary Benefits
• Greater accessibility
• Overall cost efficiency without sacrificing service quality or accessibility
• Global trade facilitation
Importance & Volume Growth
• Number of containers flowing through North American ports reached 65 million TEUs in 2017
• U.S. rail system moved 14.5 million containers in 2018
Growth Drivers
• Development of standardized containers
• Better information systems
• New generations of ocean vessels, railcars, and truck trailers
304
©2021 Cengage Learning. All Rights Reserved. May not be scanned, copied or duplicated, or posted to a publicly accessible website, in whole or in part.
Modes of Transportation (2 of 2)
Intermodal
The freight services provided by intermodal transportation can be viewed in terms
of product-handling characteristics or the type of service used.
• Product-Handling Characteristics
− Containerized freight is loaded into or onto storage equipment at the origin and delivered
to the destination in or on that same piece of equipment with no additional handling.
− Transload freight involves goods that are handled and transferred between transportation
equipment and mode multiple times.
• Type of Service Used
− Pick up
− Linehaul
− Delivery
305
©2021 Cengage Learning. All Rights Reserved. May not be scanned, copied or duplicated, or posted to a publicly accessible website, in whole or in part.
Transportation Planning &
Strategy
306
©2021 Cengage Learning. All Rights Reserved. May not be scanned, copied or duplicated, or posted to a publicly accessible website, in whole or in part.
Transportation Planning and Strategy
Framework of Transportation Management Planning Activities
Source
Figure
11.3:
Brian
J.
Gibson,
Ph.D.
Used
with
permission.
307
©2021 Cengage Learning. All Rights Reserved. May not be scanned, copied or duplicated, or posted to a publicly accessible website, in whole or in part.
Transportation Planning and Strategy
Functional Control of Transportation
In most organizations, responsibility for transportation decisions falls to one or
more of the following departments: logistics, procurement, and marketing.
• Inbound
− Inbound transportation typically controlled by the purchasing department
• Outbound
− Outbound transportation typically controlled by marketing or logistics
Often, this decision-making structure leads to missed opportunities to
generate transportation efficiencies and service improvements.
308
©2021 Cengage Learning. All Rights Reserved. May not be scanned, copied or duplicated, or posted to a publicly accessible website, in whole or in part.
Transportation Planning and Strategy (1 of 2)
Terms of Sale: Freight Control & Payment Terms
Terms of sale clarify the delivery and payment terms agreed upon by a seller and buyer. Wise selection of
these terms is critical as the decision determines where the buyer’s responsibilities begin and where the
seller’s responsibilities end.
FOB TERM AND
FREIGHT
PAYMENT
RESPONSIBILITY
WHO OWNS
GOODS IN
TRANSIT?
WHO
HANDLES
FREIGHT
CLAIMS?
WHO
SELECTS AND
PAYS
CARRIER?
WHO
ULTIMATELY
BEARS
FREIGHT
COSTS?
BEST USED
WHEN
_____ HAS
GREATER
INFLUENC
E WITH
CARRIER
FOB Origin,
Freight Collect
Buyer Buyer Buyer Buyer Buyer
FOB Origin,
Freight Prepaid
Buyer Buyer Seller Seller Seller
Source
Table
11.4:
Adapted
from
DSI
Freight
Shipping,
FOB
Definition.:
Shipping
Terms
of
Sale.
(Updated
January
21,
2013).
Retrieved
July
2,
2019
from
https://www.dsi-tms.com/hs-fs/hub/1987/file-18496826-
pdf/docs/fob_definition.pdf
309
©2021 Cengage Learning. All Rights Reserved. May not be scanned, copied or duplicated, or posted to a publicly accessible website, in whole or in part.
Transportation Planning and Strategy (2 of 2)
Terms of Sale: Freight Control & Payment Terms
FOB Origin,
Freight Prepaid &
Charged Back
Buyer Buyer Seller
Buyer. The
seller adds
freight costs to
goods invoice.
Seller
FOB Destination,
Freight Prepaid Seller Seller Seller Seller Seller
FOB Destination,
Freight Collect Seller Seller Buyer Buyer Buyer
FOB Destination,
Freight Collect &
Allowed
Seller Seller Buyer
Seller. The
buyer deducts
freight cost from
goods payment.
Buyer
Source
Table
11.4:
Adapted
from
DSI
Freight
Shipping,
FOB
Definition.:
Shipping
Terms
of
Sale.
(Updated
January
21,
2013).
Retrieved
July
2,
2019
from
https://www.dsi-tms.com/hs-fs/hub/1987/file-18496826-
pdf/docs/fob_definition.pdf
310
©2021 Cengage Learning. All Rights Reserved. May not be scanned, copied or duplicated, or posted to a publicly accessible website, in whole or in part.
Transportation Planning and Strategy
Terms of Sale: Incoterms 2010
Source
Figure
11.4:
Johnatas
Montezuma,
Incoterms
2010.
Retrieved
July
9,
2019
from
https://internationalcommercialterms.guru/
311
©2021 Cengage Learning. All Rights Reserved. May not be scanned, copied or duplicated, or posted to a publicly accessible website, in whole or in part.
Transportation Planning and Strategy
Decision to Outsource Transportation
The organization with FOB freight control and procurement responsibility must analyze and choose between
using a private fleet (the “make” option) and using external service providers to move freight (the “buy” option).
Private Fleet
• Account for nearly half of all U.S. freight transportation spending & more than half of miles traveled.
• A well-run private fleet can operate at costs competitive with for-hire carriers while providing greater
scheduling flexibility and control over transit time.
• Intangible benefits: Promotional impact and prestige of having highly visible company trucks on the road
External Service Providers
• For-hire carriers. Using for-hire carriers avoids large capital cost of starting a private fleet, time needed to
build transportation expertise, and challenges inherent in operating a private fleet.
• 3PLs. Provide a wide array of transportation services: (1) dedicated contract carriage, (2) traffic
management, (3) specialized international freight 3PLs, notably International Freight Forwarders (IFF),
Non Vessel-owning Common Carriers (NVOCC), and Customs Brokers
312
©2021 Cengage Learning. All Rights Reserved. May not be scanned, copied or duplicated, or posted to a publicly accessible website, in whole or in part.
Transportation Planning and Strategy (1 of 2)
Modal Selection: Capabilities, Product Characteristics & Pricing
MODE STRENGTHS LIMITATIONS PRIMARY
ROLE
PRIMARY PRODUCT
CHARACTERISTICS
EXAMPLE
PRODUCTS
Truck
• Accessible
• Fast and
versatile
• Customer
service
• Limited
capacity
• High cost
• Move smaller
shipments in
local,
regional, and
national
markets
• High value
• Finished goods
• Low volume
• Food
• Clothing
• Electronics
• Furniture
Rail
• High capacity
• Low cost
• Accessibility
• Inconsistent
service
• Damage rates
• Move large
shipments of
domestic
freight long
distances
• Low value
• Raw materials
• High volume
• Coal/coke
• Lumber/paper
• Grain
• Chemicals
Source
Table
11.5:
Brian
J.
Gibson,
Ph.D.
Used
with
permission.
313
©2021 Cengage Learning. All Rights Reserved. May not be scanned, copied or duplicated, or posted to a publicly accessible website, in whole or in part.
Transportation Planning and Strategy (2 of 2)
Modal Selection: Capabilities, Product Characteristics & Pricing
Air
• Speed
• Freight
protection
• Flexibility
• Accessibility
• High cost
• Low capacity
• Move urgent
shipments of
domestic freight and
smaller shipments of
international freight
• High value
• Finished goods
• Low volume
• Time sensitive
• Computers
• Periodicals
• Pharmaceuticals
• E-commerce
deliveries
Water
• High capacity
• Low cost
• International
capabilities
• Slow
• Accessibility
• Move large
domestic shipments
via rivers and
canals
• Move large
shipments of
international freight
via oceans
• Low value
• Raw materials
• Bulk
commodities
• Containerized
finished goods
• Crude oil
• Ores/minerals
• Farm products
• Clothing
• Electronics
• Toys
Pipeline
• In-transit
storage
• Efficiency
• Low cost
• Slow
• Limited
network
• Move large volumes
of domestic freight
long distances
• Low value
• Liquid
commodities
• Not time
sensitive
• Crude oil
• Petroleum
• Gasoline
• Natural gas
Source
Table
11.5:
Brian
J.
Gibson,
Ph.D.
Used
with
permission.
314
©2021 Cengage Learning. All Rights Reserved. May not be scanned, copied or duplicated, or posted to a publicly accessible website, in whole or in part.
Transportation Planning and Strategy
Modal Selection: Performance Ratings of Modes
Mode of Transportation
CRITERIA TRUCK AIR RAIL WATER PIPELINE
Accessibility* 1 3 2 4 5
Transit time* 2 1 3 4 5
Reliability* 2 3 4 5 1
Security* 3 2 4 5 1
Cost** 4 5 3 2 1
Accessibility* 1 3 2 4 5
Source Figure 11.6: Edward J. Bardi, Ph.D. Used with permission.
*1 = Best to 5 = Worst
**1 = Lowest cost to 5 = Highest cost
315
©2021 Cengage Learning. All Rights Reserved. May not be scanned, copied or duplicated, or posted to a publicly accessible website, in whole or in part.
Transportation Planning and Strategy (1 of 2)
Carrier Selection
Modal Selection vs. Carrier Selection
• Number of options available
− Modal selection: more options
− Carrier selection: fewer options
• Frequency of the decision
− Modal selection: more long range
− Carrier selection: more active & frequent
Carrier Selection Factors
• Geographic coverage
• Transit time average and
reliability
• Freight rates
• Equipment availability and
capacity
• Product protection
316
©2021 Cengage Learning. All Rights Reserved. May not be scanned, copied or duplicated, or posted to a publicly accessible website, in whole or in part.
Transportation Planning and Strategy (2 of 2)
Carrier Selection
• Core carrier strategy. Carrier selection strategy commonly focuses on
concentrating the transportation buy with a limited number of quality carriers,
while striving to a carrier-friendly “shipper of choice.”
• Advantages
− Helps the organization leverage its purchasing dollars for lower overall rates.
− Allows the company to focus its attention on other supply chain issues.
− Promotes strong relationships with the carriers that produce mutual understanding
of requirements, coordination of processes, and service improvement.
− Give a company priority access to the carriers’ limited capacity.
317
©2021 Cengage Learning. All Rights Reserved. May not be scanned, copied or duplicated, or posted to a publicly accessible website, in whole or in part.
Transportation Planning and Strategy
Rate Negotiations
BUYERS
Key negotiation issues: Equipment
availability, freight rates, and
service levels
CARRIERS
Key negotiation issues: Volume
commitments, shipment frequencies,
origin–destination combinations, freight
characteristics, and related cost issues
NEGOTIATION APPROACHES
Adversarial Approach
Seeks to minimize transportation cost regardless of the impact on carrier financial
performance or long-term viability.
Collaborative Approach
Focuses on developing contracts with carriers for a tailored set of transportation services
at rates that fairly compensate the carriers.
318
©2021 Cengage Learning. All Rights Reserved. May not be scanned, copied or duplicated, or posted to a publicly accessible website, in whole or in part.
Transportation
Execution & Control
319
©2021 Cengage Learning. All Rights Reserved. May not be scanned, copied or duplicated, or posted to a publicly accessible website, in whole or in part.
Transportation Execution and Control
• Shipment Preparation
• Freight Documentation
• Maintain In-Transit Visibility
• Transportation Metrics
• Monitor Service Quality
320
©2021 Cengage Learning. All Rights Reserved. May not be scanned, copied or duplicated, or posted to a publicly accessible website, in whole or in part.
Transportation Execution and Control
Freight Documentation
Source
Figure
11.5:
Brian
J.
Gibson,
Ph.D.
Used
with
permission.
321
©2021 Cengage Learning. All Rights Reserved. May not be scanned, copied or duplicated, or posted to a publicly accessible website, in whole or in part.
Transportation Execution and Control
Common Transportation Metrics
METRIC FORMULA TYPICAL TARGET
On-time Delivery Total on-time deliveries / Total deliveries > 95%
Transit Time Average Sum of transit times / Total deliveries Low variation around goal
Damage Rate Total units damaged / Total units shipped < 1%
Shortage Rate Total units lost or stolen / Total units shipped < 1%
Billing accuracy Total accurate freight bills / Total freight bills > 99%
Perfect Delivery Index On-Time % × Damage-Free % × Billing Accuracy % > 95%
Source Table 11.7: Brian J. Gibson, Ph.D. Used with permission.
322
©2021 Cengage Learning. All Rights Reserved. May not be scanned, copied or duplicated, or posted to a publicly accessible website, in whole or in part.
Transportation Execution and Control
Performance Scorecard
PERFORMANCE
CRITERIA
WEIGHT
FACTOR
PERFORMANCE
EVALUATION
PERFORMANCE
EVALUATION
POTENTIAL
SCORE
CRITERIA
SCORE
On-time
delivery
8
>98% = 5
96.01−98% = 4
94.01−96% = 3
92.01−94% = 2
<92% = 0 40
Loss and
damage rate 5
<0.5% = 5
0.5−1% = 4
1–1.5% = 3
1.5−2% = 2
>2% = 0 25
Billing accuracy 3
>99% = 5
97−99% = 3
95−96% = 1
<95% = 0
15
Equipment
condition
2
Safe & clean = 5
Poor condition = 0
10
Customer
service
2
Superior = 5
Good = 4
Average = 3
Fair = 2
Unacceptable = 0
10
Total Score 100
Source
Table
11.8:
Brian
J.
Gibson,
Ph.D.
Used
with
permission.
323
©2021 Cengage Learning. All Rights Reserved. May not be scanned, copied or duplicated, or posted to a publicly accessible website, in whole or in part.
Transportation Technology
324
©2021 Cengage Learning. All Rights Reserved. May not be scanned, copied or duplicated, or posted to a publicly accessible website, in whole or in part.
Transportation Technology
Buyers and Carriers
Transportation buyers and managers leverage a variety of tools and technologies to support supply
chain success. The carrier community relies on technology to coordinate the flow of customer freight.
Buyers
• Individual applications e.g. load planning optimization, freight rating, and load tendering
• Integrated supply chain tools e.g. global trade management software, and transportation
management systems (TMS)
Carriers
• Routing and load planning tools promoting optimization of pickup, linehaul, and delivery
• Dispatching software facilitating management of drivers, in-transit visibility, & regulatory
compliance.
• Brokerage solutions helping to match loads with available capacity and transaction financial
manage
• Tracking and communication technology supporting visibility and control of freight
• Others e.g. pricing strategy, documentation
325
©2021 Cengage Learning. All Rights Reserved. May not be scanned, copied or duplicated, or posted to a publicly accessible website, in whole or in part.
Transportation Technology
Transportation Management System (TMS)
1. Order ready to ship
2. Enter order info into cerasis rater
3. Integrate for order info automation
4. Hold freight services auction &
choose the best carrier
5. Generate a bill of lading
6. Electronically request a shipment
pickup
7. Automatically notify all parties
8. Electronically exchange shipping
documents
9. Robust reporting and analytics
10.Shipments will be automatically
allocated to carriers
326
©2021 Cengage Learning. All Rights Reserved. May not be scanned, copied or duplicated, or posted to a publicly accessible website, in whole or in part.
Summary
• Four Transportation is the largest logistics cost in most supply chains that directly
impacts fulfillment speed and service quality.
• Fulfillment of supply chain demand can be accomplished through five modal
options or the intermodal use of these options.
• Most commercial freight moves under contractual rates that are negotiated
directly between freight buyers and transportation companies.
• Organizations must continue to manage freight after it has been tendered to
carriers by maintaining in-transit visibility of shipments and monitoring carrier
performance.
• Transportation management systems and related tools are widely
used to support effective planning, execution, and analysis of
transportation processes.
327
©2021 Cengage Learning. All Rights Reserved. May not be scanned, copied or duplicated, or posted to a publicly accessible website, in whole or in part.
Supply Chain
Management,
11e
Chapter 12: Aligning Supply Chains
©2021 Cengage Learning. All Rights Reserved. May not be scanned, copied or duplicated, or posted to a publicly accessible website, in whole or in part.
328
©2021 Cengage Learning. All Rights Reserved. May not be scanned, copied or duplicated, or posted to a publicly accessible website, in whole or in part.
Discussion Outline
• Types of supply chain relationships
• Model for developing and implementing successful supply chain
relationships
• Imperative for collaborative relationships
• The third-party logistics (3PL) industry
329
©2021 Cengage Learning. All Rights Reserved. May not be scanned, copied or duplicated, or posted to a publicly accessible website, in whole or in part.
Alignment in Supply Chain Management
• Supply chain & Organizational strategies
• Supply chain & Trading partners
• Supply & Demand
330
©2021 Cengage Learning. All Rights Reserved. May not be scanned, copied or duplicated, or posted to a publicly accessible website, in whole or in part.
Range of Relationship Types
Source
Figure
12.1:
Copyright,
C.
John
Langley
Jr.,
Ph.D.
Used
with
permission.
331
©2021 Cengage Learning. All Rights Reserved. May not be scanned, copied or duplicated, or posted to a publicly accessible website, in whole or in part.
Model for Developing and
Implementing Successful
Supply Chain Relationships
332
©2021 Cengage Learning. All Rights Reserved. May not be scanned, copied or duplicated, or posted to a publicly accessible website, in whole or in part.
Process Model for Forming Logistics
Relationships
Source
Figure
12.2:
Copyright,
C.
John
Langley
Jr.,
Ph.D.
Used
with
permission.
333
©2021 Cengage Learning. All Rights Reserved. May not be scanned, copied or duplicated, or posted to a publicly accessible website, in whole or in part.
Model for Successful Supply Chain Relationships
Steps 1–3
Step 1: Perform Strategic Assessment
• Involves the conduct of a logistics audit, which provides a perspective on the firm’s logistics and
supply chain needs and a wide range of useful information.
Step 2: Decision to Form Relationship
• Decision involving external logistics service provider focuses on whether or not to have a
relationship (core competency assessment)
• Decision involving channel partners focuses on type of relationship that works best.
Step 3: Evaluate Alternatives
• Thorough assessment of the company’s needs and priorities in comparison with the capabilities
of each potential partner.
• A broad representation and involvement of people throughout the company
334
©2021 Cengage Learning. All Rights Reserved. May not be scanned, copied or duplicated, or posted to a publicly accessible website, in whole or in part.
Model for Successful Supply Chain Relationships
Step 2: Decision to Form Relationship (1 of 2)
Core competency assessment is key in relationship decision
that involves an external provider of logistics services.
Source
Figure
12.3:
Copyright,
C.
John
Langley
Jr.,
Ph.D.
Used
with
permission.
335
©2021 Cengage Learning. All Rights Reserved. May not be scanned, copied or duplicated, or posted to a publicly accessible website, in whole or in part.
Model for Successful Supply Chain Relationships
Step 2: Decision to Form Relationship (2 of 2)
“Drivers” and “facilitators” are identified in relationship decision that involves
channel partners.
Drivers: Compelling reasons to partner
− Asset/cost efficiency; customer service; marketing
advantage; profit stability/growth
Facilitators: Supportive corporate environmental
factors that enhance partnership growth &
development
− Corporate compatibility; management philosophy; mutuality
of commitment; symmetry on key factors (e.g. size)
• Neither drivers nor
facilitators present:
More transactional, or
“arm’s length”
• Common drivers with
facilitating factors:
More structured, formal
relationship
336
©2021 Cengage Learning. All Rights Reserved. May not be scanned, copied or duplicated, or posted to a publicly accessible website, in whole or in part.
Model for Successful Supply Chain Relationships
Steps 4–6
Step 4: Select Partner(s)
• Select a logistics or supply chain partner only after very close consideration of the credentials of the most
likely candidates.
• Ensure that everyone involved has a consistent understanding of the decision made.
Step 5: Structure Operating Model
• The activities, processes, and priorities that will be used to build and sustain the relationship. Examples of
components are:
− Planning
− Communication
− Risk/reward sharing
− Contract style
− Financial investment
Step 6: Implementation & Continuous Improvement
• Depending on the complexity of the new relationship, the overall implementation process may be relatively
short, or it may be extended over a longer period of time.
337
©2021 Cengage Learning. All Rights Reserved. May not be scanned, copied or duplicated, or posted to a publicly accessible website, in whole or in part.
Model for Successful Supply Chain Relationships
Step 6: Implementation & Continuous Improvement
Future success of relationship is a direct function of the ability of involved
organizations to achieve both continuous & breakthrough improvement.
Source
Figure
12.4:
Adapted
from
Ray
A.
Mundy,
C.
John
Langley
Jr.,
and
Brian
J.
Gibson,
Continuous
Improvement
in
Third
Party
Logistics,
2001.
338
©2021 Cengage Learning. All Rights Reserved. May not be scanned, copied or duplicated, or posted to a publicly accessible website, in whole or in part.
Imperative for Collaborative
Relationships
339
©2021 Cengage Learning. All Rights Reserved. May not be scanned, copied or duplicated, or posted to a publicly accessible website, in whole or in part.
Imperative for Collaborative Relationships
Elements of Successful Collaboration
1. Well-understood goals and objectives
2. Trust and commitment
3. Organizational compatibility and communication
4. Equitable sharing of gains and losses
5. Benefits greater than going it alone
6. Dedication to continuous improvement
7. Strategic plan to provide direction to the collaboration
340
©2021 Cengage Learning. All Rights Reserved. May not be scanned, copied or duplicated, or posted to a publicly accessible website, in whole or in part.
Imperative for Collaborative Relationships
Barriers and Benefits
Benefits
• Focus on core competencies of supply
chain organizations
• Increased sharing of information and
knowledge
• Greater responsiveness to customers’
needs
• Creation of competitive advantage over
competing supply chains
• More productive and satisfying relationships
Barriers
• Resistance to change
• Conflicting business objectives
• Inconsistent goals and key
performance indicators
• Lack of trust
• Unwillingness to share
information
• Lack of managerial support
• Turf protection
341
©2021 Cengage Learning. All Rights Reserved. May not be scanned, copied or duplicated, or posted to a publicly accessible website, in whole or in part.
Seven Immutable Laws of Collaborative Logistics
1. Real and recognized benefits to all members
2. Dynamic creation, measurement, and evolution of collaborative relationships
3. Co-buyer and co-seller relationships
4. Flexibility and security
5. Collaboration across all stages of business process integration
6. Open integration with other services
7. Collaboration across essential logistics flows
342
©2021 Cengage Learning. All Rights Reserved. May not be scanned, copied or duplicated, or posted to a publicly accessible website, in whole or in part.
Imperative for Collaborative Relationships
Three Important Types of Collaboration
Source
Figure
12.5:
Copyright,
C.
John
Langley
Jr.,
Ph.D.
Used
with
permission.
343
©2021 Cengage Learning. All Rights Reserved. May not be scanned, copied or duplicated, or posted to a publicly accessible website, in whole or in part.
The Third-Party
Logistics (3PL) Industry
344
©2021 Cengage Learning. All Rights Reserved. May not be scanned, copied or duplicated, or posted to a publicly accessible website, in whole or in part.
Third-Party Logistics: Industry Overview
“A third-party logistics firm may be defined as an external supplier that performs or
manages the performance of all or part of a company’s logistics functions.”
Participants who are involved in the buying and selling of outsourced logistics services range
from 1PL’s to 5PL’s:
• 1PL – Shippers or receivers of product moved through supply chain.
• 2PL – Asset-based logistics providers that physically move product through the supply chain
(transport carriers of various modes).
• 3PL – Firms that manage and/or provide logistics services on behalf of their clients and
customers. Most of these organizations are non-asset based.
• 4PL – Firms that provide broader scope of services to help manage elements of the supply
chain, and typically may be more strategically involved than 3PLs would be.
• 5PL – Companies that aggregate demands of 3PLs into bulk volumes to negotiate better rates
with logistics service providers.
345
©2021 Cengage Learning. All Rights Reserved. May not be scanned, copied or duplicated, or posted to a publicly accessible website, in whole or in part.
Third-Party Logistics
Evolution of Logistics Outsourcing
Source
Figure
12.6:
Copyright,
C.
John
Langley
Jr.,
Ph.D.
Used
with
permission.
346
©2021 Cengage Learning. All Rights Reserved. May not be scanned, copied or duplicated, or posted to a publicly accessible website, in whole or in part.
Third-Party Logistics (1 of 2)
Types of 3PL Providers
Transportation-based
• 3PL providers founded as a subsidiary or major division of a large transportation firm.
• Examples: FedEx Supply Chain, UPS Supply Chain Solutions, DHL, Ryder Supply Chain
Solutions, Schneider Logistics, Penske Logistics, and XPO Logistics.
Contract Logistics-based
• Generally referring to services relating to warehousing and distribution.
• Examples: CEVA Logistics, DSC Logistics, Exel/DHL, Geodis, Penske Logistics, Saddle Creek
Corporation.
Freight Forwarding-based
• Organizations performing services for the daily flow of global commerce, purchasing shipping
capacity from asset-based providers, then re-selling to supply chain customers.
• Examples: C.H. Robinson, DHL, DSV, Expeditors, Hub Group, and Kuehne & Nagel.
347
©2021 Cengage Learning. All Rights Reserved. May not be scanned, copied or duplicated, or posted to a publicly accessible website, in whole or in part.
Third-Party Logistics (2 of 2)
Types of 3PL Providers
Financial-based
• Firms providing services such as freight payment and auditing, cost accounting and control, tools for
managing shipment visibility, information, and tracking, and consulting and advisory services.
• Examples: Tranzact Technologies, CTSI, and Cass Information Systems.
Information-based
• A newer, innovative type of third-party provider emerged as a result of growth and development of Internet-
based, business-to-business, electronic markets for transportation and logistics services.
• Example: Transplace, Inc.
Corporate Subsidiaries-based
• 3PL organizations that initially were divisions or subsidiaries of manufacturing or distributor organizations.
• Examples: Neovia, Inc. (formerly Caterpillar Logistics), IBM Global Business Services, Odyssey Logistics.
348
©2021 Cengage Learning. All Rights Reserved. May not be scanned, copied or duplicated, or posted to a publicly accessible website, in whole or in part.
Third-Party Logistics
Logistics Outsourcing Activities
Source
Figure
12.7:
Langley,
C.
John
Jr.,
and
Infosys,
2020
24th
Annual
3PL
Study.
349
©2021 Cengage Learning. All Rights Reserved. May not be scanned, copied or duplicated, or posted to a publicly accessible website, in whole or in part.
Third-Party Logistics
Important 3PL IT Capabilities
Shippers
• Transportation management (planning)
• Warehouse/DC management
• Visibility (order, shipment, inventory, etc.)
• Electronic Data Interchange (EDI)
• Transportation management
(scheduling)
• Transportation sourcing
Providers
• Transportation management
(planning)
• Visibility (order, shipment,
inventory, etc.)
• Transportation management
(scheduling)
• Electronic Data Interchange (EDI)
• Warehouse/DC management
• Customer relationship
management (CRM)
350
©2021 Cengage Learning. All Rights Reserved. May not be scanned, copied or duplicated, or posted to a publicly accessible website, in whole or in part.
Third-Party Logistics: IT Gap
Source
Figure
12.8:
Langley,
C.
John
Jr.,
and
Infosys,
2020
24th
Annual
3PL
Study.
351
©2021 Cengage Learning. All Rights Reserved. May not be scanned, copied or duplicated, or posted to a publicly accessible website, in whole or in part.
Third-Party Logistics
Management and Relationship Issues
Customers’ Expectations of 3PL
Providers
• Superior service and execution (proven
results and performance)
• Trust, openness, and information sharing
• Solution innovation and relationship
reinvention
• Capable information technologies to
support the relationship
• Ongoing executive level support
• Service offering aligned with customer
strategy and deep industry knowledge
3PL Providers’ Expectations of
Customers
• Mutually beneficial, long-term relationship
with company
• Trust, openness, and information sharing
• Dedicating the right resources at the right
levels, including executives
• Access to useful data to design solutions
and provide desired services to customers
• Clearly defined service level agreements
• Fiduciary responsibility and overall
fairness relative to pricing
352
©2021 Cengage Learning. All Rights Reserved. May not be scanned, copied or duplicated, or posted to a publicly accessible website, in whole or in part.
Third-Party Logistics: Future 3PL
Industry Trends
1. Continued expansion, acquisition and consolidation of 3PL industry
2. Expansion of global markets and needed services
3. Broadening of service offerings across supply chain, and business process outsourcing
4. Increased efforts to update, enhance, and improve 3PL-customer relationships
5. Growing range of “strategic” services offered by 3PLs and 4PLs
6. Innovation and transformation to meet needs of e-Commerce businesses
7. IT capabilities to become an even greater differentiator
8. Increased adoption of shared service networks and sometimes collaborative initiatives with traditional
competitors
9. Emphasis on relationship reinvention, mechanisms for continual improvement, and solution innovation
353
©2021 Cengage Learning. All Rights Reserved. May not be scanned, copied or duplicated, or posted to a publicly accessible website, in whole or in part.
Summary
• Inter-firm relationships may span from transactional to relational and may take
the form of vendor, partner, and strategic alliances.
• Collaborative relationships have been identified as highly useful to the
achievement of long-term supply chain objectives.
• Third-party logistics providers are “external suppliers that perform all or part of a
company’s logistics functions.”
• 3PLs may be thought of as transportation-based, warehouse/distribution-based,
forwarder-based, financial-based, and information-based.
• The most prevalent 3PL services used are transportation, warehousing,
customs clearance and brokerage, and forwarding.
354
©2021 Cengage Learning. All Rights Reserved. May not be scanned, copied or duplicated, or posted to a publicly accessible website, in whole or in part.
Supply Chain
Management,
11e
Chapter 13: Supply Chain Performance
Measurement and Financial Analysis
©2021 Cengage Learning. All Rights Reserved. May not be scanned, copied or duplicated, or posted to a publicly accessible website, in whole or in part.
355
©2021 Cengage Learning. All Rights Reserved. May not be scanned, copied or duplicated, or posted to a publicly accessible website, in whole or in part.
Discussion Outline
• Characteristics of good performance measures
• Performance categories
• The supply chain–finance connection
• Financial implications of supply chain strategies
• Financial implications of supply chain services
356
©2021 Cengage Learning. All Rights Reserved. May not be scanned, copied or duplicated, or posted to a publicly accessible website, in whole or in part.
Measure vs. Metric vs. Index
Index
• Combines two or more metrics into a single indicator, usually used to track trends in the output
of a process.
• Logistics example: Perfect order
Metric
• Involves a calculation or a combination of measurements, often in the form of a ratio.
• Logistics examples : Inventory future days of supply, Inventory turns, Sales dollars per stock-
keeping unit
Measure
• Requires no calculations and with simple dimensions.
• Logistics examples: Units of inventory, Backorder dollars
357
©2021 Cengage Learning. All Rights Reserved. May not be scanned, copied or duplicated, or posted to a publicly accessible website, in whole or in part.
Characteristics of Good Performance Measures
1. Is quantitative
2. Is easy to understand
3. Encourages appropriate behavior
4. Is visible
5. Is defined & mutually understood
6. Encompasses outputs & inputs
7. Measures only what is important
8. Is multidimensional
9. Uses economies of effort
10. Facilitates trust
358
©2021 Cengage Learning. All Rights Reserved. May not be scanned, copied or duplicated, or posted to a publicly accessible website, in whole or in part.
Characteristics of Good Performance Measures
Raising the Performance Bar
Source
Figure
13.3:
J.
S.
Keebler,
D.
A.
Durtsche,
K.
B.
Manrodt,
and
D.
M.
Ledyard,
Keeping
Score:
Measuring
the
Business
Value
of
Logistics
in
the
Supply
Chain
(University
of
Tennessee,
Council
of
Logistics
Management,
1999).
Reproduced
by
permission
from
Council
of
Supply
Chain
Management
Professionals.
359
©2021 Cengage Learning. All Rights Reserved. May not be scanned, copied or duplicated, or posted to a publicly accessible website, in whole or in part.
Successful Development of a Supply Chain
Metrics Program
• Is a result of a team effort.
• Involves customers and suppliers (where appropriate).
• Develops a tiered structure.
• Identifies metric “owners” and ties metric goal achievement to an individual’s or
division’s performance evaluation.
• Establishes a procedure to mitigate conflicts.
• Is consistent with corporate strategy.
• Establishes top management support.
360
©2021 Cengage Learning. All Rights Reserved. May not be scanned, copied or duplicated, or posted to a publicly accessible website, in whole or in part.
Performance Categories
Process Measure Categories
SCOR Level-1 Metrics
Logistics Quantification Pyramid
361
©2021 Cengage Learning. All Rights Reserved. May not be scanned, copied or duplicated, or posted to a publicly accessible website, in whole or in part.
Performance Categories Process Measure Categories
Time
• On-time
delivery/receipt
• Order cycle
time
• Order cycle
time variability
• Response time
• Forecasting/
Planning cycle
time
Quality
• Overall customer
satisfaction
• Processing accuracy
• Perfect order
fulfillment
• On-time delivery
• Complete order
• Accurate product
selection
• Damage-free
• Accurate invoice
• Forecast accuracy
• Planning accuracy:
Budgets and
operating plans
• Schedule adherence
Cost
• Finished goods
inventory turns
• Days sales outstanding
• Cost to serve
• Cash-to-cash cycle time
• Total delivered cost
− Cost of goods
− Transportation costs
− Inventory carrying
costs
− Material handling
costs
• All other costs
• Info systems
• Administrative
• Cost of excess capacity
• Cost of capacity shortfall
Other/Supporting
• Approval exceptions to
standard
• Minimum order quantity
• Change order timing
• Availability of information
Source Figure 13.4: J. S. Keebler, D. A. Durtsche, K.
B. Manrodt, and D. M. Ledyard, Keeping Score:
Measuring the Business Value of Logistics in the
Supply Chain (University of Tennessee, Council of
Logistics Management, 1999). Reproduced by
permission from Council of Supply Chain
Management.
362
©2021 Cengage Learning. All Rights Reserved. May not be scanned, copied or duplicated, or posted to a publicly accessible website, in whole or in part.
Performance Categories
SCOR Level-1 Metrics (1 of 2)
Attribute Performance Attribute Definition Level 1 Metric
Supply Chain
Reliability
The performance of the supply chain in delivering:
the correct product, to the correct place and
customer, at the correct time, in the correct
condition and packaging, and with the correct
quantity and documentation
• Delivery Performance
• Fill Rates
• Product Order Fulfillment
Supply Chain
Responsiveness
The velocity at which a supply chain provides
products to the customer
• Order Fulfillment Lead Times
Supply Chain
Flexibility
The agility of a supply chain in responding to
marketplace changes to gain or maintain
competitive advantage.
• Supply Chain Response Time
• Production Flexibility
Source Figure 13-5: Adapted from Supply Chain Council (2015). Reproduced by permission.
363
©2021 Cengage Learning. All Rights Reserved. May not be scanned, copied or duplicated, or posted to a publicly accessible website, in whole or in part.
Performance Categories
SCOR Level-1 Metrics (2 of 2)
Attribute Performance Attribute Definition Level 1 Metric
Supply Chain
Costs
The costs associated with operating the supply
chain.
• Cost of Goods Sold
• Total Supply Chain
Management Costs
• Value-Added Productivity
• Warranty / Returns Processing
Costs
Supply Chain
Asset
Management
Efficiency
The effectiveness of an organization in managing
assets to support demand satisfaction. This
includes the management of all assets: fixed and
working capital.
• Cash-to-Cash Cycle Time
• Inventory Days of Supply
• Asset Turn
Source Figure 13-5: Adapted from Supply Chain Council (2015). Reproduced by permission.
364
©2021 Cengage Learning. All Rights Reserved. May not be scanned, copied or duplicated, or posted to a publicly accessible website, in whole or in part.
Performance Categories
SCOR Process D1 Metrics
Process Category: Deliver Stocked Product
Process Number: D1
Performance Attributes Metric
Reliability • Perfect order fulfillment
Responsiveness • Order fulfillment cycle time
Agility
• Upside Supply Chain Flexibility
• Upside Supply Chain Adaptability
• Downside Supply Chain Adaptability
• Overall Value at Risk
Costs • Total cost to serve
Asset Management
• Cash-to-Cash Cycle Time
• Return on Supply Chain Fixed Assets
• Return on Working Capital
Source
Figure
13.6:
Adapted
from
Supply
Chain
Council
(2015).
Reproduced
by
permission.
365
©2021 Cengage Learning. All Rights Reserved. May not be scanned, copied or duplicated, or posted to a publicly accessible website, in whole or in part.
Performance Categories
Logistics Quantification Pyramid
1. Looks at how logistics cost and service
are perceived by channel members.
2. Focuses on how a seller’s cost
influences a customer’s profit and on
how a seller’s service impacts a
customer’s revenue.
3. Example: Transportation cost tradeoffs
between less expensive (slower & less
reliable) and more expensive (faster &
more reliable) transportation.
4.  Product availability
 Order cycle time
 Logistics operations responsiveness
 Logistics system information
 Post-sale logistics support
Source
Figure
13.7:
R.
A.
Novack,
Center
for
Supply
Chain
Research,
Penn
State
University
(2015).
366
©2021 Cengage Learning. All Rights Reserved. May not be scanned, copied or duplicated, or posted to a publicly accessible website, in whole or in part.
The Supply Chain–Finance
Connection
Revenue–Cost Savings Connection
Supply Chain Impact on ROA
367
©2021 Cengage Learning. All Rights Reserved. May not be scanned, copied or duplicated, or posted to a publicly accessible website, in whole or in part.
The Supply Chain–Finance Connection
The cost of providing logistics service not only affects the marketability of the
product (via the landed cost, or price), but also impacts its profitability.
Inventory management & capital
• Logistics techniques such as just-in-time and vendor-managed inventories
reduce inventory levels and capital required.
Lead times & inventory cost and customer service
• Consistent and short lead times helps inventories and can build customer
satisfaction and loyalty.
Order processing time & order-to-cash cycle
• Order processing time has a direct bearing on an organization’s order-to-cash
cycle: Longer order-to-cash cycle = higher accounts receivable and higher
investment in “sold” finished goods.
368
©2021 Cengage Learning. All Rights Reserved. May not be scanned, copied or duplicated, or posted to a publicly accessible website, in whole or in part.
The Supply Chain–Finance Connection
Revenue–Cost Savings Connection (1 of 2)
Transform cost reductions into equivalent revenue increases
Profit = Revenue − Costs
Where: Cost = (X%)(Revenue)
Then: Profit = Revenue − (X%)(Revenue)
= Revenue (1 − X%)
Where: (1 − X%) = Profit margin
Sales = Profit/Profit Margin
369
©2021 Cengage Learning. All Rights Reserved. May not be scanned, copied or duplicated, or posted to a publicly accessible website, in whole or in part.
The Supply Chain–Finance Connection
Revenue–Cost Savings Connection (2 of 2)
CLGN Example
CLGN 2020 SALES EQUIVALENT FOR COST SAVINGS OF
(000) Percentage $200,000 $500,000 $1,000,000
Sales $150,000 100.0 $2,857,143* $7,142,857** $14,285,714†
Total cost 139,500 93.0 2,657,143 6,642,857 13,285,714
Net profit 10,500 7.0 200,000 500,000 1,000,000
Source Table 13.1: Edward J. Bardi, Ph.D. Used with permission.
* $200,000 cost saving ÷ 0.07 profit margin
** $500,000 cost saving ÷ 0.07 profit margin
† $1,000,000 cost saving ÷ 0.07 profit margin
370
©2021 Cengage Learning. All Rights Reserved. May not be scanned, copied or duplicated, or posted to a publicly accessible website, in whole or in part.
Financial Implications of Supply Chain Strategies
Supply Chain Impact on ROA
Source
Figure
13.9:
Robert
A.
Novack,
Ph.D.
Used
with
permission.
371
©2021 Cengage Learning. All Rights Reserved. May not be scanned, copied or duplicated, or posted to a publicly accessible website, in whole or in part.
Financial Implications of Supply Chain Strategies
Supply Chain Impact on Balance Sheet
Source
Figure
13.10:
Robert
A.
Novack,
Ph.D.
Used
with
permission.
372
©2021 Cengage Learning. All Rights Reserved. May not be scanned, copied or duplicated, or posted to a publicly accessible website, in whole or in part.
Financial Implications of
Supply Chain Strategies
373
©2021 Cengage Learning. All Rights Reserved. May not be scanned, copied or duplicated, or posted to a publicly accessible website, in whole or in part.
Financial Implications of Supply Chain Strategies
Supply Chain Strategic Areas Affecting ROA
Source
Figure
13.11:
R.
A.
Novack,
Center
for
Supply
Chain
Research,
Penn
State
University
(2015).
374
©2021 Cengage Learning. All Rights Reserved. May not be scanned, copied or duplicated, or posted to a publicly accessible website, in whole or in part.
Financial Implications of Supply Chain Strategies
Supply Chain Decision and ROA (1 of 2)
CLGN Example: Comparison of Supply Chain Alternatives
Ratio Analysis
CLGN, 2020
$(000)
Transport Cost
Reduced 10 %
Warehousing
Cost Reduced
10%
Inventory
Reduced 10 %
Profit margin 7.00% 7.24% 7.06% 7.12%
Return on assets 7.24% 7.49% 7.30% 7.42%
Inventory turns/year 8.00 8.00 8.00 8.89
Transportation as
percentage of sales
4.00% 3.60% 4.00% 4.00%
Warehousing as
percentage of sales
1.00% 1.00% 0.90% 1.00%
Inventory carrying as
percentage of sales
2.00% 2.00% 2.00% 1.80%
Source
Figure
13.17:
Edward
J.
Bardi,
Ph.D.
Used
with
permission.
375
©2021 Cengage Learning. All Rights Reserved. May not be scanned, copied or duplicated, or posted to a publicly accessible website, in whole or in part.
Financial Implications of Supply Chain Strategies
Supply Chain Decision and ROA (2 of 2)
Example: CLGN 2020 and Reduced Transportation Costs
•
Source
Figure
13.18:
Edward
J.
Bardi,
Ph.D.
Used
with
permission.
376
©2021 Cengage Learning. All Rights Reserved. May not be scanned, copied or duplicated, or posted to a publicly accessible website, in whole or in part.
Financial Implications of
Supply Chain Services
377
©2021 Cengage Learning. All Rights Reserved. May not be scanned, copied or duplicated, or posted to a publicly accessible website, in whole or in part.
Financial Implications of Supply Chain Service
Supply Chain Service Failure
Source
Figure
13.19:
Edward
J.
Bardi,
Ph.D.
Used
with
permission.
378
©2021 Cengage Learning. All Rights Reserved. May not be scanned, copied or duplicated, or posted to a publicly accessible website, in whole or in part.
Financial Implications of Supply Chain Service
Supply Chain Service Improvement
Example: Strategic Profit Model & On-Time Delivery Improvement
Source
Figure
13.22:
Edward
J.
Bardi,
Ph.D.
Used
with
permission.
379
©2021 Cengage Learning. All Rights Reserved. May not be scanned, copied or duplicated, or posted to a publicly accessible website, in whole or in part.
Summary
• Successful metric development for logistics and supply chains is consistent with
corporate strategy, focuses on customer needs, carefully selects and prioritizes metrics,
focuses on processes, uses a balanced approach, and uses technology to improve
measurement effectiveness.
• Four principal categories for performance metrics are: time, quality, cost, and
miscellaneous or support; OR: operations cost, service, revenue or value, and channel
satisfaction.
• Supply chain management impacts ROA via decisions regarding channel structure
management, inventory management, order management, and transportation
management.
• Supply chain service failures result in lost sales and rehandling costs. The
financial impact of modifications to supply chain services can be analyzed
using the strategic profit model which shows the relationship of sales,
costs, assets, and equity.
380
©2021 Cengage Learning. All Rights Reserved. May not be scanned, copied or duplicated, or posted to a publicly accessible website, in whole or in part.
Supply Chain
Management,
11e
Chapter 14: Supply Chain Technology:
Managing Information Flows
©2021 Cengage Learning. All Rights Reserved. May not be scanned, copied or duplicated, or posted to a publicly accessible website, in whole or in part.
381
©2021 Cengage Learning. All Rights Reserved. May not be scanned, copied or duplicated, or posted to a publicly accessible website, in whole or in part.
Discussion Outline
• Information requirements
• Systems capabilities
• Supply chain management software
• Technology selection
• Supply chain technology innovations
382
©2021 Cengage Learning. All Rights Reserved. May not be scanned, copied or duplicated, or posted to a publicly accessible website, in whole or in part.
Information Requirements (1 of 2)
Source
Figure
14.1:
Brian
J.
Gibson,
Ph.D.
Used
with
permission.
• Information connects the
extended supply chain, providing
cross-chain insights regarding
demand, customer orders,
delivery status, inventory stock
levels, and production schedules.
• Three principle supply chain
information requirements:
− Meet quality standards
− Support multidirectional flows
− Provide decision support
383
©2021 Cengage Learning. All Rights Reserved. May not be scanned, copied or duplicated, or posted to a publicly accessible website, in whole or in part.
Information Requirements (2 of 2)
Meet Quality
Standards
Seven
information
quality
standards:
• Accuracy
• Accessibility
• Relevancy
• Timeliness
• Transferability
• Usability
• Reliability
Support Multidirectional
Flows
• Internal information
sharing
• External information
sharing
• Suppliers
− Logistics service
providers
− Financial
institutions
− Government
agencies
Provide Decision Support
• Strategic decisions: Long-
range supply chain plans
• Tactical planning: Cross-
organization linkages and
supply chain activity
coordination.
• Routine decisions: Rules-
based decision making.
• Execution and transaction
processing: Completion of
fulfillment activities
384
©2021 Cengage Learning. All Rights Reserved. May not be scanned, copied or duplicated, or posted to a publicly accessible website, in whole or in part.
Systems Capabilities
Enable Process Excellence
Link Network Elements
Mitigate Technology Risks
385
©2021 Cengage Learning. All Rights Reserved. May not be scanned, copied or duplicated, or posted to a publicly accessible website, in whole or in part.
Systems Capabilities
Enable Process Excellence
The system must facilitate excellent performance across the plan, buy,
make, move, and return processes of a supply chain.
1. Cross-chain visibility. Supports process variability reduction, performance optimization, & cost
control.
2. Agility. Support analytics that help to understand volatility and respond appropriately.
3. Velocity. Adjust speeds according to situations.
4. Synchronization. Facilitates data synchronization & real-time information sharing between
partners.
5. Adaptability. Enable strategic adaptation of supply chain design & capabilities to evolving
conditions.
6. Segmentation. Help define customer segments, understand cost to serve & prioritize service
execution.
7. Optimization. Enable consideration of trade-offs, effectively deploy resources, & make decision.
386
©2021 Cengage Learning. All Rights Reserved. May not be scanned, copied or duplicated, or posted to a publicly accessible website, in whole or in part.
Systems Capabilities
Link Network Elements
A cohesive network of integrated technologies, skilled people, and robust
processes must be established.
Source
Figure
14.2:
Brian
J.
Gibson,
Ph.D.
Used
with
permission.
387
©2021 Cengage Learning. All Rights Reserved. May not be scanned, copied or duplicated, or posted to a publicly accessible website, in whole or in part.
Systems Capabilities
Mitigate Technology Risks
Common risks must be identified and mitigated to maximize the return on technology investments.
The pitfalls associated with systems adoption or upgrades
• Unrealistic assumption that supply chain technologies will readily solve or fix flawed supply
chains.
• Weak technology-process alignment, leading to ill-fitting solutions that fail to achieve their
promise
• Technology gaps as a result of piecemeal purchases and deployment of technologies
• Challenges in cross-chain systems integration with suppliers, service providers, and customers
• Poor planning and preparation for technology implementation
388
©2021 Cengage Learning. All Rights Reserved. May not be scanned, copied or duplicated, or posted to a publicly accessible website, in whole or in part.
SCM Software
389
©2021 Cengage Learning. All Rights Reserved. May not be scanned, copied or duplicated, or posted to a publicly accessible website, in whole or in part.
SCM Software
Primary Categories
Source
Figure
14.3:
Brian
J.
Gibson,
Ph.D.
Used
with
permission.
390
©2021 Cengage Learning. All Rights Reserved. May not be scanned, copied or duplicated, or posted to a publicly accessible website, in whole or in part.
SCM Software: Planning Applications
SCM planning applications help organizations shift from autonomous planning activities to
synchronized planning processes that use real-time data for collaboration across departments,
suppliers & customers.
• Available/capable to promise
• Sales and operations planning/integrated
business planning
• Collaborative planning, forecasting, and
replenishment
• Vendor-managed inventory/direct point of sale
• Event planning
• Demand planning
• Inventory planning
• Distribution planning
• Strategic network design
• Inventory strategy optimization
• Supply planning
• Production/multiplant capacity planning
• Production/factory planning and scheduling
Source Table 14.1: Adapted from Gartner IT Glossary. Retrieved from https://www.gartner.com/it-glossary/scp-supply-chain-planning/
391
©2021 Cengage Learning. All Rights Reserved. May not be scanned, copied or duplicated, or posted to a publicly accessible website, in whole or in part.
SCM Software: Execution Applications
Companies deploy a variety of execution software to facilitates desired performance of day-to-day operating
tasks required to support customer demand.
Warehouse Management Systems
• Inventory management
• Labor management
• Order processing
• Yard/dock management
• Returns management
Order Management Systems
• Sales order entry
• Pricing and credit checks
• Inventory allocation
• Invoice generation
Distributed Order Management
• Order assignment
Transportation Management Systems
• Mode and carrier selection
• Route planning and optimization
• Dispatching and scheduling
• Freight audit and payment
• Performance analysis
Global Trade Management
• Trade compliance
• International logistics
• Global order management
• Global trade financial management
Manufacturing Execution Systems
• Work-in-process management
Source Table 14.2: Adapted from Gartner IT Glossary. Retrieved from http://www.gartner.com/it-glossary/ sce-supply-chain-execution/
392
©2021 Cengage Learning. All Rights Reserved. May not be scanned, copied or duplicated, or posted to a publicly accessible website, in whole or in part.
SCM Software: Event Management Tools
Supply chain event management tools collect data in real time from multiple
sources across the network and convert them into information that allows
companies to automate the monitoring of supply chain events as they occur on a
day-to-day basis.
• Provide the cross-chain visibility needed to detect, evaluate, and adapt to
changing conditions before they snowball into major problems.
• Built-in work flow rules initiate automated responses that are either preemptive or
reactive.
• Integrated into other applications, event management solutions help to close the
loop between planning and execution to support synchronization of end-to-end
activities.
393
©2021 Cengage Learning. All Rights Reserved. May not be scanned, copied or duplicated, or posted to a publicly accessible website, in whole or in part.
SCM Software: Analytics & Intelligence Tools
Capabilities
• The data collection & “big data” analytics
• Self-service reporting
• Performance scorecarding versus goals
• Development of graphical dashboards
• Activity monitoring supporting event mgmt.
• Access to data residing on multiple SCIS
Opportunity Areas
• Generating valuable insights about complex global operations
• Providing more granular visibility of spending
• Improving S&OP & demand forecasting
• Resolving logistics bottlenecks
394
©2021 Cengage Learning. All Rights Reserved. May not be scanned, copied or duplicated, or posted to a publicly accessible website, in whole or in part.
SCM Software: Facilitating Tools
Facilitating systems and applications provide critical links between supply chain processes, the
organization, and external stakeholders. Collectively, they create a holistic view of the supply chain.
Enterprise resource planning (ERP) systems
• Incorporate internal and external systems into a single unified solution that spans the enterprise.
Supplier relationship management (SRM)
• A controlled and systematic approach to managing an organization’s sourcing activities for
goods and services.
Customer relationship management (CRM)
• Focuses on practices, strategies & technologies used to manage and analyze customer
interactions & data throughout relationship lifecycle.
Automatic identification (auto-ID) & data capture technologies
• Recognize objects, collect relevant information, and feed the data directly into the SCIS.
395
©2021 Cengage Learning. All Rights Reserved. May not be scanned, copied or duplicated, or posted to a publicly accessible website, in whole or in part.
SCM Technology
Implementation
396
©2021 Cengage Learning. All Rights Reserved. May not be scanned, copied or duplicated, or posted to a publicly accessible website, in whole or in part.
SCM Technology Implementation
Informed Decision Making
1. Need assessment. Understand the supply chain that the technology is
intended to support.
2. Software selection. A multifaceted decision, involving development
alternatives (off the shelves vs. in-house), types of applications (individual
applications vs. integrated suite), and purchase options (on-premise vs.
SaaS)
3. Implementation issues. Training, cultural change, systems
interoperability, data synchronization, data standardization, and application
integration
397
©2021 Cengage Learning. All Rights Reserved. May not be scanned, copied or duplicated, or posted to a publicly accessible website, in whole or in part.
SCM Technology Implementation
Golden Rules for Success
1. Get sponsorship of senior leaders
2. Choose the right technology solutions
3. Select an implementation leader with project management skills
4. Choose the right consultants to support implementation
5. Staff the project team with the best and brightest people
6. Manage “scope creep” to avoid implementation delays
7. Secure adequate resources for training and post-go-live support
398
©2021 Cengage Learning. All Rights Reserved. May not be scanned, copied or duplicated, or posted to a publicly accessible website, in whole or in part.
Supply Chain Technology
Innovations
399
©2021 Cengage Learning. All Rights Reserved. May not be scanned, copied or duplicated, or posted to a publicly accessible website, in whole or in part.
Supply Chain Technology Innovations
Smart Technologies
To enable the supply chain evolution, companies must effectively digitize their
supply chains and deploy smart technologies
• Supply Chain Digitization
• Artificial Intelligence & Machine Learning
• IoT
• Blockchain
• Digital Twin
• Quantum Computing
400
©2021 Cengage Learning. All Rights Reserved. May not be scanned, copied or duplicated, or posted to a publicly accessible website, in whole or in part.
Summary
• To produce actionable knowledge, supply chain information must be high
quality, readily flow between organizations, and support a variety of decision
types.
• A well-designed SCIS links people, processes, and technology in a manner that
provides actionable information and enhances decision making.
• four general categories of supply chain software are: (1) planning tools for
forecasting and related activities, (2) execution systems for management of day-
to-day processes, (3) event management tools to monitor supply chain flows,
and (4) business intelligence applications used to analyze performance.
• To maximize SCIS investment success, managers must effectively
assess the SCM requirements, understand software options, and
address the technical issues.
401
©2021 Cengage Learning. All Rights Reserved. May not be scanned, copied or duplicated, or posted to a publicly accessible website, in whole or in part.
Supply Chain
Management,
11e
Chapter 15: Strategic Challenges and
Change for Supply Chains
©2021 Cengage Learning. All Rights Reserved. May not be scanned, copied or duplicated, or posted to a publicly accessible website, in whole or in part.
402
©2021 Cengage Learning. All Rights Reserved. May not be scanned, copied or duplicated, or posted to a publicly accessible website, in whole or in part.
Discussion Outline
• Principles of supply chain management
• Game-changing supply chain technologies
• Supply chain analytics
• Supply chain talent management
• Sustainability
• Supply chain innovation and transformation
403
©2021 Cengage Learning. All Rights Reserved. May not be scanned, copied or duplicated, or posted to a publicly accessible website, in whole or in part.
Principles of Supply Chain
Management
404
©2021 Cengage Learning. All Rights Reserved. May not be scanned, copied or duplicated, or posted to a publicly accessible website, in whole or in part.
Seven Principles of Supply Chain
Management
Update on the Seven
Principles:
• The seven principles basically
survive the test of time.
• We still have a long way to go
on supply chain strategy
implementation.
• Technology and data will be
the major game changer going
forward.
Source
Figure
15.1:
David
L.
Anderson,
Frank
F.
Britt,
and
Donavan
J.
Favre,
“The
Seven
Principles
of
Supply
Chain
Management,
Supply
Chain
Management
Review
(April,
2007):
46.
Copyright
©
2007
Reed
Business,
a
division
of
Reed
Elsevier.
405
©2021 Cengage Learning. All Rights Reserved. May not be scanned, copied or duplicated, or posted to a publicly accessible website, in whole or in part.
Game-Changing Supply
Chain Technologies
406
©2021 Cengage Learning. All Rights Reserved. May not be scanned, copied or duplicated, or posted to a publicly accessible website, in whole or in part.
Game-Changing Technologies
• Mobility
• Digitization
• Automation
407
©2021 Cengage Learning. All Rights Reserved. May not be scanned, copied or duplicated, or posted to a publicly accessible website, in whole or in part.
Mobility
Mobile internet (MI) and communication
Combinations of mobile devices (e.g. smartphones
and tablets), high-speed wireless networks, and
associated applications.
Multipurpose mobile computing device
Commercial grade device with features such as built-
in processor, memory and operating system (OS);
camera; barcode and label printers; scanners; RFID
readers; GPS; voice recognition software.
Mobile cloud
The combination of mobile development with cloud-
based storage, applications, computing and services.
• GPS technologies integrated with
wireless telecommunication and
computing devices
• Maximize fleet and asset utilization
− Real-time routing
− Response to weather conditions
− Dynamic driver dispatching
408
©2021 Cengage Learning. All Rights Reserved. May not be scanned, copied or duplicated, or posted to a publicly accessible website, in whole or in part.
Digitization
Deep Learning
Emphasize “autonomous”
learning that has become
an AI aspect of assets,
advanced (predictive and
prescriptive) analytics, AI-
driven automation, and
business intelligence
software.
Additive Mfg.
3D printing technology
creates physical objects
from digital models.
Potential uses of will
continue to broaden as the
range of printable materials
continues to expand.
Augmented Reality (AR)
AR in warehouse operations
AR technology, which could come
in the form of integrated smart
phone cameras or wearable
headsets and accessories, could
guide a worker who needs to find,
move, pick, pack, and ship a
particular product; and allow
him/her to scan barcode and
capture image.
Cloud Computing
Offering access to a shared
pool of computing
resources (e.g. servers,
storage, software) over the
Internet.
Augmented Reality
Integrates contextual
information into individuals’
field of view through an AR
headset, providing virtual
images, videos, animation
or informational content to
users who wear them.
409
©2021 Cengage Learning. All Rights Reserved. May not be scanned, copied or duplicated, or posted to a publicly accessible website, in whole or in part.
Automation
Intelligent Robotics
Emphasize “autonomous” learning
that has become an AI aspect of
assets, advanced (predictive and
prescriptive) analytics, AI-driven
automation, and business
intelligence software.
Internet Of Things (IoT)
3D printing technology creates
physical objects from digital models.
Potential uses will continue to
broaden as the range of printable
materials continues to expand.
Automation: M2M
Vehicle-to-Infrastructure (V2I)
Car manufacturers such as Volvo
and Ford have V2I vehicles in
production that are capable of
reading new smart road signs now
used in France and Germany.
410
©2021 Cengage Learning. All Rights Reserved. May not be scanned, copied or duplicated, or posted to a publicly accessible website, in whole or in part.
Supply Chain Analytics
411
©2021 Cengage Learning. All Rights Reserved. May not be scanned, copied or duplicated, or posted to a publicly accessible website, in whole or in part.
Supply Chain Analytics
From Data to Information to Understanding
One major topic of great contemporary interest is that of supply chain analytics that center on
taking a giant leap from data to information, and then from information to understanding.
Understanding
Information that has been examined & studied in context of specific business situations
(e.g., inventory levels in relation to overall economic conditions)
Information
Data that has been gathered, processed, organized & structured in a given context
(e.g. average levels of inventory and/or levels of inventory by SKU)
Data
Unorganized facts that need to be processed
(e.g. levels of inventory at ends of financial periods)
412
©2021 Cengage Learning. All Rights Reserved. May not be scanned, copied or duplicated, or posted to a publicly accessible website, in whole or in part.
The Velocity of Data
Every 60 seconds:
• 98,000+ tweets
• 695,000 status updates
• 11 million instant messages
• 698,445 Google searches
• 168 million+ emails sent
• 1,820TB of data created
• 217 new mobile web users
Kalakota, R. (2012, October 22). Sizing “Mobile + Social” Big Data Stats. Retrieved from http://practicalanalytics.wordpress.com/
413
©2021 Cengage Learning. All Rights Reserved. May not be scanned, copied or duplicated, or posted to a publicly accessible website, in whole or in part.
Supply Chain Analytics
Supply Chain Analytics Maturity
Figure
15.2:
C.
John
Langley
Jr.,
Ph.D.,
Penn
State
University.
Used
with
permission.
414
©2021 Cengage Learning. All Rights Reserved. May not be scanned, copied or duplicated, or posted to a publicly accessible website, in whole or in part.
Supply Chain Analytics
Analytical Resources
Level of Analytics Analytical Resources
Descriptive • Standard and ad hoc reporting
• Data from supply chain partners
• Alerts and notifications
• Query/drill down
Predictive • Forecasting
• Heuristic analysis
• Simulation
• Statistical analysis
• Predictive modeling
Prescriptive • Stochastic optimization
• Scenario planning
Cognitive • IBM Watson Analytics
Source
Table
15.1:
C.
John
Langley
Jr.,
Ph.D.,
Penn
State
University.
Used
with
permission.
415
©2021 Cengage Learning. All Rights Reserved. May not be scanned, copied or duplicated, or posted to a publicly accessible website, in whole or in part.
Supply Chain Analytics
Big Data and the Supply Chain
A primary goal of big data is to help organizations better understand the
information that resides within the data, and to focus attention on those
factors that are most relevant to making well-informed supply chain decisions.
Big data may be thought of as the process of accumulating, organizing and
analyzing very large sets of data to identify patterns, trends and other
information of interest.
416
©2021 Cengage Learning. All Rights Reserved. May not be scanned, copied or duplicated, or posted to a publicly accessible website, in whole or in part.
Supply Chain Talent and
Management
417
©2021 Cengage Learning. All Rights Reserved. May not be scanned, copied or duplicated, or posted to a publicly accessible website, in whole or in part.
Supply Chain Talent Management
Key Steps to Building A High Quality SCM Team
Acquiring new staff
Deploy active recruiting
techniques such as building
recruiting relationships with
leading universities,
leveraging employee
referrals, and creating online
communities via LinkedIn
and other sites to facilitate
candidate interaction.
Developing talent
Development programs that
include effective
onboarding, ongoing
training, and individual
guidance, coupled with a
strong culture of
development and supply
chain–human resources
collaboration.
Fostering the
advancement of top
supply chain talent
Deploy a proactive
combination of career
guidance and challenging
assignments, while
providing compelling SCM
advancement opportunities
via logical career paths,
retention strategies, and
succession planning.
418
©2021 Cengage Learning. All Rights Reserved. May not be scanned, copied or duplicated, or posted to a publicly accessible website, in whole or in part.
Supply Chain Talent Management
Effective Talent Management
Linking People Strategy to Business Strategy
Source
Figure
15.4:
Langley,
C.
John
Jr.,
and
Capgemini,
LLC,
2015
19th
Annual
3PL
Study,
Capgemini,
LLC.
Figure
courtesy
of
KornFerry
International.
419
©2021 Cengage Learning. All Rights Reserved. May not be scanned, copied or duplicated, or posted to a publicly accessible website, in whole or in part.
Sustainability
420
©2021 Cengage Learning. All Rights Reserved. May not be scanned, copied or duplicated, or posted to a publicly accessible website, in whole or in part.
Sustainability Considerations
Sustainability requires companies to consider and manage
the impact that their supply chain has on both the ecological
and social environment in which they operate.
421
©2021 Cengage Learning. All Rights Reserved. May not be scanned, copied or duplicated, or posted to a publicly accessible website, in whole or in part.
Sustainability Includes Many Dimensions
Sustainability:
• Political
• Economic
• Social
• Technological
• Environmental
• Legal
422
©2021 Cengage Learning. All Rights Reserved. May not be scanned, copied or duplicated, or posted to a publicly accessible website, in whole or in part.
Sustainability
The Business Case for Sustainability
• Regulation
− Legislation & compliance
• Risk
− Short-term cost & long-term supply
• Reputation
− Brand loyalty, sentiment & awareness
• Profit
− Cost reduction & competitive advantages
423
©2021 Cengage Learning. All Rights Reserved. May not be scanned, copied or duplicated, or posted to a publicly accessible website, in whole or in part.
Sustainability
Four “R’s” of Sustainability
Sustainability
Approaches
Description
Reuse Reuse often requires disassembly, which is a systematic method of separating a
product into constituent parts, components, subassemblies, or other component parts.
The parts or components may be reassembled for reuse after cleaning, checking, and
repair, or the individual components may be reused.
Remanufacturing Remanufacturing essentially means that a product or part is returned to the market as
“good as new.” Auto parts, tires, and electronics are frequently remanufactured.
Reconditioning Reconditioning usually means returning used products to working order but not “as
good as new.”
Recycling Recycling generally refers to the secondary use of materials. It usually includes glass
bottles, cans, newspapers, corrugated material, tires, etc. The recycling is usually
performed for individual households by municipal government agencies.
Source
Table
15.2:
Center
for
Supply
Chain
Research
TM
,
Penn
State
University.
424
©2021 Cengage Learning. All Rights Reserved. May not be scanned, copied or duplicated, or posted to a publicly accessible website, in whole or in part.
Sustainability
Reverse Flows: Key Observations
• Global supply chains
− Global supply chains present both challenge and opportunity for reverse flows.
• Cash/value & technology
− Cash/value from returns, and power of technology has not received enough emphasis in return flows.
• Necessary evil/cost center
− Reverse direction needs continual scrutiny to control and reduce.
• Increased reverse flow
− Easy return as part of customer service policies.
− Increased consumer recycling programs.
− High obsolescence rate in technological products.
425
©2021 Cengage Learning. All Rights Reserved. May not be scanned, copied or duplicated, or posted to a publicly accessible website, in whole or in part.
Supply Chain Innovation
and Transformation
426
©2021 Cengage Learning. All Rights Reserved. May not be scanned, copied or duplicated, or posted to a publicly accessible website, in whole or in part.
Supply Chain Transformation Process Model
Source
Figure
15.5:
C.
John
Langley
Jr.,
Ph.D.,
Penn
State
University.
Used
with
permission.
427
©2021 Cengage Learning. All Rights Reserved. May not be scanned, copied or duplicated, or posted to a publicly accessible website, in whole or in part.
Example Process Elements and Details (1 of 2)
Process
Elements
Description Examples Examples (cont.)
INPUT
Basically, the state
of the supply chain
prior to the intended
transformation (“as-
is” state)
 Supply chain goals and objectives
 Configuration/mapping of current
supply chain
 Details relating to facilities, customers,
suppliers, capital, cost, and growth
 Economic and competitive
environments
 Macro and micro changes
in product and service
markets
PROCESS
Conversion or
transformation of
inputs into outputs
 Supply chain innovations
 Flows of products, information, capital,
throughout the supply chain
 Alignment within and
among organizations
 Essentially, what needs to
be converted, changed, or
added to achieve results
of the transformation
OUTPUT
Results of the
transformation (“to-
be” state)
 Improvements in supply chain
processes
 Measurable results
 Impacts on customers,
cost, capital, and growth
of organization
 Enhanced competitive
advantage
Source
Table
15.3:
C.
John
Langley
Jr.,
Ph.D.,
Penn
State
University.
Used
with
permission.
428
©2021 Cengage Learning. All Rights Reserved. May not be scanned, copied or duplicated, or posted to a publicly accessible website, in whole or in part.
Example Process Elements and Details (2 of 2)
Process
Elements
Description Examples Examples (cont.)
Resources
Capabilities needed to accomplish
the transformation
 People
 Information
 Technology
 Financial support
 Change management
capabilities
Constraints
Constrain the process and/or
outputs
 Organizational policies
 Budget/financial capabilities
 Supply chain partner capabilities
 Culture/environmental
 Government/regulatory
 Contract terms
 Risk
Feedback
Assess process and process
outcomes with desired goals and
objectives—use as basis for
needed revisions to process inputs
or changes to process steps
 Comparisons of outputs with
goals and objectives
 Identify elements of the process
map that are in need of re-
thinking or revision
 Valuable step to make
mid-course
modifications to
improve process
outputs
Governance
Rules or policies of how the
process works—actually,
governance itself is a process
 Who is to be involved, and what
are their roles
 Protocols for decision making
 Documentation of
information and status
relating to steps in
transformation process
Source
Table
15.3:
C.
John
Langley
Jr.,
Ph.D.,
Penn
State
University.
Used
with
permission.
429
©2021 Cengage Learning. All Rights Reserved. May not be scanned, copied or duplicated, or posted to a publicly accessible website, in whole or in part.
Supply Chain Transformation in the
Digital Disruptive Age
• Commerce is changing (rapidly).
• Supply chain must evolve to meet strategic needs.
• Tradeoffs between efficient and customer-focused.
• People, process and tech must be aligned.
• Added complexity and expectations.
• View supply chain as “end-to-end” and not as function(s).
• Collaboration and leadership is KEY.
• Four themes—technology, analytics, ecosystems, and talent.
430
©2021 Cengage Learning. All Rights Reserved. May not be scanned, copied or duplicated, or posted to a publicly accessible website, in whole or in part.
Summary
• Seven landmark principles of supply chain management have withstood the test of time. These principles
contribute to the objectives of revenue growth, asset utilization, and cost reduction.
• Supply chains are impacted by a wide variety of external and internal factors, among which the
importance of game-changing technologies to the future of SCM cannot be overstated.
• Supply chains generate a wealth of data that can be transformed into information and insight through the
use of supply chain analytics.
• A shortage of qualified supply chain talent requires a proactive SCM talent management process to
acquire, develop, and retain key individuals.
• The importance of sustainability to supply chains cannot be over-stated. The four “R’s”
of sustainability provide useful guideposts for action.
• The extent to which organizations and supply chains are able to remain relevant and
competitive will be directly related to their abilities to innovate and transform themselves.

9780357132302_Langley11e_ch1_LEAP.pptx

  • 1.
    1 ©2021 Cengage Learning.All Rights Reserved. May not be scanned, copied or duplicated, or posted to a publicly accessible website, in whole or in part. Supply Chain Management, 11e Chapter 1: Supply Chain Management: An Overview ©2021 Cengage Learning. All Rights Reserved. May not be scanned, copied or duplicated, or posted to a publicly accessible website, in whole or in part.
  • 2.
    2 ©2021 Cengage Learning.All Rights Reserved. May not be scanned, copied or duplicated, or posted to a publicly accessible website, in whole or in part. Discussion Outline • Five major change drivers • Development of supply chain management concept • Integrated supply chain characteristics • Supply chain flows • Major supply chain issues
  • 3.
    3 ©2021 Cengage Learning.All Rights Reserved. May not be scanned, copied or duplicated, or posted to a publicly accessible website, in whole or in part. Leading Retailers (Sales/Year) 2000 2010 2015 2019 1. Wal-Mart 1. Wal-Mart 1. Wal-Mart 1. Wal-Mart 2. Kroger 2. Kroger 2. Costco 2. Amazon 3. The Home Depot 3. Target 3. Kroger 3. Kroger 4. Sears, Roebuck & Company 4. Walgreen 4. The Home Depot 4. Costco 5. Kmart 5. Home Depot 5. Target 5. Walgreens Boots Alliance 6. Albertson’s 6. Costco 6. Walgreen’s 6. The Home Depot 7. Target 7. CVS Caremark 7. CVS Caremark 7. CVS Health Corporation 8. JC Penney 8. Lowe’s 8. Amazon.com 8. Target 9. Costco 9. Best Buy 9. Lowe’s 9. Lowe’s Companies 10. Safeway 10. Sears Holdings 10. Best Buy 10. Albertsons Companies Source Table 1.1: National Retail Federation (NRF) https://nrf.com/resources/annual-retailer- lists/top-100-retailers
  • 4.
    4 ©2021 Cengage Learning.All Rights Reserved. May not be scanned, copied or duplicated, or posted to a publicly accessible website, in whole or in part. Six Major Change Drivers Source Figure 1.1: Center for Supply Chain Research, Penn State University.
  • 5.
    5 ©2021 Cengage Learning.All Rights Reserved. May not be scanned, copied or duplicated, or posted to a publicly accessible website, in whole or in part. Six Major Change Drivers—Globalization Globalization creates more economic and political risk, shorter product life cycle, and the blurring of traditional organizational boundaries. Inventory management challenges • Faster duplicability of products & services • Faster reduction in demand • Requirement of new pricing policies • Higher risk of obsolescence Longer and more complex supply chain challenges • Growth and increased scope of outsourcing
  • 6.
    6 ©2021 Cengage Learning.All Rights Reserved. May not be scanned, copied or duplicated, or posted to a publicly accessible website, in whole or in part. Six Major Change Drivers—Technology Technology is a facilitator of internal process and supply chain transformation. It is also a major force in changing the dynamics of the marketplace. The Internet. “Connected” 24/7 Social networks. Impact on customer demand and the speed of information transfers The world’s “knowledge pool” connection. Opportunities for collaboration in supply chains.
  • 7.
    7 ©2021 Cengage Learning.All Rights Reserved. May not be scanned, copied or duplicated, or posted to a publicly accessible website, in whole or in part. Six Major Change Drivers—Organization Consolidation and Power Shifts During the 1980s and especially the 1990s, economic power and the driving force in supply chains shift from product manufacturers to the retail end of the supply chain. More collaboration among organizations in supply chains • Win-win, improved services such as: − Scheduled deliveries − “Rainbow” pallets − Advance shipments notices (ASNs) shrink-wrapped pallets • Sharing of point-of-sale data to mitigate “bullwhip effect”
  • 8.
    8 ©2021 Cengage Learning.All Rights Reserved. May not be scanned, copied or duplicated, or posted to a publicly accessible website, in whole or in part. Six Major Change Drivers—Empowered Consumers Consumers are empowered by exponentially expanded access to product sources and related information and increased buying power due to high income levels. Increased pressures on supply chain due to increased demands at the retail level in terms of: • Competitive prices • High quality in products and services • Tailored or customized products • Convenience and responsiveness – 24/7 availability with a minimum of wait time • Flexibility – Omnichannel distribution strategies
  • 9.
    9 ©2021 Cengage Learning.All Rights Reserved. May not be scanned, copied or duplicated, or posted to a publicly accessible website, in whole or in part. Six Major Change Drivers—Government Policy and Regulation More competitive environment is a result of the deregulation of several important sectors in the United States occurred in the 1980s and 1990s. The transportation industry. Expanded services beyond transportation, with service providers’ role evolving to outsourcing partners The financial sector. More flexible and responsive to customer needs, making businesses more cognizant of supply chain management impact on efficiency and cash flow The communications industry. A component of the information revolution, leading to dramatic improvements and opportunities in logistics and supply chains
  • 10.
    10 ©2021 Cengage Learning.All Rights Reserved. May not be scanned, copied or duplicated, or posted to a publicly accessible website, in whole or in part. Six Major Change Drivers—Sustainability The pursuit of sustainability is widely recognized as a key element of successful supply chain management. This is critical to effective risk management and achieving competitive advantage. Society. Focus on people is a significant concern in the area of sustainability. Environment. The objective of being “green” is a key element of making positive contributions to improving our environment. There are many ways in which supply chains may help to achieve desired outcomes. Economy. Continued economic and financial sustainability is essential to making future positive impacts on society and the environment.
  • 11.
    11 ©2021 Cengage Learning.All Rights Reserved. May not be scanned, copied or duplicated, or posted to a publicly accessible website, in whole or in part. Evolution of Supply Chain Management Concept Source Figure 1.2: Center for Supply Chain Research, Penn State University.
  • 12.
    12 ©2021 Cengage Learning.All Rights Reserved. May not be scanned, copied or duplicated, or posted to a publicly accessible website, in whole or in part. Integrated Supply Chain—Basics SCM is the art and science of integrating the flows of products, information and financials through the entire supply pipeline from the supplier’s supplier to the customer’s customer. Source Figure 1.4: Center for Supply Chain Research, Penn State University.
  • 13.
    13 ©2021 Cengage Learning.All Rights Reserved. May not be scanned, copied or duplicated, or posted to a publicly accessible website, in whole or in part. Integrated Supply Chain—Network Source Figure 1.5 : Center for Supply Chain Research, Penn State University.
  • 14.
    14 ©2021 Cengage Learning.All Rights Reserved. May not be scanned, copied or duplicated, or posted to a publicly accessible website, in whole or in part. Supply Chain Flows Center for Supply Chain Research, Penn State University.
  • 15.
    15 ©2021 Cengage Learning.All Rights Reserved. May not be scanned, copied or duplicated, or posted to a publicly accessible website, in whole or in part. Major Supply Chain Issues (1 of 5) 1. Supply chain networks 2. Complexity 3. Inventory deployment 4. Information 5. Cost and value 6. Organizational relationships 7. Performance measurement 8. Technology 9. Transportation management 10. Supply chain security 11. Talent management
  • 16.
    16 ©2021 Cengage Learning.All Rights Reserved. May not be scanned, copied or duplicated, or posted to a publicly accessible website, in whole or in part. Major Supply Chain Issues (2 of 5) Supply Chain Network The challenges • Network system (facilities and supporting transportation services) must be capable and flexible to respond and change with market dynamics Complexity The challenges • Increased requirements in simplifying and continually evaluating areas of complexity in the various aspects of supply chains Inventory Deployment The challenges • Increased requirements for coordination or integration to reduce inventory levels on horizontal (single-firm) and vertical (multiple-firms) levels in the supply chain
  • 17.
    17 ©2021 Cengage Learning.All Rights Reserved. May not be scanned, copied or duplicated, or posted to a publicly accessible website, in whole or in part. Major Supply Chain Issues (3 of 5) Information The challenges • The sharing of information along the supply chain • The discipline to ensure the integrity of the vast amount of data collected and stored Cost and Value The challenges • The prevention of sub- optimization Organizational Relationships The challenges • Internal collaboration (marketing, sales, operations, finance, etc.) • External collaboration (vendors, customers, transportation companies, 3PLs)
  • 18.
    18 ©2021 Cengage Learning.All Rights Reserved. May not be scanned, copied or duplicated, or posted to a publicly accessible website, in whole or in part. Major Supply Chain Issues (4 of 5) Performance Measurement The challenges • Connecting lower-level metrics in an organization directly to the high-level performance measures of the organization and the supply chain Technology The challenges • Evaluate, strategically plan, and successfully implement the technology to make the improvements desired Transportation Management The challenges • Transport “perfect storm.” Transport market changes; driver shortages; fuel costs; infrastructure constraints; and regulatory changes
  • 19.
    19 ©2021 Cengage Learning.All Rights Reserved. May not be scanned, copied or duplicated, or posted to a publicly accessible website, in whole or in part. Major Supply Chain Issues (5 of 5) Supply Chain Security The challenges • Risk of disruptions, vulnerability, and exposure to terroristic threats exacerbated by distance and complexity in global supply chain Talent management The challenges • Attract, develop, and maintain the appropriate pool of talent from entry level to executive level
  • 20.
    20 ©2021 Cengage Learning.All Rights Reserved. May not be scanned, copied or duplicated, or posted to a publicly accessible website, in whole or in part. Summary • The rate of change has been driven by a set of external forces including globalization, technology, organizational consolidation and shifts in power in supply chains, empowered consumers, and government policy and regulations. • Supply chains are extended enterprises which require managing four flows— products, information, financials (cash), and demand on a collaborative basis. • The global supply chains of the best companies must be adaptive, resilient, and responsive to meet the challenges of the global economy and develop mitigating strategies for disruptive forces.
  • 21.
    21 ©2021 Cengage Learning.All Rights Reserved. May not be scanned, copied or duplicated, or posted to a publicly accessible website, in whole or in part. Supply Chain Management, 11e Chapter 2: Global Dimensions of Supply Chains ©2021 Cengage Learning. All Rights Reserved. May not be scanned, copied or duplicated, or posted to a publicly accessible website, in whole or in part.
  • 22.
    22 ©2021 Cengage Learning.All Rights Reserved. May not be scanned, copied or duplicated, or posted to a publicly accessible website, in whole or in part. Discussion Outline • Rationale for global trade and commerce • Contributing factors for global commerce and supply chain flows • Supply chains in global economy • Global markets and strategy • Supply chain security and role of ports • Free trade agreements
  • 23.
    23 ©2021 Cengage Learning.All Rights Reserved. May not be scanned, copied or duplicated, or posted to a publicly accessible website, in whole or in part. Rationale for Global Trade and Commerce • Absolute advantage − Lower cost and/or access to items not available locally • Comparative advantage − Differences in the cost of producing products in different countries
  • 24.
    24 ©2021 Cengage Learning.All Rights Reserved. May not be scanned, copied or duplicated, or posted to a publicly accessible website, in whole or in part. Contributing Factors for Global Flows and Supply Chain Flows
  • 25.
    25 ©2021 Cengage Learning.All Rights Reserved. May not be scanned, copied or duplicated, or posted to a publicly accessible website, in whole or in part. Contributing Factors for Global Flows and Trade 1. Population size and distribution 2. Urbanization 3. Land and resources 4. Technology and information 5. Globalized economy
  • 26.
    26 ©2021 Cengage Learning.All Rights Reserved. May not be scanned, copied or duplicated, or posted to a publicly accessible website, in whole or in part. Population = Labor (1 of 3) Rank Country 2000 Population (in thousands) 2010 Population (in thousands) 2019 Population (in thousands) 2050 Expected Population (in thousands) 1 China 1,268,302 1,336,681 1,389,619 1,301,627 2 India 1,006,300 1,173,108 1,311,559 1,656,554 3 United States 282,162 309,338 331,884 398,328 4 Indonesia 214,091 243,423 264,936 300,183 5 Pakistan 152,429 195,834 210,798 290,848 6 Brazil 174,315 184,405 210,302 232,304 7 Nigeria 125,581 165,905 208,679 416,996 8 Bangladesh 128,735 146,616 161,063 193,093 9 Russia 147,054 142,527 141,945 129,908 10 Mexico 99,775 114,061 127,318 150,568 Source Table 2.1: U.S. and World Population Clock and International Data Base (IDB), U.S. Census Bureau (https://www.census.gov/popclock/), and U.S. Census Bureau (https://www.census.gov/data- tools/demo/idb/informationGateway.php).
  • 27.
    27 ©2021 Cengage Learning.All Rights Reserved. May not be scanned, copied or duplicated, or posted to a publicly accessible website, in whole or in part. Population = Labor (2 of 3) Totals 2000 Population (in thousands) 2010 Population (in thousands) 2019 Population (in thousands) 2050 Expected Population (in thousands) TOP TEN Countries 3,598,744 4,011,898 4,358,102 5,070,409 Top Ten Percentage of World Population 59% 58% 58% 53% TOTAL World Population 6,086,149 6,872,671 7,560,290 9,488,153 Source Table 2.1: U.S. and World Population Clock and International Data Base (IDB), U.S. Census Bureau (https://www.census.gov/popclock/), and U.S. Census Bureau (https://www.census.gov/data- tools/demo/idb/informationGateway.php).
  • 28.
    28 ©2021 Cengage Learning.All Rights Reserved. May not be scanned, copied or duplicated, or posted to a publicly accessible website, in whole or in part. Population = Labor (3 of 3) Source: United Nations, Department of Economic and Social Affairs, Population Division (2017). World Population Prospects: The 2017 Revision, custom data acquired via website. (https://population.un.org/wpp/Publications/).
  • 29.
    29 ©2021 Cengage Learning.All Rights Reserved. May not be scanned, copied or duplicated, or posted to a publicly accessible website, in whole or in part. Urbanization • The rise of “megacities” − By 2030, 60% of the world’s population will live in urban areas (vs. 47% in 2000) • Change most profound in less and least developed countries of the world − Urban sustainability challenges Urban sustainability challenges • Waste and pollution • Water and energy • Traffic congestions • Health problems • Green spaces • Poverty • Social security
  • 30.
    30 ©2021 Cengage Learning.All Rights Reserved. May not be scanned, copied or duplicated, or posted to a publicly accessible website, in whole or in part. Land and Resources Critical role of technology in mitigating resource scarcity Crop & forest Land Water Food Energy
  • 31.
    31 ©2021 Cengage Learning.All Rights Reserved. May not be scanned, copied or duplicated, or posted to a publicly accessible website, in whole or in part. Technology and Information Technology has two important dimensions. • Technology as an “internal” change agent − Enhanced efficiency, effectiveness, and ability of an organization to compete in the global marketplace • Technology as an “external” change agent − New forms of competition or new business models (e.g. omnichannel distribution, global outsourcing)
  • 32.
    32 ©2021 Cengage Learning.All Rights Reserved. May not be scanned, copied or duplicated, or posted to a publicly accessible website, in whole or in part. Globalized Economy Export-Trade Flows of Merchandise (2018) Source Figure 2.2: © World Trade Organization 2019 “International Trade and Market Access Data”
  • 33.
    33 ©2021 Cengage Learning.All Rights Reserved. May not be scanned, copied or duplicated, or posted to a publicly accessible website, in whole or in part. Globalized Economy Import-Trade Flows of Merchandise (2018) Source Figure 2.3: © World Trade Organization 2019 “International Trade and Market Access Data”
  • 34.
    34 ©2021 Cengage Learning.All Rights Reserved. May not be scanned, copied or duplicated, or posted to a publicly accessible website, in whole or in part. Top U.S. Trading Partners (US$ Billions) 2010 2014 2018 China $ 456.80 $ 590.70 $ 659.80 Canada $ 525.30 $ 658.10 $ 617.20 Mexico $ 393.00 $ 534.50 $ 611.50 Japan $ 180.90 $ 200.90 $ 217.60 Germany $ 130.90 $ 172.60 $ 183.60 South Korea $ 87.70 $ 114.10 $ 130.60 United Kingdom $ 98.30 $ 107.90 $ 127.00 France $ 65.60 $ 78.20 $ 88.80 India $ 48.80 $ 66.90 $ 87.50 Italy $ 42.73 $ 59.10 $ 77.90 Total Top Ten $ 2,030.03 $ 2,583.00 $ 2,801.50 Top Ten Percentage of Total, All Countries 63.63% 65.08% 66.59% TOTAL All Countries $ 3,190.20 $ 3,969.10 $ 4,206.90 Source Table 2.5: Source: U.S. Census Bureau (Top Trading Partners (https://www.census.gov/foreign-trade/statistics/highlights/top/index.html); and U.S. Census Bureau (https://www.census.gov/foreign-trade/balance/index.html).
  • 35.
    35 ©2021 Cengage Learning.All Rights Reserved. May not be scanned, copied or duplicated, or posted to a publicly accessible website, in whole or in part. Supply Chains in Global Economy
  • 36.
    36 ©2021 Cengage Learning.All Rights Reserved. May not be scanned, copied or duplicated, or posted to a publicly accessible website, in whole or in part. Supply Chain in Global Economy Global trade growth has been fueled by free trade agreements (FTAs) that lift most tariff, quota, and fee/tax limitations on trade. The best supply chains compete successfully on a national, regional, and global basis. Bilateral  FTAs  Regional • Bi-lateral agreements are between two nations • US currently in 20 bi-lateral FTAs • Regional trade agreements involve 3 or more nations • US currently involved in: − Free Trade Area of Americas − Middle East Free Trade Initiatives − Enterprise for ASEAN Initiatives − North American Free Trade Agreement (NAFTA) − USMCA (US-Mexico-Canada) Agreement (proposed)
  • 37.
    37 ©2021 Cengage Learning.All Rights Reserved. May not be scanned, copied or duplicated, or posted to a publicly accessible website, in whole or in part. Micro Perspective of Global Supply Chains Global Markets and Strategy
  • 38.
    38 ©2021 Cengage Learning.All Rights Reserved. May not be scanned, copied or duplicated, or posted to a publicly accessible website, in whole or in part. Global Markets and Strategy Success in the global market-place requires development of a cohesive set of strategies including product development, technology, marketing, manufacturing, and supply chains. • Supply chain perspective • Customer service perspective
  • 39.
    39 ©2021 Cengage Learning.All Rights Reserved. May not be scanned, copied or duplicated, or posted to a publicly accessible website, in whole or in part. Global Markets and Strategy Supply Chain Perspective 1. Strategically sourcing materials and components worldwide 2. Selecting global locations for key supply depots and DCs 3. Evaluating transportation alternatives and channel intermediaries 4. Understanding governmental influences on global SC flows 5. Examining opportunities for collaboration with 3PLs or 4PLs
  • 40.
    40 ©2021 Cengage Learning.All Rights Reserved. May not be scanned, copied or duplicated, or posted to a publicly accessible website, in whole or in part. Global Markets and Strategy Customer Service Perspective 1. Standardization to reduce complexity must maintain some customization. 2. Global competition often reduces the product life cycle. 3. Organizational structures and business models change with more outsourcing. 4. Globalization introduces more volatility and complexity.
  • 41.
    41 ©2021 Cengage Learning.All Rights Reserved. May not be scanned, copied or duplicated, or posted to a publicly accessible website, in whole or in part. Supply Chain Security and Role of Ports
  • 42.
    42 ©2021 Cengage Learning.All Rights Reserved. May not be scanned, copied or duplicated, or posted to a publicly accessible website, in whole or in part. Supply Chain Security A Balancing Act Security Measures • The Trade Act of 2002 • The U.S. Maritime Transportation Security Act of 2002 • The Customs Trade Partnership Against Terrorism (C-TPAT) Global Trade Flows • Electronic filing of cargo information • Standards for container seals and locks, cargo tracking, identification, and screening systems for ocean containers • A “green lane”
  • 43.
    43 ©2021 Cengage Learning.All Rights Reserved. May not be scanned, copied or duplicated, or posted to a publicly accessible website, in whole or in part. Role of Ports Global Supply Chain and Security Ports are a critical part of global supply chains and a major focus for global security. • Over 90 percent of U.S. international trade passes through ports. • Ports are bases of operation to deploy troops and equipment.
  • 44.
    44 ©2021 Cengage Learning.All Rights Reserved. May not be scanned, copied or duplicated, or posted to a publicly accessible website, in whole or in part. Free Trade Agreements
  • 45.
    45 ©2021 Cengage Learning.All Rights Reserved. May not be scanned, copied or duplicated, or posted to a publicly accessible website, in whole or in part. Supply Chain in Global Economy NAFTA  USMCA Agreement • NAFTA − Established free trade among Canada, the U.S., and Mexico. − Goals involved making structural changes to operate a borderless logistics network in North America. • USMCA (2020) − Proposed multi-lateral trade agreement with U.S., Mexico, and Canada
  • 46.
    46 ©2021 Cengage Learning.All Rights Reserved. May not be scanned, copied or duplicated, or posted to a publicly accessible website, in whole or in part. Summary • Trade flows between the United States and other countries have grown considerably, resulting in global supply chains becoming increasingly important. • The increased complexity and competitiveness of a global economy have resulted in shorter product life cycles, new forms of competition, and new business models. • Success in the global marketplace requires ongoing development of a cohesive set of strategies that has implications to both supply chains and customer services. • Companies individually, jointly, and in cooperation with the government are actively involved in supply chain security. • With increasing regional economic integration, NAFTA has helped to foster trade in North America. Proposed USMCA Agreement should exceed benefits of NAFTA
  • 47.
    47 ©2021 Cengage Learning.All Rights Reserved. May not be scanned, copied or duplicated, or posted to a publicly accessible website, in whole or in part. Supply Chain Management, 11e Chapter 3: Role of Logistics in Supply Chains ©2021 Cengage Learning. All Rights Reserved. May not be scanned, copied or duplicated, or posted to a publicly accessible website, in whole or in part.
  • 48.
    48 ©2021 Cengage Learning.All Rights Reserved. May not be scanned, copied or duplicated, or posted to a publicly accessible website, in whole or in part. Discussion Outline • Value-added roles of logistics • Key logistics activities • Macro perspective on logistics • Micro dimension of logistics • Logistics and systems analysis
  • 49.
    49 ©2021 Cengage Learning.All Rights Reserved. May not be scanned, copied or duplicated, or posted to a publicly accessible website, in whole or in part. What Is Logistics? Logistics can be viewed as part of organizational management with four major subdivisions. 1. Business Logistics. Part of supply chain that plans, implements, and controls the flow and storage of goods, services, and related information. 2. Military Logistics. Design and integration of all aspects of support for the operational capability of the military forces and their equipment. 3. Event Logistics. Network of activities, facilities & personnel required to organize, schedule & deploy the resources for an event to take place and withdraw after the event. 4. Service Logistics. Acquisition, scheduling & management of facilities, assets, personnel & materials to support a service operation & business.
  • 50.
    50 ©2021 Cengage Learning.All Rights Reserved. May not be scanned, copied or duplicated, or posted to a publicly accessible website, in whole or in part. Value-added Roles of Logistics Five Principal Types of Economic Utility Economic Utility  Time  Form  Possession  Quantity  Place
  • 51.
    51 ©2021 Cengage Learning.All Rights Reserved. May not be scanned, copied or duplicated, or posted to a publicly accessible website, in whole or in part. Value-added Roles of Logistics Generally, production/manufacturing activities are credited with providing form utility; logistics activities with time, place, and quantity utilities; and marketing activities with possession utility.
  • 52.
    52 ©2021 Cengage Learning.All Rights Reserved. May not be scanned, copied or duplicated, or posted to a publicly accessible website, in whole or in part. Key Logistics Activities 1. Transportation 2. Storage 3. Industrial packaging 4. Materials handling 5. Inventory control 6. Order fulfillment 7. Demand forecasting 8. Production planning & scheduling 9. Procurement 10.Customer service 11.Plant & warehouse site location 12.Others* * Others include parts and service support, return goods handling, and salvage and scrap disposal.
  • 53.
    53 ©2021 Cengage Learning.All Rights Reserved. May not be scanned, copied or duplicated, or posted to a publicly accessible website, in whole or in part. Macro Perspective on Logistics
  • 54.
    54 ©2021 Cengage Learning.All Rights Reserved. May not be scanned, copied or duplicated, or posted to a publicly accessible website, in whole or in part. Macro Perspective on Logistics U.S. Business Logistics Costs Source Figure 3.2: Reproduced with permission from Council of Supply Chain Management Professionals.
  • 55.
    55 ©2021 Cengage Learning.All Rights Reserved. May not be scanned, copied or duplicated, or posted to a publicly accessible website, in whole or in part. Macro Perspective on Logistics U.S. Logistics Costs as Percent of GDP
  • 56.
    56 ©2021 Cengage Learning.All Rights Reserved. May not be scanned, copied or duplicated, or posted to a publicly accessible website, in whole or in part. Macro Perspective of Logistics U.S. Business Logistics Costs – 2018 (1 of 2) US business logistics costs ($ billion) 2018 YoY 18/17 5-yr. CAGR Transportation costs Full truckload 296.1 7.6% 3.6% Less-than-truckload 71.8 8.3% 3.5% Private or dedicated 300.9 13.1% 7.1% Motor carriers 668.8 10.1% 5.1% Parcel 104.9 8.7% 8.0% Carload 61.4 7.2% −0.6% Intermodal 27.0 28.7% 8.1% Rail 88.4 12.9% 1.6% Air freight (includes domestic, import, export, cargo, and express) 76.5 9.2% 3.8% Water and ports (includes domestic, import, and export) 45.7 12.8% 1.5% Pipeline 53.0 12.7% 12.7% Subtotal 1,037.4 10.4% 5.1% Source: CSCMP’s 30 th Annual State of Logistics Report, 2019
  • 57.
    57 ©2021 Cengage Learning.All Rights Reserved. May not be scanned, copied or duplicated, or posted to a publicly accessible website, in whole or in part. Macro Perspective of Logistics U.S. Business Logistics Costs – 2018 (2 of 2) US business logistics costs ($ billion) 2018 YoY 18/17 5-yr. CAGR Inventory carrying costs Storage 153.1 3.2% 3.0% Financial cost (WACC × total business inventory) 192.5 26.0% 3.0% Other (obsolescence, shrinkage, insurance, handling, others) 148.1 14.8% 3.0% Subtotal 493.7 14.8% 3.0% Other costs Carriers’ support activities 52.3 10.3% 4.5% Shippers’ administrative costs 52.1 2.8% 5.3% Subtotal 104.4 6.4% 4.9% Total US business logistics costs 1,635.46 11.4% 4.4% Source: CSCMP’s 30 th Annual State of Logistics Report, 2019
  • 58.
    58 ©2021 Cengage Learning.All Rights Reserved. May not be scanned, copied or duplicated, or posted to a publicly accessible website, in whole or in part. Micro Dimensions of Logistics Logistics Interface with other functional areas Factors affecting cost & importance of logistics
  • 59.
    59 ©2021 Cengage Learning.All Rights Reserved. May not be scanned, copied or duplicated, or posted to a publicly accessible website, in whole or in part. Micro Dimensions of Logistics Logistics Interfaces with Other Functional Areas Logistics Manufacturing • Length of the production run • Available quantity of raw material and component • Industrial packaging Marketing (4 Ps – Marketing Mix) • Price (e.g. purchase quantity discounts) • Product (e.g. size, shape, weight, packaging) • Promotion • Place (distribution channel selection) Finance • Inventory • Warehouses & transportation fleet owned and/or outsourced • Customer service Accounting • Cost information for analysis of alternative logistics options • Supply chain tradeoffs and performance measurement
  • 60.
    60 ©2021 Cengage Learning.All Rights Reserved. May not be scanned, copied or duplicated, or posted to a publicly accessible website, in whole or in part. Micro Dimensions of Logistics (1 of 5) Factors Affecting Cost & Importance of Logistics 1. Competitive relationships 2. Order cycle length 3. Substitutability 4. Inventory effect 5. Transportation effect 6. Product-related factors 7. Spatial relationships
  • 61.
    61 ©2021 Cengage Learning.All Rights Reserved. May not be scanned, copied or duplicated, or posted to a publicly accessible website, in whole or in part. Micro Dimensions of Logistics (2 of 5) Factors Affecting Cost & Importance of Logistics Competitive Relationships • Customer service can be a very important form of competition. Order Cycle Length • Shorter order cycles reduce the inventory required by the customer. Substitutability • Customer service is important for highly substitutable products to reduce lost sales cost.
  • 62.
    62 ©2021 Cengage Learning.All Rights Reserved. May not be scanned, copied or duplicated, or posted to a publicly accessible website, in whole or in part. Micro Dimensions of Logistics (3 of 5) Factors Affecting Cost & Importance of Logistics Inventory Effect • Increasing inventory costs can reduce the cost of lost sales. Transportation Effect • Cost of lost sales can be reduced by spending more on transportation service to improve customer service. Spatial Relationships • The location of fixed points in the logistics system with respect to demand and supply points are very important to transportation costs.
  • 63.
    63 ©2021 Cengage Learning.All Rights Reserved. May not be scanned, copied or duplicated, or posted to a publicly accessible website, in whole or in part. Micro Dimensions of Logistics (4 of 5) Factors Affecting Cost & Importance of Logistics Product-related Factors • Dollar value. The product’s dollar value typically affects warehousing costs, inventory costs, transportation costs, packaging costs, and even materials-handling costs. • Density. Weight/space ratio affects transportation and warehousing costs. As density increases for a product, its transportation and warehousing costs tend to decrease. • Susceptibility to damage. The greater the risk of damage to a product, the higher the transportation and warehousing cost. • Special handling requirements. Need for special handling (e.g. refrigeration, heating, or strapping) will usually increase warehousing, transportation, and packaging costs.
  • 64.
    64 ©2021 Cengage Learning.All Rights Reserved. May not be scanned, copied or duplicated, or posted to a publicly accessible website, in whole or in part. Micro Dimensions of Logistics (5 of 5) Factors Affecting Cost & Importance of Logistics Spatial Relationship Example Source Figure 3.11: Center for Supply Chain Research, Penn State University.
  • 65.
    65 ©2021 Cengage Learning.All Rights Reserved. May not be scanned, copied or duplicated, or posted to a publicly accessible website, in whole or in part. Logistics and Systems Analysis
  • 66.
    66 ©2021 Cengage Learning.All Rights Reserved. May not be scanned, copied or duplicated, or posted to a publicly accessible website, in whole or in part. Logistics and Systems Analysis Short-run and Long-run Analysis Short-run or Static Analysis • Concentrates on a specific point in time or level of production output. Long-run or Dynamic Analysis • Examines a logistics system over a long time period or range of output.
  • 67.
    67 ©2021 Cengage Learning.All Rights Reserved. May not be scanned, copied or duplicated, or posted to a publicly accessible website, in whole or in part. Logistics and Systems Analysis Approaches to Analyzing Logistics Systems The analysis of logistics systems may require different views or perspectives of logistics activities. • Materials management vs. physical distribution − Examine logistics as inbound vs. outbound logistics. • Cost centers − Examine logistics activities as cost centers, allowing tradeoffs between them to be analyzed. • Nodes vs. links − Examine nodes (fixed spatial points where goods stop for storage or processing) vs. links (transportation network that connect the nodes in the logistics system). • Logistics channels − Examine supply chain of network organizations engaged in transfer, storage, handling, communication, and other functions that contribute to product flow.
  • 68.
    68 ©2021 Cengage Learning.All Rights Reserved. May not be scanned, copied or duplicated, or posted to a publicly accessible website, in whole or in part. Summary • Logistics adds place, time, and quantity utilities to products and enhances the form and possession utilities added by manufacturing and marketing. • Key logistics activities are transportation, inventory, warehousing, materials handling, industrial packaging, customer service, and forecasting. • On a macro basis, logistics-related costs have helped the U.S. economy maintain its competitive position on a global basis. • On a micro basis, logistics interface with other functional areas which aids in making organizations more efficient and effective. • The cost of logistics systems can be affected by market competition, spatial relationship of nodes, and product characteristics. • Four approaches to analyzing logistics systems are: materials management vs. physical distribution, cost centers, nodes vs. links, and distribution channels.
  • 69.
    69 ©2021 Cengage Learning.All Rights Reserved. May not be scanned, copied or duplicated, or posted to a publicly accessible website, in whole or in part. Supply Chain Management, 11e Chapter 4: Distribution and Omni- Channel Network Design ©2021 Cengage Learning. All Rights Reserved. May not be scanned, copied or duplicated, or posted to a publicly accessible website, in whole or in part.
  • 70.
    70 ©2021 Cengage Learning.All Rights Reserved. May not be scanned, copied or duplicated, or posted to a publicly accessible website, in whole or in part. Discussion Outline • Drivers of supply chain network redesign • Process of comprehensive supply chain network design • Major locational determinants • Modeling approaches for supply chain network design • Omni-channel network design
  • 71.
    71 ©2021 Cengage Learning.All Rights Reserved. May not be scanned, copied or duplicated, or posted to a publicly accessible website, in whole or in part. Drivers of Supply Chain Network Redesign 1. Changes in global trade patterns 2. Changes in customer service requirements – The emergence of omni-channel supply chains 3. Shifts in customer and/or supply market locations 4. Changes in corporate ownership/merger and acquisition activity 5. Cost pressures 6. Competitive capabilities 7. Corporate organizational change
  • 72.
    72 ©2021 Cengage Learning.All Rights Reserved. May not be scanned, copied or duplicated, or posted to a publicly accessible website, in whole or in part. Macro Perspective on Logistics U.S. Business Logistics Costs Source Figure 4.1: C. John Langley Jr., Ph.D., Penn State University. Used with permission.
  • 73.
    73 ©2021 Cengage Learning.All Rights Reserved. May not be scanned, copied or duplicated, or posted to a publicly accessible website, in whole or in part. Supply Chain Network Design Process Step 1: Define the Supply Chain Network Design Process • Form a supply chain network transformation team. • Establish the parameters and objectives of the network design or redesign process. • Evaluate the potential involvement of third-party suppliers of logistics services.
  • 74.
    74 ©2021 Cengage Learning.All Rights Reserved. May not be scanned, copied or duplicated, or posted to a publicly accessible website, in whole or in part. Supply Chain Network Design Process Step 2: Perform a Supply Chain Audit 1. Fundamental Business Information 2. Logistics/Supply Chain System 3. Key Logistics/Supply Chain Activities 4. Measurement and Evaluation 5. Strategic Logistics/Supply Chain Issues 6. Logistics/Supply Chain Strategic Plan
  • 75.
    75 ©2021 Cengage Learning.All Rights Reserved. May not be scanned, copied or duplicated, or posted to a publicly accessible website, in whole or in part. Supply Chain Network Design Process Step 3: Examine the Supply Chain Network Alternatives • Apply suitable quantitative models to the current logistics system and to the alternatives under consideration. • Identify preliminary supply chain network design solutions consistent with the key objectives identified during the audit phase. • Conduct “what-if” analysis to test the sensitivity of recommended network designs to changes in key variables.
  • 76.
    76 ©2021 Cengage Learning.All Rights Reserved. May not be scanned, copied or duplicated, or posted to a publicly accessible website, in whole or in part. Supply Chain Network Design Process Step 4: Conduct a Facility Location Analysis • Form a location selection team. • Qualitatively and quantitatively analyze the attributes of specific regions and locales. • Identify recommended specific sites for logistics facilities.
  • 77.
    77 ©2021 Cengage Learning.All Rights Reserved. May not be scanned, copied or duplicated, or posted to a publicly accessible website, in whole or in part. Supply Chain Network Design Process Step 5: Make Decisions Regarding Network and Facility Location Evaluate the recommended network and specific sites for logistics facilities (Steps 3 and 4) for consistency with the design criteria identified in Step 1.
  • 78.
    78 ©2021 Cengage Learning.All Rights Reserved. May not be scanned, copied or duplicated, or posted to a publicly accessible website, in whole or in part. Supply Chain Network Design Process Step 6: Develop an Implementation Plan • Develop a “blueprint for change” as a road map for moving from the current supply chain network to the desired new one. • Commit the resources necessary to assure a smooth, timely implementation, and the continuous improvement of the network decisions.
  • 79.
    79 ©2021 Cengage Learning.All Rights Reserved. May not be scanned, copied or duplicated, or posted to a publicly accessible website, in whole or in part. Major Locational Determinants
  • 80.
    80 ©2021 Cengage Learning.All Rights Reserved. May not be scanned, copied or duplicated, or posted to a publicly accessible website, in whole or in part. Broad Geographic and Site-Specific Locational Determinants Global/National/ Regional Determinants • Labor climate • Transportation services and infrastructure • Proximity to markets and customers • Quality of life • Taxes and industrial development incentives • Supplier networks • Land costs and utilities • IT infrastructure • Company preference Site-Specific Determinants • Transportation access − Truck − Air − Rail − Water • Inside/outside metropolitan area • Availability of workforce and needed skill sets • Land costs and taxes • Utilities
  • 81.
    81 ©2021 Cengage Learning.All Rights Reserved. May not be scanned, copied or duplicated, or posted to a publicly accessible website, in whole or in part. Current Trends Governing Site Selection Site Selection • Strategic positioning of inventories (fast-moving, profitable items vs. slower- moving, less-profitable items) • Greater use of “Customer-direct” delivery from manufacturing • Growing use of and need for strategically located cross-docking facilities • Greater emphasis on access to major airports and/or ocean ports for import and export shipments • Greater use of providers of third-party-logistics services
  • 82.
    82 ©2021 Cengage Learning.All Rights Reserved. May not be scanned, copied or duplicated, or posted to a publicly accessible website, in whole or in part. Modeling Approaches for Supply Chain Network Design
  • 83.
    83 ©2021 Cengage Learning.All Rights Reserved. May not be scanned, copied or duplicated, or posted to a publicly accessible website, in whole or in part. A Network Design Model The Challenge of Supply Chain Complexity Source Figure 4.4: SAILS: Strategic Analysis of Integrated Logistics Systems (Manassas, VA: Insight, Inc.): Reproduced by permission.
  • 84.
    84 ©2021 Cengage Learning.All Rights Reserved. May not be scanned, copied or duplicated, or posted to a publicly accessible website, in whole or in part. A Network Design Model Objective and Need for Decision Support Tools Answering network design questions today is virtually impossible without the help of very powerful decision support tools. Classic Objective • Finished goods DCs • Expanded scope & complexity of network design model Today’s Objective • Procurement • Various stages of manufacturing • DCs • Transport flows
  • 85.
    85 ©2021 Cengage Learning.All Rights Reserved. May not be scanned, copied or duplicated, or posted to a publicly accessible website, in whole or in part. Types of Modeling Approaches Modeling Approaches • Optimization Models − Designed to find the “best,” or optimum solution, while recognizing relevant constraints. • Simulation Models − Designed to develop a computer representation of supply chain network & observe changes as cost structures, constraints, and other factors are varied. • Heuristic Models (e.g. grid technique) − Designed to reduce a problem to a manageable size and search automatically through various alternatives in an attempt to find a better solution.
  • 86.
    86 ©2021 Cengage Learning.All Rights Reserved. May not be scanned, copied or duplicated, or posted to a publicly accessible website, in whole or in part. Potential Supply Chain Modeling Pitfalls to Avoid • Inaccurate or incomplete data • Level of detail • Sensitivity analysis • Linearity of transportation costs • Geographic concerns • Time horizon • Use of appropriate analytical techniques • “Fluctuating” model inputs
  • 87.
    87 ©2021 Cengage Learning.All Rights Reserved. May not be scanned, copied or duplicated, or posted to a publicly accessible website, in whole or in part. Omni-Channel Network Design
  • 88.
    88 ©2021 Cengage Learning.All Rights Reserved. May not be scanned, copied or duplicated, or posted to a publicly accessible website, in whole or in part. Omni-Channel Retailing Defined “A direct to consumer (D2C) business model where all sales channels ranging from online, mobile, telephonic, mail order, self-service, and physical retail establishments are aligned and fulfillment processes integrated to provide consumers with a seamless shopping experience in alignment with the company’s brand proposition.” Three Important Elements • Omni-channel strategy must align with the firm’s “go to market” strategy. • The fulfillment processes must be integrated regardless of order entry point. • Ease of shopping” for the consumer is a priority regardless of where or how the order is placed.
  • 89.
    89 ©2021 Cengage Learning.All Rights Reserved. May not be scanned, copied or duplicated, or posted to a publicly accessible website, in whole or in part. Omni-Channel Network Design Marketing Channel vs. Logistics Channel Source Figure 4.7: Robert A. Novack, Ph.D. Used with permission.
  • 90.
    90 ©2021 Cengage Learning.All Rights Reserved. May not be scanned, copied or duplicated, or posted to a publicly accessible website, in whole or in part. Omni-Channel Network Design Cost Consideration Fixed Cost and Variable Cost Consideration: A Rule of Thumb in Channel Design “Assuming that the origin and destination remain the same, the more intermediaries used to deliver the product the higher the fixed cost and the lower the variable cost, and vice versa.”
  • 91.
    91 ©2021 Cengage Learning.All Rights Reserved. May not be scanned, copied or duplicated, or posted to a publicly accessible website, in whole or in part. Omni-Channel Network Design (1 of 2) Customer Order Fulfillment Models • Integrated Fulfillment • Store Fulfillment • Flow-Through Fulfillment • Direct Store Delivery (DSD) • Pool Distribution • Dedicated Fulfillment
  • 92.
    92 ©2021 Cengage Learning.All Rights Reserved. May not be scanned, copied or duplicated, or posted to a publicly accessible website, in whole or in part. Omni-Channel Network Design (2 of 2) Customer Order Fulfillment Models Source Figure 4.9: Robert A. Novack, Ph.D. Used with permission.
  • 93.
    93 ©2021 Cengage Learning.All Rights Reserved. May not be scanned, copied or duplicated, or posted to a publicly accessible website, in whole or in part. Omni-Channel Customer Fulfillment Models Integrated Fulfillment Source Figure 4.10: Robert A. Novack, Ph.D. Used with permission. Integrated fulfillment means the retailer operates one distribution network to service both “bricks-and- mortar” (retail stores) and “clicks-and-mortar” (Internet sites) channels. • Advantages: Low start-up costs for retailers, Workforce efficiency • Disadvantages: Order profile changes, Unavailability of products in eaches, “Fast pick” or broken case operation requirements for unit pick (each pick)
  • 94.
    94 ©2021 Cengage Learning.All Rights Reserved. May not be scanned, copied or duplicated, or posted to a publicly accessible website, in whole or in part. Omni-Channel Customer Fulfillment Models Dedicated Fulfillment Source Figure 4.11: Robert A. Novack, Ph.D. Used with permission. Dedicated fulfillment means the retailer operates two separate distribution networks to service “bricks-and- mortar” (retail stores) and “clicks-and-mortar” (Internet sites). • Advantages: Elimination of most of the disadvantages of integrated fulfillment • Disadvantages: Duplicate facilities and duplicate inventories
  • 95.
    95 ©2021 Cengage Learning.All Rights Reserved. May not be scanned, copied or duplicated, or posted to a publicly accessible website, in whole or in part. Omni-Channel Customer Fulfillment Models Pool Distribution Source Figure 4.12: Robert A. Novack, Ph.D. Used with permission. In pool distribution, small retailers use third party logistics companies, or pool distributors, for store delivery, allowing them to achieve efficiency of a truckload shipment for the line haul and the effectiveness of allowing stores to receive LTL orders on a regular schedule
  • 96.
    96 ©2021 Cengage Learning.All Rights Reserved. May not be scanned, copied or duplicated, or posted to a publicly accessible website, in whole or in part. Omni-Channel Customer Fulfillment Models Direct Store Delivery Source Figure 4.13: Robert A. Novack, Ph.D. Used with permission. Direct store delivery involves a manufacturer delivering its product directly to a retailer’s stores, bypassing the retailer’s distribution network. • Advantages: Reduction of inventory in the distribution network • Disadvantages: Possible reduction of inventory visibility of the products to the retailers, Requirements of close collaboration and agreement between the manufacturer and retailer
  • 97.
    97 ©2021 Cengage Learning.All Rights Reserved. May not be scanned, copied or duplicated, or posted to a publicly accessible website, in whole or in part. Omni-Channel Customer Fulfillment Models Store Fulfillment Source Figure 4.14: Robert A. Novack, Ph.D. Used with permission. In store fulfillment model, the order is placed through the Internet site. The order is sent to the nearest retail store where it is picked and put aside for the customer to pick up or the store can arrange for delivery. • Advantages: Short lead time to the customer, Low start-up costs for the retailer, Returns handled through the retail store, Product available in consumer units • Disadvantages: Reduced control and consistency over order fill, Conflicts between store and Internet order inventories, Requirements of real-time visibility to in-store inventories, Requirements of stores’ space to store and stage products for pickups
  • 98.
    98 ©2021 Cengage Learning.All Rights Reserved. May not be scanned, copied or duplicated, or posted to a publicly accessible website, in whole or in part. Summary • The strategic importance of supply chain network design decision is growing with the increasing globalization of manufacturing, marketing, sourcing, and procurement. • A formal, structured process for network design or redesign is preferable to an informal, unstructured one. • Numerous factors may affect the design of a logistics network and the location of specific facilities within the context of the network. • Principal modeling approaches to gain insight into the topic of supply chain network design include optimization, simulation, and heuristic models. • In an omni-channel environment, many network models exist that can be used to service retail stores and Internet consumers, each of which has its advantages and disadvantages. Trade-offs must be taken into consideration when deciding which network model to use.
  • 99.
    99 ©2021 Cengage Learning.All Rights Reserved. May not be scanned, copied or duplicated, or posted to a publicly accessible website, in whole or in part. Supply Chain Management, 11e Chapter 5: Sourcing Materials and Services ©2021 Cengage Learning. All Rights Reserved. May not be scanned, copied or duplicated, or posted to a publicly accessible website, in whole or in part.
  • 100.
    100 ©2021 Cengage Learning.All Rights Reserved. May not be scanned, copied or duplicated, or posted to a publicly accessible website, in whole or in part. Discussion Outline • Strategic evolution of sourcing process (purchasing, procurement, and strategic sourcing) • Types of purchasing activity and quadrant technique • Strategic sourcing process • Total landed cost concept • E-sourcing, e-procurement, and e-commerce
  • 101.
    101 ©2021 Cengage Learning.All Rights Reserved. May not be scanned, copied or duplicated, or posted to a publicly accessible website, in whole or in part. Strategic Evolution of Sourcing Process (Purchasing, Procurement, and Strategic Sourcing)
  • 102.
    102 ©2021 Cengage Learning.All Rights Reserved. May not be scanned, copied or duplicated, or posted to a publicly accessible website, in whole or in part. Purchasing vs. Procurement vs. Strategic Sourcing Purchasing is an activity that follows conduct of a formal sourcing process, while procurement and strategic sourcing are best described as processes. Strategic Sourcing • Managing procurement priorities such that they are well-aligned with goals and objectives of the supply chain and of the overall organization. Procurement • Managing a broad range of activities within the procurement process (e.g. supplier selection, price negotiation, contract management, supplier performance management). Purchasing • Managing a firm’s acquisition procedures and standards, involving largely transactional activity of the buying of products & services.
  • 103.
    103 ©2021 Cengage Learning.All Rights Reserved. May not be scanned, copied or duplicated, or posted to a publicly accessible website, in whole or in part. Unique Aspects of Strategic Sourcing 1. Consolidation/leveraging of purchasing power 2. Emphasis on value 3. More meaningful supplier relationships 4. Attention directed to process improvement 5. Enhanced teamwork and professionalism 6. Enhanced teamwork and professionalism Source Figure 5.1: C. John Langley Jr., Ph.D., Penn State University, Used with permission.
  • 104.
    104 ©2021 Cengage Learning.All Rights Reserved. May not be scanned, copied or duplicated, or posted to a publicly accessible website, in whole or in part. Strategic Evolution of Sourcing Process Source Figure 5.2: C. John Langley Jr., Ph.D., Penn State University, Used with permission.
  • 105.
    105 ©2021 Cengage Learning.All Rights Reserved. May not be scanned, copied or duplicated, or posted to a publicly accessible website, in whole or in part. Types of Purchasing Activity and Quadrant Technique
  • 106.
    106 ©2021 Cengage Learning.All Rights Reserved. May not be scanned, copied or duplicated, or posted to a publicly accessible website, in whole or in part. Types and Importance of Purchases – The Quadrant Technique Not all items /services purchased are of equal importance, requiring varying procurement strategies based on their value and risk. Source Figure 5.3: C. John Langley Jr., Ph.D., Penn State University, Used with permission.
  • 107.
    107 ©2021 Cengage Learning.All Rights Reserved. May not be scanned, copied or duplicated, or posted to a publicly accessible website, in whole or in part. Three Types of Purchasing Activity Source Figure 5.4: C. John Langley Jr., Ph.D., Penn State University, Used with permission.
  • 108.
    108 ©2021 Cengage Learning.All Rights Reserved. May not be scanned, copied or duplicated, or posted to a publicly accessible website, in whole or in part. Strategic Sourcing
  • 109.
    109 ©2021 Cengage Learning.All Rights Reserved. May not be scanned, copied or duplicated, or posted to a publicly accessible website, in whole or in part. Strategic Sourcing Five Core Principles 1. Assess total value. Emphasis beyond acquisition cost, evaluating total cost of ownership and the value of the supplier relationship. 2. Develop individual sourcing strategies. Individual spend categories need customized sourcing strategies. 3. Evaluate internal requirements. Requirements and specifications thoroughly assessed and rationalized as part of the sourcing process. 4. Focus on supplier economics. Suppliers’ economics understood before identifying buying tactics (e.g. volume leveraging, price unbundling, price adjustment mechanisms). 5. Drive continuous improvement. Strategic sourcing initiatives as subset of continuous improvement process for procurement and sourcing organizations.
  • 110.
    110 ©2021 Cengage Learning.All Rights Reserved. May not be scanned, copied or duplicated, or posted to a publicly accessible website, in whole or in part. Strategic Sourcing Process Source Figure 5.5: C. John Langley Jr., Ph.D., Penn State University, Used with permission.
  • 111.
    111 ©2021 Cengage Learning.All Rights Reserved. May not be scanned, copied or duplicated, or posted to a publicly accessible website, in whole or in part. Strategic Sourcing Process Step 1: Develop Strategic Plan • Create cross-functional planning committee • Identify key members of sourcing team • Agree on scope of sourcing processes
  • 112.
    112 ©2021 Cengage Learning.All Rights Reserved. May not be scanned, copied or duplicated, or posted to a publicly accessible website, in whole or in part. Strategic Sourcing Process Step 2: Understand Spend • Refine understanding of sourcing needs of process-owners, with the nature of the requirement being represented by some type of measurable criteria • Perform spend analysis to: − Understand spend by supplier, category, and internal user − Profile current sourcing approaches and areas for improvement • Address issues of make vs. buy
  • 113.
    113 ©2021 Cengage Learning.All Rights Reserved. May not be scanned, copied or duplicated, or posted to a publicly accessible website, in whole or in part. Strategic Sourcing (1 of 2) Steps 3–5: Supplier Portfolio Screening Source Figure 5.6: C. John Langley Jr., Ph.D., Penn State University, Used with permission.
  • 114.
    114 ©2021 Cengage Learning.All Rights Reserved. May not be scanned, copied or duplicated, or posted to a publicly accessible website, in whole or in part. Strategic Sourcing (2 of 2) Steps 3–5: Supplier Portfolio Screening Source Figure 5.7: C. John Langley Jr., Ph.D., Penn State University, Used with permission.
  • 115.
    115 ©2021 Cengage Learning.All Rights Reserved. May not be scanned, copied or duplicated, or posted to a publicly accessible website, in whole or in part. Strategic Sourcing Process Step 6: Onboarding and Transitioning • Finalize understandings and agreements with suppliers • Create management processes for new suppliers • Conduct transition and onboarding processes
  • 116.
    116 ©2021 Cengage Learning.All Rights Reserved. May not be scanned, copied or duplicated, or posted to a publicly accessible website, in whole or in part. Strategic Sourcing Process Step 7: Collaborative Process Improvement • Regular feedback and communications • Analyze net savings and compare with goals and objectives • Process improvement for both suppliers and customers
  • 117.
    117 ©2021 Cengage Learning.All Rights Reserved. May not be scanned, copied or duplicated, or posted to a publicly accessible website, in whole or in part. Total Landed Cost
  • 118.
    118 ©2021 Cengage Learning.All Rights Reserved. May not be scanned, copied or duplicated, or posted to a publicly accessible website, in whole or in part. Total Landed Cost (TLC) Source Figure 5.8: C. John Langley Jr., Ph.D., Penn State University, Used with permission.
  • 119.
    119 ©2021 Cengage Learning.All Rights Reserved. May not be scanned, copied or duplicated, or posted to a publicly accessible website, in whole or in part. TLC Example: Cost Comparisons of Alternative Sourcing Options Destination Country – Switzerland Country of Origin Price Components – all prices in Euros China Vietnam EU Net purchasing price for a specific volume of the product from 3 different suppliers 10,000 8,000 12,000 Total transportation cost to Switzerland (Ocean freight from China/Vietnam – Road freight within Europe) 4,000 6,000 1,200 Customs according trade agreement 1,000 1,500 n.a. VAT (Switzerland 7.6%) based on value of goods 1,140 1,178 1,003 Total Landed Cost 16,140 16,678 14,203 Source Figure 5.9: Source: C. John Langley Jr., Ph.D., Penn State University, Used with permission.
  • 120.
    120 ©2021 Cengage Learning.All Rights Reserved. May not be scanned, copied or duplicated, or posted to a publicly accessible website, in whole or in part. E-sourcing, E-procurement, and E- commerce
  • 121.
    121 ©2021 Cengage Learning.All Rights Reserved. May not be scanned, copied or duplicated, or posted to a publicly accessible website, in whole or in part. E-sourcing and E-procurement Functionality 1. Industry analysis and supplier identification 2. Analytical tools 3. Management of RFI/RFP processes 4. Process automation 5. Online negotiations 6. Collaboration tools 7. Logistics procurement 8. Project management 9. Knowledge management 10.Contract management Source Figure 5.10: Source: C. John Langley Jr., Ph.D., Penn State University, Used with permission.
  • 122.
    122 ©2021 Cengage Learning.All Rights Reserved. May not be scanned, copied or duplicated, or posted to a publicly accessible website, in whole or in part. Advantages and Concerns of Electronic Procurement Concerns • Cyber-security • Lack of face-to-face contact between the buyer and seller • Technology-related concerns (lack of standard protocols, system reliability, time & money investment) Advantages • Lower operating costs (reduce paperwork & sourcing time, improve control over inventory & spending) • Improve procurement and sourcing efficiency (find new supply sources, improve communications, improve personnel use, lower cycle times) • Reduce procurement prices • Improve communications • Easier access to more suppliers Source Figure 5.11: Source: C. John Langley Jr., Ph.D., Penn State University, Used with permission.
  • 123.
    123 ©2021 Cengage Learning.All Rights Reserved. May not be scanned, copied or duplicated, or posted to a publicly accessible website, in whole or in part. Four Basic Types of E-commerce Business Models • “Sell-side” vs. “buy-side” system: Whether e-Commerce capabilities are seller-centric or buyer-centric. • B2B and B2C: Online businesses selling to businesses or consumers, respectively. These are both “sell- side.” Examples include Delta Air Lines (www.delta.com), Barnes & Noble (www.barnesandnoble.com), Amazon (www.amazon.com), and Office Depot (officedepot.com). • Online marketplace: e-Commerce site where product or service information is provided by multiple third parties, whereas transactions are processed by the marketplace operator. Examples include Amazon (www.amazon.com), Expedia (www.expedia.com), and Uber (www.uber.com). • Online trading community: A system maintained by a 3rd party technology supplier that provides buyers and sellers with a structured method for trading, bartering, or selling goods and services. Examples include eBay (www.ebay.com), Craigslist (www.craigslist.org), and NTE (www.nteinc.com).
  • 124.
    124 ©2021 Cengage Learning.All Rights Reserved. May not be scanned, copied or duplicated, or posted to a publicly accessible website, in whole or in part. Summary • Different procurement and sourcing strategies devised based on the risk and value or profit potential from needed products/services that can be classified into: generics, commodities, distinctives, and criticals. • Strategic sourcing process includes: develop strategic plan, understand spend, evaluate supply sources, finalize sourcing strategy, implement sourcing strategy, transition and onboarding, and collaborative process improvement. • The concept of total landed cost is a highly-valuable element of the overall procurement process. • Advantages of e-sourcing and e-procurement include lower operating costs, improved efficiency, and reduced prices. • Four popular e-commerce model types are: “sell-side” vs. “buy-side;” B2B and B2C; online marketplace; and online trading community.
  • 125.
    125 ©2021 Cengage Learning.All Rights Reserved. May not be scanned, copied or duplicated, or posted to a publicly accessible website, in whole or in part. Supply Chain Management, 11e Chapter 6: Producing Goods and Services ©2021 Cengage Learning. All Rights Reserved. May not be scanned, copied or duplicated, or posted to a publicly accessible website, in whole or in part.
  • 126.
    126 ©2021 Cengage Learning.All Rights Reserved. May not be scanned, copied or duplicated, or posted to a publicly accessible website, in whole or in part. Discussion Outline • The role of production operations in supply chain management • Operations strategy and planning • Production execution decisions • Production metrics • Production technology
  • 127.
    127 ©2021 Cengage Learning.All Rights Reserved. May not be scanned, copied or duplicated, or posted to a publicly accessible website, in whole or in part. Role of Production Operations in SCM
  • 128.
    128 ©2021 Cengage Learning.All Rights Reserved. May not be scanned, copied or duplicated, or posted to a publicly accessible website, in whole or in part. Role of Production Operations in SCM Production Process Functionality Source Figure 6.1: Brian J. Gibson, Ph.D. Used with permission.
  • 129.
    129 ©2021 Cengage Learning.All Rights Reserved. May not be scanned, copied or duplicated, or posted to a publicly accessible website, in whole or in part. Production Tradeoffs 1. Volume vs. Variety 2. Responsiveness vs. Efficiency 3. Production costs vs. Supply chain costs 4. In-house (Make) vs. Outsource (Buy)
  • 130.
    130 ©2021 Cengage Learning.All Rights Reserved. May not be scanned, copied or duplicated, or posted to a publicly accessible website, in whole or in part. Production Tradeoffs Volume vs. Variety in Production Process Decisions Economies of Scale • Higher-volume production with lower cost per unit of output • Suitable in situations where production processes have high fixed costs and equipment. Economies of Scope • Low-volume production with flexible capabilities of producing a wide variety of products • Important in markets characterized by changing customer demand.
  • 131.
    131 ©2021 Cengage Learning.All Rights Reserved. May not be scanned, copied or duplicated, or posted to a publicly accessible website, in whole or in part. Production Tradeoffs Responsiveness vs. Efficiency in Production Facility Decisions Centralized vs. Regional • Centralized production facilities provide operating cost and inventory efficiencies. • Regional production facilities allow companies to be closer to customers and more responsive. Large vs. Small • Larger facilities with excess capacity provide the flexibility to respond to demand spikes. • Smaller facilities that are better utilized are more cost efficient. Product-focused vs. Process-focused • Product-focused facilities performing many processes on a single product type are more responsive. • Process-focused facilities concentrating on a few functions across multiple product types are more efficient at its limited scope of activities.
  • 132.
    132 ©2021 Cengage Learning.All Rights Reserved. May not be scanned, copied or duplicated, or posted to a publicly accessible website, in whole or in part. Production Tradeoffs Production Costs vs. Other Supply Chain Costs Source Figure 6.2: Adapted from Bowersox, Closs, and Cooper, Supply Chain Logistics Management, 4th ed. (Boston, MA: McGraw Hill/Irwin, 2012). Copyright © 2012 by McGraw-Hill. Reproduced by permission of McGraw-Hill Companies, Inc.
  • 133.
    133 ©2021 Cengage Learning.All Rights Reserved. May not be scanned, copied or duplicated, or posted to a publicly accessible website, in whole or in part. Production Tradeoffs In-house (Make) vs. Outsource (Buy) In-house (Make) • Internal production processes are more directly visible. • Internal processes are easier to control from a quality standpoint. Outsource (Buy) • Lower product costs • Free-up resources for other, more strategic needs BUT • More difficult to maintain visibility and synchronize activities. • More difficult to control over quality, intellectual property rights, and customer relationships.
  • 134.
    134 ©2021 Cengage Learning.All Rights Reserved. May not be scanned, copied or duplicated, or posted to a publicly accessible website, in whole or in part. Operations Strategy and Planning
  • 135.
    135 ©2021 Cengage Learning.All Rights Reserved. May not be scanned, copied or duplicated, or posted to a publicly accessible website, in whole or in part. Operations Strategy and Planning Evolution of Production Strategies Source Figure 6.3: Adapted from Manufacturing Strategy: An Adaptive Perspective (Newton Square, PA: SAP AG, 2003).
  • 136.
    136 ©2021 Cengage Learning.All Rights Reserved. May not be scanned, copied or duplicated, or posted to a publicly accessible website, in whole or in part. Operations Strategy and Planning (1 of 2) Production Strategy Challenges Mass Production • Limitation on producer’s responsive-ness • Potential for the bullwhip effect Lean Manufacturing • Difficult to achieve economies of scale • Require technological capabilities to achieve the supply chain visibility and synchronization • Increased risk of disruption
  • 137.
    137 ©2021 Cengage Learning.All Rights Reserved. May not be scanned, copied or duplicated, or posted to a publicly accessible website, in whole or in part. Operations Strategy and Planning (2 of 2) Production Strategy Challenges Flexible Manufacturing • High capital investment • System complexity • Require skilled technician • Require disciplined & high level of planning Adaptive Manufacturing • Require seamless transfer of knowledge and real-time information Smart Manufacturing • Require capabilities of a network with messaging standards • Require analytical toolkit • Require flexible automation
  • 138.
    138 ©2021 Cengage Learning.All Rights Reserved. May not be scanned, copied or duplicated, or posted to a publicly accessible website, in whole or in part. Operations Strategy and Planning Production Planning Source Figure 6.4: Adapted from Wisner, Tan, and Leong, Principles of Supply Chain Management: A Balanced Approach, 5th ed. (Boston, MA: Cengage Learning, 2019). Reproduced by permission.
  • 139.
    139 ©2021 Cengage Learning.All Rights Reserved. May not be scanned, copied or duplicated, or posted to a publicly accessible website, in whole or in part. Production Execution Decisions Assembly Processes Production Process Layout Packaging
  • 140.
    140 ©2021 Cengage Learning.All Rights Reserved. May not be scanned, copied or duplicated, or posted to a publicly accessible website, in whole or in part. Production Execution Decisions Assembly Processes Assembly Processes • Make-to-Stock (MTS) • Make-to-Order (MTO) − Assemble-to-Order (ATO) − Build-to-Order (BTO) − Engineer-to-Order (ETO)
  • 141.
    141 ©2021 Cengage Learning.All Rights Reserved. May not be scanned, copied or duplicated, or posted to a publicly accessible website, in whole or in part. Production Execution Decisions Comparison of Make-to-Order (MTO) Options ATO BTO ETO Level of customization Limited Moderate Total Cost of finished goods Moderate High Very high Order fulfillment speed Days to weeks Weeks to months Month to years Production process complexity Moderate High Extreme Example products Personal computers Automobiles Computer servers Private jets Stadium JumboTron Nuclear power plant Source Table 6.2: Brian J. Gibson, Ph.D. Used with permission.
  • 142.
    142 ©2021 Cengage Learning.All Rights Reserved. May not be scanned, copied or duplicated, or posted to a publicly accessible website, in whole or in part. Production Execution Decisions (1 of 2) Production Process Layout Production process layout involves the arrangement of machines, storage areas, and other resources within the four walls of a manufacturing or an assembly facility. The layout is influenced by a number of factors. • The production strategy and assembly process employed • Product characteristics (weight, fragility, size) • Demand characteristics (volume & variability) • Service commitments • Production mixes • Facility costs
  • 143.
    143 ©2021 Cengage Learning.All Rights Reserved. May not be scanned, copied or duplicated, or posted to a publicly accessible website, in whole or in part. Production Execution Decisions (2 of 2) Production Process Layout Production process layouts generally fit into a spectrum of work flow that moves from projects to continuous processes. Source Figure 6.5: Adapted from Jacobs and Chase, Operation and Supply Chain Management 15th ed. (Boston, MA: McGraw- Hill Irwin, 2018). Reprinted with permission of McGraw-Hill Companies, Inc.
  • 144.
    144 ©2021 Cengage Learning.All Rights Reserved. May not be scanned, copied or duplicated, or posted to a publicly accessible website, in whole or in part. Production Execution Decisions Packaging Well-designed packaging can: (1) Facilitate efficient handling and shipping of the finished goods; (2) Improve labor and facility efficiency (space & equipment utilization); and (3) Provide another level of product differentiation sought by the customer. Key Considerations: • Ease of handling (materials handling & transportation) • Protection of goods in the package • Compatibility with customers’ materials-handling equipment • Information provision to production & logistics personnel • Sustainability
  • 145.
    145 ©2021 Cengage Learning.All Rights Reserved. May not be scanned, copied or duplicated, or posted to a publicly accessible website, in whole or in part. Production Metrics
  • 146.
    146 ©2021 Cengage Learning.All Rights Reserved. May not be scanned, copied or duplicated, or posted to a publicly accessible website, in whole or in part. Establishing Production Metrics Pursue Goals • Align metrics with corporate objectives • Limit the number of metrics used to 5 or 6 per function • Measure performance of individual activities Avoid Mistakes • Using KPIs that are too narrow. • Encouraging wrong outcomes. • Focusing on issues that are not key priorities.
  • 147.
    147 ©2021 Cengage Learning.All Rights Reserved. May not be scanned, copied or duplicated, or posted to a publicly accessible website, in whole or in part. Key Groups of Production Metrics 1. Customer experience and responsiveness 2. Quality 3. Efficiency 4. Inventory 5. Compliance 6. Maintenance 7. Flexibility and innovation 8. Cost and profitability
  • 148.
    148 ©2021 Cengage Learning.All Rights Reserved. May not be scanned, copied or duplicated, or posted to a publicly accessible website, in whole or in part. Production Technology
  • 149.
    149 ©2021 Cengage Learning.All Rights Reserved. May not be scanned, copied or duplicated, or posted to a publicly accessible website, in whole or in part. Manufacturing Execution System Technology that connects, monitors, and controls complex manufacturing systems and data flows on the factory floor. Core Functionality: • Data collection & acquisition • Scheduling • Staff controls • Resource management • Production tracking & dispatch • Product traceability & genealogy • Quality management • Process management • Performance analysis • Document management • Maintenance management
  • 150.
    150 ©2021 Cengage Learning.All Rights Reserved. May not be scanned, copied or duplicated, or posted to a publicly accessible website, in whole or in part. Manufacturing Execution System Benefits Initial 3-12 months • Efficiency gains • Cost reductions • Quality improvements Next 12-36 months • Process improvements • Cycle time & work flow compression • Inventory carrying cost reductions 36 months + • New product development acceleration • Indirect labor cost reduction • Agility & asset utilization improvements
  • 151.
    151 ©2021 Cengage Learning.All Rights Reserved. May not be scanned, copied or duplicated, or posted to a publicly accessible website, in whole or in part. Summary • Process functionality can create a competitive advantage such as: low cost, high quality, fast delivery speed, high delivery reliability, ability to cope with demand change, and the flexibility to offer variety. • Production strategies have advanced from forecast-driven mass production to demand-driven, lean, flexible, adaptive, and smart manufacturing approaches. • Most manufacturers use a combination of make-to-stock and make-to-order (including assemble- to-order, build-to-order, and engineer-to-order) production methods to satisfy demand for their products. • Tradeoffs made regarding production are: volume vs. variety, responsiveness vs. efficiency, in- house vs. outsource, and production costs vs. other supply chain costs and services. • Critical production KPIs address total cost, total cycle time, delivery performance, quality, and safety.
  • 152.
    152 ©2021 Cengage Learning.All Rights Reserved. May not be scanned, copied or duplicated, or posted to a publicly accessible website, in whole or in part. Supply Chain Management, 11e Chapter 7: Demand Management ©2021 Cengage Learning. All Rights Reserved. May not be scanned, copied or duplicated, or posted to a publicly accessible website, in whole or in part.
  • 153.
    153 ©2021 Cengage Learning.All Rights Reserved. May not be scanned, copied or duplicated, or posted to a publicly accessible website, in whole or in part. Discussion Outline • Essence and importance of demand management • Balancing supply and demand • Demand forecasting • Sales and Operations Planning (S&OP) • Collaborative Planning, Forecasting, and Replenishment (CPFR)
  • 154.
    154 ©2021 Cengage Learning.All Rights Reserved. May not be scanned, copied or duplicated, or posted to a publicly accessible website, in whole or in part. Demand Management The Essence of Demand Management • To estimate and manage customer demand and use this information to make operating decisions. • To further ability of firms throughout the supply chain to collaborate on activities related to the flow of products, services, information, and capital. Desired end result: Greater value for the end user or consumer
  • 155.
    155 ©2021 Cengage Learning.All Rights Reserved. May not be scanned, copied or duplicated, or posted to a publicly accessible website, in whole or in part. Demand Management (1 of 4) Importance of Demand Management Common Problems in Demand Management • Lack of coordination between departments • Too much emphasis placed on forecasts of demand, with less attention on the collaborative efforts and plans needed to be developed from the forecasts • Non-strategic uses of demand information
  • 156.
    156 ©2021 Cengage Learning.All Rights Reserved. May not be scanned, copied or duplicated, or posted to a publicly accessible website, in whole or in part. Demand Management (2 of 4) Importance of Demand Management Effective demand management unifies channel members with the common goals of satisfying customers and solving customer problems. 1. Gather & analyze knowledge about consumers, their problems, and their unmet needs. 2. Identify partners to perform functions needed in demand chain. 3. Move functions to the channel member that can perform them most effectively and efficiently. 4. Share with other supply chain members knowledge about customers, technology, and logistics challenges and opportunities. 5. Developing products and services that solve customers’ problems. 6. Develop & execute best methods to deliver products & services to consumers in the desired format.
  • 157.
    157 ©2021 Cengage Learning.All Rights Reserved. May not be scanned, copied or duplicated, or posted to a publicly accessible website, in whole or in part. Demand Management (3 of 4) Importance of Demand Management Effective demand management supports business strategy. STRATEGY EXAMPLES OF HOW TO USE DEMAND MANAGEMENT Growth strategy • Perform “what if” analyses on total industry volume to gauge how specific mergers and acquisitions might leverage market share. • Analyze industry supply/demand to predict changes in product pricing structure and market economics based on mergers and acquisitions. • Build staffing models for merged company using demand data. Portfolio strategy • Manage maturity of products in current portfolio to optimally time overlapping life cycles. • Create new product development/introduction plans based on life cycle. • Balance combination of demand and risk for consistent “cash cows” with demand for new products. • Ensure diversification of product portfolio through demand forecasts. Source Table 7.1: Jim R. Langabeer II, “Aligning Demand Management with Human Strategy,” Supply Chain Management Review (May/June 2000): 58. Copyright © 2000 Reed Business Information, a division of Reed Elsevier. Reproduced by permission.
  • 158.
    158 ©2021 Cengage Learning.All Rights Reserved. May not be scanned, copied or duplicated, or posted to a publicly accessible website, in whole or in part. Demand Management (4 of 4) Importance of Demand Management Effective demand management supports business strategy. STRATEGY EXAMPLES OF HOW TO USE DEMAND MANAGEMENT Positioning strategy • Manage product sales through each channel based on demand and product economics. • Manage positioning of finished goods at appropriate distribution centers, to reduce working capital, based on demand. • Define capability to supply for each channel. Investment strategy • Manage capital investments, marketing expenditures, and research and development budgets based on demand forecasts of potential products and maturity of current products. • Determine whether to add manufacturing capacity. Source Table 7.1: Jim R. Langabeer II, “Aligning Demand Management with Human Strategy,” Supply Chain Management Review (May/June 2000): 58. Copyright © 2000 Reed Business Information, a division of Reed Elsevier. Reproduced by permission.
  • 159.
    159 ©2021 Cengage Learning.All Rights Reserved. May not be scanned, copied or duplicated, or posted to a publicly accessible website, in whole or in part. Balancing Supply and Demand
  • 160.
    160 ©2021 Cengage Learning.All Rights Reserved. May not be scanned, copied or duplicated, or posted to a publicly accessible website, in whole or in part. Balancing Supply and Demand Problem of Supply-Demand Misalignment Source Figure 7.1: Accenture, Stanford University, and Northwestern University, Customer-Driven Demand Networks: Unlocking Hidden Value in the Personal Computer Supply Chain (Accenture, 1997): 15.
  • 161.
    161 ©2021 Cengage Learning.All Rights Reserved. May not be scanned, copied or duplicated, or posted to a publicly accessible website, in whole or in part. Balancing Supply and Demand Supply-Demand Balancing Methods Some combinations of supply-demand balancing methods are used, depending on the nature of the product, the cost of stocking out, and the organization’s ability to properly forecast customer demand. External Balancing Methods Change the manner in which the customer orders: • Price • Lead time Internal Balancing Methods Manage gap using internal processes: • Inventory • Production flexibility
  • 162.
    162 ©2021 Cengage Learning.All Rights Reserved. May not be scanned, copied or duplicated, or posted to a publicly accessible website, in whole or in part. Demand Forecasting Types of Forecast Error Measures Common Forecasting Techniques
  • 163.
    163 ©2021 Cengage Learning.All Rights Reserved. May not be scanned, copied or duplicated, or posted to a publicly accessible website, in whole or in part. Demand Forecasting Demand forecasting is a major component of demand management. Forecasts serve as a plan for both marketing and operations to set goals and develop execution strategies. Two Types of Demand: Most forecasting techniques focus on independent demand. 1. Independent Demand − The demand for the primary item, known as base demand 2. Dependent Demand − The demand directly influenced by demand for independent item
  • 164.
    164 ©2021 Cengage Learning.All Rights Reserved. May not be scanned, copied or duplicated, or posted to a publicly accessible website, in whole or in part. Demand Forecasting Factors Affecting Demand All demand is subject to certain fluctuations. Random fluctuation • A development that cannot be anticipated and is usually the cause to hold safety stocks to avoid stockouts. Trend fluctuation • Gradual increase or decrease in demand over time for an organization. Seasonal fluctuation • Seasonal patterns that will normally repeat themselves during a year for most organizations.
  • 165.
    165 ©2021 Cengage Learning.All Rights Reserved. May not be scanned, copied or duplicated, or posted to a publicly accessible website, in whole or in part. Demand Forecasting (1 of 2) Types of Forecast Error Measures CFE • Cumulative sum of forecast errors (CFE) calculates the total forecast error for a set of data, taking into consideration both negative and positive errors. CFE = 𝑛 𝑡−1 𝑒𝑡 MSE • Mean squared error (MSE) squares each period error so the negative and positive errors do not cancel each other out. MSE = 𝐸𝑡 2 𝑛
  • 166.
    166 ©2021 Cengage Learning.All Rights Reserved. May not be scanned, copied or duplicated, or posted to a publicly accessible website, in whole or in part. Demand Forecasting (2 of 2) Types of Forecast Error Measures MAD • Mean absolute deviation (MAD) takes absolute value of each error, so the negative and positive signs are removed. MAD = | 𝐸𝑡| 𝑛 MAPE MAPE = ( |𝐸𝑡 | 𝐷𝑡)100 𝑛 TRACK Signal • Tracking signal can be used to measure forecast error, especially good at identifying if a “bias” exists in the forecast errors. CFE/MAD
  • 167.
    167 ©2021 Cengage Learning.All Rights Reserved. May not be scanned, copied or duplicated, or posted to a publicly accessible website, in whole or in part. Demand Forecasting (1 of 2) Common Forecasting Techniques All statistical techniques used to generate forecasts require accurate data and rely on the assumption that the future will repeat the past. The key to good forecasting is to minimize forecast error by utilizing a forecasting technique that best fits the nature of the data. Three common forecasting techniques are: Simple moving average • Makes forecasts based on recent demand history and allows for the removal of random effects. • Pros: quick and easy to use • Cons: old demand dropped quickly; not accommodate seasonal, trend, or business cycle influences Weighted moving average • Assigns a weight to each previous period with higher weights usually given to more recent demand. • Pros: allows emphasis on more recent demand as a predictor of future demand. • Cons: not easily accommodate seasonal demand patterns Exponential smoothing • Pros: simplicity and limited requirements for data, good for relatively constant demand • Cons: forecasts will lag actual demand; Not appropriate for highly seasonal demand patterns or patterns with trends
  • 168.
    168 ©2021 Cengage Learning.All Rights Reserved. May not be scanned, copied or duplicated, or posted to a publicly accessible website, in whole or in part. Demand Forecasting (2 of 2) Common Forecasting Techniques Forecast Accuracy Summary (1) BIAS (CFE) (2) MAD (3) MSE (4) MAPE (5) TRACKING SIGNAL Simple moving average + 3,087 731.08 862,696.75 7.43 4.2 Weighted moving average + 1,274 886.2 1,169,415.5 9.03 1.44 Experimental Smoothing - 5,554 520.67 403,033.5 5.52 - 10.67 Source Table 7.6: Robert A. Novack, Ph.D. Used with permission.
  • 169.
    169 ©2021 Cengage Learning.All Rights Reserved. May not be scanned, copied or duplicated, or posted to a publicly accessible website, in whole or in part. Sales and Operations Planning (S&OP)
  • 170.
    170 ©2021 Cengage Learning.All Rights Reserved. May not be scanned, copied or duplicated, or posted to a publicly accessible website, in whole or in part. Sales and Operations Planning (S&OP) Arriving at Internal Consensus Forecast It is necessary for an organization to arrive at a forecast internally that all functional areas agree upon and can execute. A process that can be used to arrive at this consensus forecast is called sales and operations planning (S&OP). Preliminary demand forecast Marketing forecast Financial forecast Distribution forecast Manufacturing forecast S&OP Internal Consensus Forecast
  • 171.
    171 ©2021 Cengage Learning.All Rights Reserved. May not be scanned, copied or duplicated, or posted to a publicly accessible website, in whole or in part. Sales and Operations Planning (S&OP) A Five-Step Process Source Figure 7.2: Thomas F. Wallace, Sales and Operations Planning: The How-To Book, (Cincinnati, OH: T. F. Wallace and Company, 2000): 43. Copyright © 2000 by Thomas F. Wallace. Reproduced by permission.
  • 172.
    172 ©2021 Cengage Learning.All Rights Reserved. May not be scanned, copied or duplicated, or posted to a publicly accessible website, in whole or in part. Collaborative Planning, Forecasting, and Replenishment (CPFR)
  • 173.
    173 ©2021 Cengage Learning.All Rights Reserved. May not be scanned, copied or duplicated, or posted to a publicly accessible website, in whole or in part. Collaborative Planning, Forecasting, and Replenishment (CPFR) Arriving at Inter-Organizational Consensus Forecast Trading partners (retailers, distributors, and manufacturers) use available Internet-based technologies to collaborate on operational planning, allowing them to agree to a single forecast for an item where each partner translates this forecast into a single execution plan. Source Figure 7.3: Larry Smith, “West Marine: A CPFR Success Story,” Supply Chain Management Review (March 2006): 31. Copyright © 2006 Reed Business Information, a division of Reed Elsevier. Reproduced by permission.
  • 174.
    174 ©2021 Cengage Learning.All Rights Reserved. May not be scanned, copied or duplicated, or posted to a publicly accessible website, in whole or in part. Summary • Demand management involves “focused efforts to estimate and manage customers’ demand, with the intention of using this information to shape operating decisions.” • Three common techniques for demand forecast are simple moving average, weighted moving average, and exponential smoothing. Using a forecasting technique that best fits the nature of the data is key to minimize forecast error. • Many forecasts are made across internal functions and throughout the supply chain. − The S&OP process involves participation from sales, operations, and finance to arrive at an internal consensus forecast. − CPFR is a method to allow trading partners in the supply chain to collaboratively develop and agree upon a forecast of sales to enable integrated operational planning and execution.
  • 175.
    175 ©2021 Cengage Learning.All Rights Reserved. May not be scanned, copied or duplicated, or posted to a publicly accessible website, in whole or in part. Supply Chain Management, 11e Chapter 8: Order Management and Customer Service ©2021 Cengage Learning. All Rights Reserved. May not be scanned, copied or duplicated, or posted to a publicly accessible website, in whole or in part.
  • 176.
    176 ©2021 Cengage Learning.All Rights Reserved. May not be scanned, copied or duplicated, or posted to a publicly accessible website, in whole or in part. Discussion Outline • Order management and customer service: Concept and relationships • Order management • Customer Service • Order management influences on customer service • Service recovery
  • 177.
    177 ©2021 Cengage Learning.All Rights Reserved. May not be scanned, copied or duplicated, or posted to a publicly accessible website, in whole or in part. Order Management Concept Two Phases of Order Management Phase 1: Influence and Order • Organization attempts to change the manner by which its customers place orders. Phase 2: Execute the Order • Order receipt − Electronically vs. manually • Order fulfillment − Inventory policy; number & location of warehouses • Order shipments − Transport mode choice
  • 178.
    178 ©2021 Cengage Learning.All Rights Reserved. May not be scanned, copied or duplicated, or posted to a publicly accessible website, in whole or in part. Customer Service Concept Customer service is anything that touches the customer, including all activities that impact information flow, product flow, and cash flow between the organization and its customers. • Customer service as a philosophy − Elevates customer service as an organization-wide commitment. • Customer service as performance measures − Emphasizes customer service as specific performance measures. • Customer service as an activity − Treats customer service as a particular task that an organization must perform.
  • 179.
    179 ©2021 Cengage Learning.All Rights Reserved. May not be scanned, copied or duplicated, or posted to a publicly accessible website, in whole or in part. Relationship between Order Management and Customer Service Source Figure 8.1: Robert A. Novack, Ph.D. Used with permission.
  • 180.
    180 ©2021 Cengage Learning.All Rights Reserved. May not be scanned, copied or duplicated, or posted to a publicly accessible website, in whole or in part. Order Management Influencing the Order: Customer Relationship Management (CRM) Executing the Order: Order Management & Order Fulfillment
  • 181.
    181 ©2021 Cengage Learning.All Rights Reserved. May not be scanned, copied or duplicated, or posted to a publicly accessible website, in whole or in part. Order Management: Influencing Order (1 of 5) Customer Relationship Management The concept behind customer relationship management (CRM) is simple: Align the supplier’s resources with its customers in a manner that increases both customer satisfaction and supplier profits. How? How much? What? When? CRM Maximize the efficiencies of the shipping organization’s logistics network
  • 182.
    182 ©2021 Cengage Learning.All Rights Reserved. May not be scanned, copied or duplicated, or posted to a publicly accessible website, in whole or in part. Order Management: Influencing Order (2 of 5) Customer Relationship Management Four basic steps in the implementation of the CRM process Step 1: Segment the Customer Base by Profitability • Use techniques such as activity-based costing and cost-to-serve (CTS) model Step 2: Identify the Product/Service Package for Each Customer Segment • Determine what each customer segment values in its relationship with the supplier based on feedback from customers and sales representatives Step 3: Develop and Execute the Best Processes • Deliver on customer expectations determined and set in Step 2 Step 4: Measure Performance and Continuously Improve • Determining if (1) the different customer segments are satisfied and (2) the supplier’s overall profitability has improved.
  • 183.
    183 ©2021 Cengage Learning.All Rights Reserved. May not be scanned, copied or duplicated, or posted to a publicly accessible website, in whole or in part. Order Management: Influencing Order (3 of 5) Customer Relationship Management Product/Service Package Examples: Option 1 (most commonly used) Offer the same product/service offering to each customer segment, while varying the product quality or service levels. Pro: Easy for the supplier to manage. Con: Assumes that all customer segments value the same types of supplier offerings. PRODUCT/SERVICE OFFERING CUSTOMER SEGMENT A CUSTOMER SEGMENT B CUSTOMER SEGMENT C Product quality (% defects) Less than 1% 5%–10% 10%–15% Order fill 98% 92% 88% Lead time 3 days 7 days 14 days Delivery time Within 1 hour of request On day requested During week requested Payment terms 4/10 net 30 3/10 net 30 2/10 net 30 Customer service support Dedicated rep Next available rep Through Web site Source Table 8.1: Robert A. Novack, Ph.D. Used with permission.
  • 184.
    184 ©2021 Cengage Learning.All Rights Reserved. May not be scanned, copied or duplicated, or posted to a publicly accessible website, in whole or in part. Order Management: Influencing Order (4 of 5) Customer Relationship Management Product/Service Package Examples: Option 2 Vary the service offerings for each customer segment. Pro: Meet the needs of each segment. Con: Difficult for the supplier to manage. CUSTOMER SEGMENT A Product quality (% defects) Less than 1% Order fill 98% Lead time 3 days Delivery time Within 1 hour of request Payment terms 4/10 net 30 Customer service support Dedicated rep Source Table 8.2: Robert A. Novack, Ph.D. Used with permission.
  • 185.
    185 ©2021 Cengage Learning.All Rights Reserved. May not be scanned, copied or duplicated, or posted to a publicly accessible website, in whole or in part. Order Management: Influencing Order (5 of 5) Customer Relationship Management Product/Service Package Examples: Option 2 Vary the service offerings for each customer segment. Pro: Meet the needs of each segment. Con: Difficult for the supplier to manage. CUSTOMER SEGMENT B Product quality (% defects) 5%–10% Credit hold Less than 48 hours Return policy Up to 10 days after delivery CUSTOMER SEGMENT C Order fill 88% Ordering process Through Web site Source Table 8.2: Robert A. Novack, Ph.D. Used with permission.
  • 186.
    186 ©2021 Cengage Learning.All Rights Reserved. May not be scanned, copied or duplicated, or posted to a publicly accessible website, in whole or in part. Order Management: Influencing Order Activity-Based Costing and Customer Profitability Combining Activity-Based Costing (ABC), customer profitability, and customer segmentation tools to build profitable revenue is a strategy being utilized by an increasing number of organizations today. Source Figure 8.2: Robert A. Novack, Ph.D. Used with permission.
  • 187.
    187 ©2021 Cengage Learning.All Rights Reserved. May not be scanned, copied or duplicated, or posted to a publicly accessible website, in whole or in part. Order Management: Influencing Order ABC and Customer Profitability ABC Example: Flow-Through Costing for a Distribution Center Source Figure 8.4: Robert A. Novack, Ph.D. Used with permission.
  • 188.
    188 ©2021 Cengage Learning.All Rights Reserved. May not be scanned, copied or duplicated, or posted to a publicly accessible website, in whole or in part. Order Management: Influencing Order Customer Profitability Analysis Traditional Customer Profitability Analyses • Start with gross sales less returns and allowances (net sales) and subtract the cost of goods sold to arrive at a gross margin figure. • Provides a general guideline for the profitability of a customer, but falls short on capturing the real costs of serving a customer. Cost-to-Serve Model • Identifies many other cost drivers that are impacted by customers and how they interact with the shipper.
  • 189.
    189 ©2021 Cengage Learning.All Rights Reserved. May not be scanned, copied or duplicated, or posted to a publicly accessible website, in whole or in part. Order Management: Influencing Order Customer Segmentation Source Figure 8.5: Robert A. Novack, Ph.D. Used with permission. • Danger zone segment strategies are: (1) Change the manner in which the customer interacts with the shipper to move the customer to another segment; (2) Charge the customer the actual cost of doing; or (3) Switch the customer to an alternative distribution channel. • Build segment strategies aim to maintain the cost to serve but build net sales value to help drive the customer into the “Protect” segment. • Cost engineer segment strategies aim to find more efficient ways for the customer to interact with the shipper.
  • 190.
    190 ©2021 Cengage Learning.All Rights Reserved. May not be scanned, copied or duplicated, or posted to a publicly accessible website, in whole or in part. Order Management: Executing Order Order-to-Cash (OTC) vs. Replenishment Cycles OTC: Refer to outbound-to- customer shipments. The order to cash (or order cycle) is all of the activities that occur from when an order is received by a seller until the product is received by the buyer, plus the flow of funds back to the seller based on the invoice. Replenishment Cycle: The term replenishment cycle is used more frequently when referring to the acquisition of additional inventory as in materials management. Basically, one organization’s order cycle is another’s replenishment cycle.
  • 191.
    191 ©2021 Cengage Learning.All Rights Reserved. May not be scanned, copied or duplicated, or posted to a publicly accessible website, in whole or in part. Order Management: Executing Order Order-to-Cash (OTC) Cycle Illustration modified from image courtesy of CSCMP”s Supply Chain Quarterly Process D1: The Order to Cash (Process in a Deliver from Stock Environment)
  • 192.
    192 ©2021 Cengage Learning.All Rights Reserved. May not be scanned, copied or duplicated, or posted to a publicly accessible website, in whole or in part. Order Management: Executing Order Length and Variability of the OTC Cycle Source Figure 8.7: Adapted from Douglas M. Lambert and James R. Stock, “Using Advanced Order-Processing Systems to Improve Profitability,” Business (April–June 1982): 26. Copyright © 1982 by Douglas Lambert. Reproduced by permission.
  • 193.
    193 ©2021 Cengage Learning.All Rights Reserved. May not be scanned, copied or duplicated, or posted to a publicly accessible website, in whole or in part. Customer Service
  • 194.
    194 ©2021 Cengage Learning.All Rights Reserved. May not be scanned, copied or duplicated, or posted to a publicly accessible website, in whole or in part. Customer Service The Logistics/Marketing Interface Source Figure 8.8: Adapted from Douglas M. Lambert, The Development of an Inventory Costing Methodology: A Study of the Costs Associated with Holding Inventory (Chicago: National Council of Physical Distribution Management, 1976): 7. Reproduced with permission of Council of Supply Chain Management Professionals. • Marketing Objective: Allocate resources to the marketing mix to maximize long-term profitability of the firm. • Logistics Objective: Minimize total costs, given customer service objective, where: Total costs = Transportation costs + Warehousing costs + Order processing & Information costs + Lot quantity costs + Inventory carrying costs
  • 195.
    195 ©2021 Cengage Learning.All Rights Reserved. May not be scanned, copied or duplicated, or posted to a publicly accessible website, in whole or in part. Customer Service Customer Service and ROI Source Figure 8.9: Robert A. Novack, Ph.D. Used with permission.
  • 196.
    196 ©2021 Cengage Learning.All Rights Reserved. May not be scanned, copied or duplicated, or posted to a publicly accessible website, in whole or in part. Customer Service (1 of 2) Elements of Customer Service From the perspective of logistics, customer service can be viewed as having four distinct dimensions. 1. Time (absolute length of lead time) 2. Dependability (consistent lead time, safe delivery, correct orders) 3. Communications (pretransaction, transaction, & posttransaction) 4. Convenience (flexible logistics service level)
  • 197.
    197 ©2021 Cengage Learning.All Rights Reserved. May not be scanned, copied or duplicated, or posted to a publicly accessible website, in whole or in part. Customer Service (2 of 2) Elements of Customer Service Lead Time Frequency Distribution Example Source Figure 8.10: Robert A. Novack, Ph.D. Used with permission.
  • 198.
    198 ©2021 Cengage Learning.All Rights Reserved. May not be scanned, copied or duplicated, or posted to a publicly accessible website, in whole or in part. Customer Service Performance Measures: SCOR Metrics Level 1 Supply Chain Responsiveness • Order fulfillment cycle time Supply Chain Agility • Upside SC flexibility • Upside SC adaptability • Downside SC adaptability Supply Chain Costs • SC management costs • COGS Supply Chain Asset Management • Cash to cash cycle time • Return on SC fixed assets Supply Chain Reliability • Perfect order
  • 199.
    199 ©2021 Cengage Learning.All Rights Reserved. May not be scanned, copied or duplicated, or posted to a publicly accessible website, in whole or in part. Customer Service Stockout Issues A stockout occurs when desired quantities of finished goods are not available when or where a customer needs them. As a result, one of four possible events might occur. 1. The buyer waits until the product is available. 2. The buyer back-orders the product. 3. The seller loses current revenue. 4. The seller loses a buyer and future revenue.
  • 200.
    200 ©2021 Cengage Learning.All Rights Reserved. May not be scanned, copied or duplicated, or posted to a publicly accessible website, in whole or in part. Order Management Influences on Customer Service
  • 201.
    201 ©2021 Cengage Learning.All Rights Reserved. May not be scanned, copied or duplicated, or posted to a publicly accessible website, in whole or in part. Order Management Influences on Customer Service Linking Order Management Outputs Each of the five major outputs of order management impacts customer service/satisfaction, and the performance of each is determined by the seller’s order management and logistics systems. Source Figure 8.12: Robert A. Novack, Ph.D. Used with permission.
  • 202.
    202 ©2021 Cengage Learning.All Rights Reserved. May not be scanned, copied or duplicated, or posted to a publicly accessible website, in whole or in part. Order Management Influences on Customer Service Product Availability Metrics Product Availability Metrics • Internal Metrics − Item fill rate − Line fill rate • External Metrics − Order fill rate − Perfect order Source Figure 8.13: Robert A. Novack, Ph.D. Used with permission.
  • 203.
    203 ©2021 Cengage Learning.All Rights Reserved. May not be scanned, copied or duplicated, or posted to a publicly accessible website, in whole or in part. Order Management Influences on Customer Service Product Availability Financial Impacts Financial Impact of Order Fill Rate Improvement in order fill results in improvement in cash flow, but might require some type of investment in inventories and/or technology. Source Figure 8.14: Robert A. Novack, Ph.D. Used with permission.
  • 204.
    204 ©2021 Cengage Learning.All Rights Reserved. May not be scanned, copied or duplicated, or posted to a publicly accessible website, in whole or in part. Order Management Influences on Customer Service Order Cycle Time Metric: Customer Wait Time Source Figure 8.15: Robert A. Novack, Ph.D. Used with permission. Often overlooked definition of order cycle time is customer wait time (CWT). CWT includes not only order cycle time but also maintenance time.
  • 205.
    205 ©2021 Cengage Learning.All Rights Reserved. May not be scanned, copied or duplicated, or posted to a publicly accessible website, in whole or in part. Order Management Influences on Customer Service Logistics Operations Responsiveness The concept of logistics operations responsiveness (LOR) examines how well a seller can respond to a buyer’s needs. This “response” can take two forms: • How well a seller can customize its service offerings to the unique requirements of a buyer • How quickly a seller can respond to a sudden change in a buyer’s demand pattern.
  • 206.
    206 ©2021 Cengage Learning.All Rights Reserved. May not be scanned, copied or duplicated, or posted to a publicly accessible website, in whole or in part. Order Management Influences on Customer Service Logistics Operations Responsiveness Metrics Metrics for LOR Flexibility/Adaptability of Process • Delivery Agility Metrics − Upside deliver adaptability − Downside deliver adaptability − Upside deliver flexibility Customization of Product/Service • Customization Metrics − The time it takes the seller to offer a new package for sale in the retailers’ stores.
  • 207.
    207 ©2021 Cengage Learning.All Rights Reserved. May not be scanned, copied or duplicated, or posted to a publicly accessible website, in whole or in part. Order Management Influences on Customer Service Logistics System Information LSI is critical to successful order management and customer service. 1. Pretransaction information is used for planning, 2. Transaction information is used for execution 3. Posttransaction information is used for evaluation. INFORMATION USER TRANSPORTATION ACTIVITY SHIPPER CARRIER RECEIVER Pretransaction P.O. Information Forecasts Equipment Availability BOL Information Forecasts Pickup/Delivery Time Advance Advance Ship Notice Transaction Shipment Status Shipment Status Shipment Status Posttransaction Freight Bill Carrier Performance Proof of Delivery Claim Information Payment Claim Information Carrier Performance Proof of Delivery Claim Information Source Table 8.9: Robert A. Novack, Ph.D. Used with permission.
  • 208.
    208 ©2021 Cengage Learning.All Rights Reserved. May not be scanned, copied or duplicated, or posted to a publicly accessible website, in whole or in part. Order Management Influences on Customer Service Logistics System Information Metrics Most metrics involved with LSI address how accurate and timely the data are to allow a decision to be made or an activity to be performed. Examples • Forecast accuracy (measure accuracy of data on past consumption and predictions on future consumption) • Inventory accuracy (measure accuracy of inventory counts in a distribution center) • Data integrity (measure the quality/accuracy of inputs to an LSI) • EDI compliance (measure how well trading partners are complying with EDI standards when sharing data).
  • 209.
    209 ©2021 Cengage Learning.All Rights Reserved. May not be scanned, copied or duplicated, or posted to a publicly accessible website, in whole or in part. Order Management Influences on Customer Service Postsale Logistics Support and Metrics Two Forms of Postsale Logistics Support (PLS) The management of product returns from the customer to the supplier • For the most part, the PLS that manages product returns is measured by the ease with which a customer can return a product. The delivery and installation of spare parts • Metrics for a PLS that manages spare parts are the same as those used for all products, but availability and time are relatively more critical for spare parts logistics.
  • 210.
    210 ©2021 Cengage Learning.All Rights Reserved. May not be scanned, copied or duplicated, or posted to a publicly accessible website, in whole or in part. Service Recovery
  • 211.
    211 ©2021 Cengage Learning.All Rights Reserved. May not be scanned, copied or duplicated, or posted to a publicly accessible website, in whole or in part. Service Recovery Key Aspects Service recovery requires an organization to realize that mistakes will occur and to have plans in place to fix them. Key Aspects of Service Recovery • Measuring the costs of poor service. • Anticipating the needs for recovery. • Developing employee training and empowerment.
  • 212.
    212 ©2021 Cengage Learning.All Rights Reserved. May not be scanned, copied or duplicated, or posted to a publicly accessible website, in whole or in part. Summary • Order management and customer service are not mutually exclusive; there is a direct and critical relationship between these two concepts. • Two distinct, yet related, aspects of order management are: influencing the customer’s order and executing the customer’s order. − Combining ABC, customer profitability, and customer segmentation tools with CRM allows companies to differentiate their offerings to different customer segments. − Order execution is the buyer-seller interface in the market and directly influences customer service (time, dependability, communications, and convenience). • Five outputs from order management influencing customer service, customer satisfaction, and profitability are: (1) Product availability, (2) Order cycle time, (3) Logistics operations responsiveness, (4) Logistics system information, and (5) Postsale logistics support.
  • 213.
    213 ©2021 Cengage Learning.All Rights Reserved. May not be scanned, copied or duplicated, or posted to a publicly accessible website, in whole or in part. Supply Chain Management, 11e Chapter 9: Managing Inventory in the Supply Chain ©2021 Cengage Learning. All Rights Reserved. May not be scanned, copied or duplicated, or posted to a publicly accessible website, in whole or in part.
  • 214.
    214 ©2021 Cengage Learning.All Rights Reserved. May not be scanned, copied or duplicated, or posted to a publicly accessible website, in whole or in part. Discussion Outline • Importance of inventory in the economy and in the firm • Major types of inventory and reasons for carrying them • Major types of costs associated with inventory • Approaches to managing inventory • Inventory classification
  • 215.
    215 ©2021 Cengage Learning.All Rights Reserved. May not be scanned, copied or duplicated, or posted to a publicly accessible website, in whole or in part. Inventory in the US Economy Image courtesy of qainfotech.com, innorange.fi, studiotheory.net
  • 216.
    216 ©2021 Cengage Learning.All Rights Reserved. May not be scanned, copied or duplicated, or posted to a publicly accessible website, in whole or in part. Inventory in the Firm (1 of 2) 2018 Total Logistics Costs ($ Billion) Carrying Costs—$2.750 Trillion All Business Inventory Interest 192.5 Taxes, Obsolescence, Depreciation, Insurance 148.1 Warehousing 153.1 SUBTOTAL 493.7 Transportation Costs—Motor Carriers Truck—Intercity 688.8 Truck—Local 104.9 SUBTOTAL 773.7 Source Table 9.2: Cresting the Hill4, CSCMP’s Annual State of Logistics Report, 2018. Reproduced with permission of Council of Supply Chain Management Professionals.
  • 217.
    217 ©2021 Cengage Learning.All Rights Reserved. May not be scanned, copied or duplicated, or posted to a publicly accessible website, in whole or in part. Inventory in the Firm (2 of 2) 2018 Total Logistics Costs ($ Billion) Transportation Costs—Other Carriers Railroads 88.4 Water (international 31, domestic 9) 45.7 Oil Pipelines 53.0 Air (international 12, domestic 16) 76.5 SUBTOTAL 263.6 Carrier Support Activities 52.3 Shipper’s Administrative Costs 52.1 TOTAL LOGISTICS COST 1,635.46 Source Table 9.2: Cresting the Hill4, CSCMP’s Annual State of Logistics Report, 2018. Reproduced with permission of Council of Supply Chain Management Professionals.
  • 218.
    218 ©2021 Cengage Learning.All Rights Reserved. May not be scanned, copied or duplicated, or posted to a publicly accessible website, in whole or in part. Major Types of Inventory and Reasons for Carrying Them
  • 219.
    219 ©2021 Cengage Learning.All Rights Reserved. May not be scanned, copied or duplicated, or posted to a publicly accessible website, in whole or in part. Types of Inventory and Rationales 1. Procurement (purchase discounts), production (long production run), and transportation (freight rate discounts) 2. Demand- and supply-side uncertainties 3. Inventory costs associated with goods in motion during transportation time period. 4. Inventory costs associated with goods in process during manufacture or assembly of a complex product. 5. Seasonality in raw materials supply (e.g. production, transportation), in demand for finished product, or in both 6. Inventory hold in anticipation that an unusual event (e.g. strikes, significant price increase, extreme weather)
  • 220.
    220 ©2021 Cengage Learning.All Rights Reserved. May not be scanned, copied or duplicated, or posted to a publicly accessible website, in whole or in part. The Importance of Inventory in Other Functional Areas Objectives of the finance area might obviously conflict with marketing and manufacturing objectives. A more subtle conflict sometimes arises between marketing and manufacturing as the long production runs can cause shortages of some products needed by marketing. • Marketing − In favor of holding sufficient, or extra, inventory to ensure product availability to meet customer needs and new product offerings for continued market growth. • Manufacturing − In favor of long production runs of a single product with minimal changeovers to lower labor and machine costs per unit, resulting in high inventory levels of the product. • Finance − In favor of low inventories to increase inventory turns, reduce liabilities and assets, and increase cash flow to the organization.
  • 221.
    221 ©2021 Cengage Learning.All Rights Reserved. May not be scanned, copied or duplicated, or posted to a publicly accessible website, in whole or in part. Inventory Costs
  • 222.
    222 ©2021 Cengage Learning.All Rights Reserved. May not be scanned, copied or duplicated, or posted to a publicly accessible website, in whole or in part. Inventory Costs Major Types of Costs Emphasis of inventory cost analysis should be placed on the variable components of these costs. Inventory Costs • Inventory Carrying Cost − Inventory carrying costs incurred by inventory at rest and waiting to be used. Four major components: Capital cost, Storage space cost, Inventory service cost, and Inventory risk cost. • Ordering and Setup Cost − Ordering cost refers to expense of placing an order, excluding the cost of the product itself. Setup cost refers to the expense of changing/modifying a production/assembly process to facilitate line changeovers. • Expected Stockout Cost − The cost associated with not having a product/materials available to meet customer/production demand. Most organizations hold safety stock or buffer stock, to minimize the possibility of a stockout and costs of lost sales. • In-transit Inventory Carrying Cost − Generally, carrying inventory in transit costs less than in warehouses. But, in-transit inventory carrying cost becomes especially important on global moves since both distance & time increase.
  • 223.
    223 ©2021 Cengage Learning.All Rights Reserved. May not be scanned, copied or duplicated, or posted to a publicly accessible website, in whole or in part. Inventory Costs Carrying Cost vs. Ordering Cost Ordering cost and carrying cost respond in opposite ways to changes in the number of orders or size of individual orders. Source Figure 9.2: C. John Langley Jr., Ph.D. Used with permission.
  • 224.
    224 ©2021 Cengage Learning.All Rights Reserved. May not be scanned, copied or duplicated, or posted to a publicly accessible website, in whole or in part. Inventory Costs Safety Stocks and Service Levels The higher the service level requirement (lower stockout rate), the higher the inventory level requirement. Source Figure 9.3 C. John Langley Jr., Ph.D. Used with permission.
  • 225.
    225 ©2021 Cengage Learning.All Rights Reserved. May not be scanned, copied or duplicated, or posted to a publicly accessible website, in whole or in part. Approaches to Managing Inventory Fundamental Approaches: Fixed order quantity & Fixed order interval EOQ Additional Approaches: JIT, MRP, DRP, and VMI
  • 226.
    226 ©2021 Cengage Learning.All Rights Reserved. May not be scanned, copied or duplicated, or posted to a publicly accessible website, in whole or in part. Inventory Management Approaches Managing inventory involved four fundamental questions: • How much should inventory be ordered? • When should inventory be ordered? • Where should inventory be held? • What specific line items should be available at specific locations?
  • 227.
    227 ©2021 Cengage Learning.All Rights Reserved. May not be scanned, copied or duplicated, or posted to a publicly accessible website, in whole or in part. Inventory Management Approaches Cost vs. Service Tradeoff Considerations Regardless of the approach selected, inventory decisions must consider the basic tradeoff between cost and service. Source Figure 9.4: Robert A. Novack, Ph.D. Used with permission.
  • 228.
    228 ©2021 Cengage Learning.All Rights Reserved. May not be scanned, copied or duplicated, or posted to a publicly accessible website, in whole or in part. Inventory Management Approaches Key Factors of Difference Inventory management approaches differ in terms of three key factors. Key Factors 1. Dependent vs. Independent demand. Independent demand is unrelated to the demand for other items, while dependent demand is directly related to, or derives from, the demand for another inventory item or product. 2. Pull vs. Push. The “pull” approach relies on customer orders to move product through a logistics system, while the “push” approach uses inventory replenishment techniques in anticipation of demand to move products. 3. System-wide vs. Single-facility solutions. A system-wide approach plans and executes inventory decisions across multiple nodes in the logistics system. A single-facility approach does so for shipments and receipts between a single shipping and receiving point.
  • 229.
    229 ©2021 Cengage Learning.All Rights Reserved. May not be scanned, copied or duplicated, or posted to a publicly accessible website, in whole or in part. Inventory Management Approaches Key Differences Key Factors of Difference EOQ JIT MRP DRP VMI Dependent vs. Independent demand Both Dependent Dependent Independen t Both Pull vs. Push Both Pull Push Push Push System-wide vs. Single- facility solution Single facility Single facility System- wide System- wide Both Inventory Management Approaches
  • 230.
    230 ©2021 Cengage Learning.All Rights Reserved. May not be scanned, copied or duplicated, or posted to a publicly accessible website, in whole or in part. Inventory Management Approaches EOQ Approach Two basic forms of the economic order quantity (EOQ) model Fixed Order Quantity • Involves ordering a fixed amount of product each time reordering takes place. • Also called two-bin model. Fixed Order Interval • Involves ordering inventory at fixed or regular intervals. • Also called the fixed period or fixed review period approach. • Generally, the amount ordered depends on how much is in stock and available at the time of review.
  • 231.
    231 ©2021 Cengage Learning.All Rights Reserved. May not be scanned, copied or duplicated, or posted to a publicly accessible website, in whole or in part. Inventory Management Approaches (1 of 3) Fixed Order Quantity EOQ Approach: Condition of Certainty In fixed order quantity EOQ model, inventory is reordered when the amount on hand reaches the reorder point. The reorder point quantity depends on the time it takes to get the new order and on the demand for the item during this lead time. Source Figure 9.5: John J. Coyle, DBA. Used with permission.
  • 232.
    232 ©2021 Cengage Learning.All Rights Reserved. May not be scanned, copied or duplicated, or posted to a publicly accessible website, in whole or in part. Inventory Management Approaches (2 of 3) Fixed Order Quantity EOQ: Condition of Certainty Given the assumptions, the simple EOQ model considers only 2 basic types of cost: inventory carrying cost and ordering cost. Source Figure 9.11: C. John Langley Jr., Ph.D. Used with permission. Basic assumptions of the simple EOQ model • Continuous, constant, and known rate of demand • Constant and known replenishment or lead time • All demand is satisfied. • Constant price or cost that is independent of the order quantity • No inventory in transit • One item of inventory or no interaction between items • Infinite planning horizon • Unlimited capital
  • 233.
    233 ©2021 Cengage Learning.All Rights Reserved. May not be scanned, copied or duplicated, or posted to a publicly accessible website, in whole or in part. Inventory Management Approaches (3 of 3) Fixed Order Quantity EOQ: Condition of Certainty Because several factors can influence the reliability of demand (or usage rate) and lead time, the fixed order quantity model is adjusted by reformulating the reorder point to allow for safety stock. Source Figur 9.12e: John J. Coyle, DBA. Used with permission.
  • 234.
    234 ©2021 Cengage Learning.All Rights Reserved. May not be scanned, copied or duplicated, or posted to a publicly accessible website, in whole or in part. Inventory Management Approaches (1 of 2) Additional Approaches: Just-in-Time (JIT) JIT systems are designed to manage lead times and eliminate waste. Many JIT systems place a high priority on short, consistent lead times. However, the length of the lead time is not as important as the reliability of the lead time. EOQ vs. JIT: Attitudes and Behaviors FACTOR EOQ JIT Inventory Asset Liability Safety stock Yes No Production runs Long Short Setup times Amortize Minimize Lot sizes EOQ 1 for 1 Queues Eliminate Necessary Lead times Tolerate Shorten Quality inspection Important parts 100% process Suppliers/customers Adversaries Partners Supply sources Multiple Single Employees Instruct Involve Source Table 9.18: Adapted from William M. Boyst, III, “JIT American Style,” Proceedings of the 1988 Conference of the American Production & Inventory Control Society (APICS, 1988): 468. Reproduced by permission.
  • 235.
    235 ©2021 Cengage Learning.All Rights Reserved. May not be scanned, copied or duplicated, or posted to a publicly accessible website, in whole or in part. Inventory Management Approaches (2 of 2) Additional Approaches: Just-in-Time (JIT) • JIT commitment to short, consistent lead times and to minimizing or eliminating inventories is JIT principal differentiator from the more traditional approaches. • JIT saves money on downstream inventories by placing greater reliance on improved responsiveness and flexibility. • Successful JIT applications: − Place a high priority on efficient and dependable manufacturing processes. − Demand effective and dependable communications & information systems, and high-quality, consistent transportation services.
  • 236.
    236 ©2021 Cengage Learning.All Rights Reserved. May not be scanned, copied or duplicated, or posted to a publicly accessible website, in whole or in part. Inventory Management Approaches (1 of 3) Additional Approaches: Materials Requirements Planning (MRP) MRP deals specifically with supplying materials and component parts whose demand depends on the demand for a specific end product. 1. Ensure the availability of materials, components, and products for planned production and for customer delivery. 2. Maintain the lowest possible inventory levels that support service objectives. 3. Plan manufacturing activities, delivery schedules, and purchasing activities.
  • 237.
    237 ©2021 Cengage Learning.All Rights Reserved. May not be scanned, copied or duplicated, or posted to a publicly accessible website, in whole or in part. Inventory Management Approaches (2 of 3) Additional Approaches: MRP An MRP system is designed to translate a master production schedule into time-phased net inventory requirements and the planned coverage of such requirements for each component item needed to implement this schedule. Source Figures 9.15 and 9.16: John J. Coyle, DBA. Used with permission.
  • 238.
    238 ©2021 Cengage Learning.All Rights Reserved. May not be scanned, copied or duplicated, or posted to a publicly accessible website, in whole or in part. Inventory Management Approaches (3 of 3) Additional Approaches: MRP Principal advantages of MRP-based systems • Maintain reasonable safety stock levels & minimize or eliminate inventories whenever possible. • Identify process problems and potential supply chain disruptions before they occur, allowing necessary corrective actions. • Base production schedules on actual demand and forecasts of independent demand items. • Coordinate materials ordering across multiple points in a firm’s logistics network. • Suitable for batch, intermittent assembly, or project processes. Principal shortcomings of MRP-based systems • Computer-intensive applications, making changes difficult once the system is in operation. • Might increase ordering and transportation costs as firms moving toward a more coordinated system of ordering product in smaller amounts. • Not as sensitive to short-term fluctuations in demand as order point approaches • Frequently become quite complex and sometimes do not work exactly as intended.
  • 239.
    239 ©2021 Cengage Learning.All Rights Reserved. May not be scanned, copied or duplicated, or posted to a publicly accessible website, in whole or in part. Inventory Management Approaches Additional Approaches: Distribution Requirements Planning (DRP) DRP systems accomplish for outbound shipments what MRP accomplishes for inbound shipments. DRP determines replenishment schedules between a firm’s manufacturing facilities and its distribution centers. DRP is usually coupled with MRP systems to manage the flow and timing of both inbound materials and outbound finished goods. COLUMBUS DISTRIBUTION CENTER—DISTRIBUTION RESOURCE PLANNING CHICKEN NOODLE: Current BOH = 4.314; Q = 3,800; SS = 1,956; LT = 1 Q = Quantity; SS = Safety stock; LT = Lead time WEEK JAN. 1 2 3 4 FEB. 5 6 7 8 MAR. 9 Forecast 974 974 974 974 989 1,002 1,002 1,002 1,061 Sched. Receipt 0 0 3,800 0 0 0 3,800 0 0 BOH—Ending 3,340 2,366 5,192 4,218 3,229 2,227 5,025 4,023 2,962 Planned Order 0 3,800 0 0 0 3,800 0 0 3,800 Actual Order Source Table 9.20: A. J. Stenger, “Distribution Resources Planning,” Penn State University, class example.
  • 240.
    240 ©2021 Cengage Learning.All Rights Reserved. May not be scanned, copied or duplicated, or posted to a publicly accessible website, in whole or in part. Inventory Management Approaches Additional Approaches: Vendor-Managed Inventory (VMI) Vendor-managed inventory manages inventories OUTSIDE a firm’s logistics network, specifically inventories held in its customer’s distribution centers. How VMI Works 1. The supplier and its customer agree on which products are to be managed using VMI in the customer’s distribution centers. 2. An agreement is made on reorder points and economic order quantities for each of these products. 3. As these products are shipped from the customer’s distribution center, the customer notifies the supplier, by SKU, of the volumes shipped on a real-time basis. 4. The supplier monitors on-hand inventories in the customer’s distribution center, and when the on-hand inventory reaches the agreed-upon reorder point, the supplier creates an order for replenishment, notifies the customer’s distribution center of the quantity and time of arrival, and ships the order to replenish the distribution center.
  • 241.
    241 ©2021 Cengage Learning.All Rights Reserved. May not be scanned, copied or duplicated, or posted to a publicly accessible website, in whole or in part. Inventory Management Approaches Additional Approaches: VMI Principal advantages of VMI systems • The knowledge gained by the supplier of real-time inventory levels of its products at its customer locations allows the shipper more time to react to sudden swings in demand to assure that stockouts do not occur. Principal shortcomings of VMI systems • Suppliers’ uses of VMI to push excess inventory to a customer distribution center at the end of the month in order to meet monthly sales quotas, resulting in the customer holding extra inventory, adding costs to its operations.
  • 242.
    242 ©2021 Cengage Learning.All Rights Reserved. May not be scanned, copied or duplicated, or posted to a publicly accessible website, in whole or in part. Inventory Management Approaches Inventory Management Techniques in the Logistics Network Many organizations today use all of the techniques shown in managing inventories in their logistics networks. In general, as an inventory technique manages inventory closer to the point of real demand (e.g. VMI and CPFR), forecast accuracy increases, forecast cycles decrease, and product availability increases. Source Figure 9.19: Robert A. Novack, Ph.D. Used with permission.
  • 243.
    243 ©2021 Cengage Learning.All Rights Reserved. May not be scanned, copied or duplicated, or posted to a publicly accessible website, in whole or in part. Inventory Classification
  • 244.
    244 ©2021 Cengage Learning.All Rights Reserved. May not be scanned, copied or duplicated, or posted to a publicly accessible website, in whole or in part. Inventory Classification Techniques Multiple product lines and inventory control require organizations to focus on more important inventory items and use more sophisticated and effective approaches to inventory management. ABC Analysis ABC classification technique assigns inventory items to one of three groups according to the relative impact or value of the items that make up the group. A items are considered to be the most important, B items lesser importance, and C items least important. Pareto’s Law (The “80–20” Rule) Pareto’s Law “80–20” rule suggests that a relatively small percentage of inventory might account for a large percentage of the overall impact or value. Quadrant Model Quadrant model classifies finished goods inventories using value and risk to the firm as the criteria. Value is measured as the value contribution to profit; risk is the negative impact of not having the product available when it is needed.
  • 245.
    245 ©2021 Cengage Learning.All Rights Reserved. May not be scanned, copied or duplicated, or posted to a publicly accessible website, in whole or in part. Inventory Classification ABC Classification Source Figure 9.20: John J. Coyle, DBA. Used with permission. In many ABC analyses, a common mistake is to think of the B and C items as being far less important than the A items. However, all items in the A, B, and C categories are important to some extent and each category deserves its own strategy to assure availability at an appropriate level of cost (stockout cost vs. inventory carrying cost).
  • 246.
    246 ©2021 Cengage Learning.All Rights Reserved. May not be scanned, copied or duplicated, or posted to a publicly accessible website, in whole or in part. Inventory Classification Quadrant Model Items with high value and high risk (critical items) need to be managed carefully to ensure adequate supply. Items with low risk and low value (generic or routine items) can be managed much less carefully. Source Figure 9.21: Robert A. Novack, Ph.D. Used with permission.
  • 247.
    247 ©2021 Cengage Learning.All Rights Reserved. May not be scanned, copied or duplicated, or posted to a publicly accessible website, in whole or in part. Summary (1 of 2) • Principal types of inventory are: cycle stock, work-in-process, inventory in transit, safety stock, seasonal stock, and anticipatory stock. • Principal types of inventory costs are: inventory carrying, ordering and setup, expected stockout, and in-transit inventory. • Four major components of inventory carrying costs are: Capital cost, Storage space cost, Inventory service cost, and Inventory risk cost. • Choosing appropriate inventory model considers three key differences: Independent vs. dependent demand, Push vs. pull distribution system, and system-wide vs. specific facility decisions.
  • 248.
    248 ©2021 Cengage Learning.All Rights Reserved. May not be scanned, copied or duplicated, or posted to a publicly accessible website, in whole or in part. Summary (2 of 2) • Two basic forms of the EOQ model are the fixed quantity model and the fixed interval model. The former is the most widely used. • JIT model aims to minimize inventory levels, emphasizing frequent deliveries of smaller quantities and alliances with suppliers or customers. • MRP and DRP are typically used in conjunction to manage the flow and timing of both inbound materials and outbound finished goods. • VMI is used to manage a firm’s inventories in its customers’ distribution centers. • Inventory classification is vital initial step toward efficient inventory management.
  • 249.
    249 ©2021 Cengage Learning.All Rights Reserved. May not be scanned, copied or duplicated, or posted to a publicly accessible website, in whole or in part. Supply Chain Management, 11e Chapter 10: Distribution—Managing Fulfillment Operations ©2021 Cengage Learning. All Rights Reserved. May not be scanned, copied or duplicated, or posted to a publicly accessible website, in whole or in part.
  • 250.
    250 ©2021 Cengage Learning.All Rights Reserved. May not be scanned, copied or duplicated, or posted to a publicly accessible website, in whole or in part. Discussion Outline • Roles and functionality • Trade-offs and challenges • Planning and strategy • Execution • Metrics • Technology
  • 251.
    251 ©2021 Cengage Learning.All Rights Reserved. May not be scanned, copied or duplicated, or posted to a publicly accessible website, in whole or in part. Roles & Functionality
  • 252.
    252 ©2021 Cengage Learning.All Rights Reserved. May not be scanned, copied or duplicated, or posted to a publicly accessible website, in whole or in part. The Role of Distribution Operations in SCM 1. Enhance customer service 2. Balance supply & demand 3. Protect against uncertainty 4. Allow quantity purchase discounts 5. Support production requirements 6. Fulfill omni-channel demand 7. Promote transport economies
  • 253.
    253 ©2021 Cengage Learning.All Rights Reserved. May not be scanned, copied or duplicated, or posted to a publicly accessible website, in whole or in part. Distribution Facility Functionality Distribution Facility Functionality • Primary Functions 1. Accumulation 2. Sortation 3. Allocation 4. Assortment • Value-Adding Roles − Examples: Assembly, kitting, product postponement, sequencing
  • 254.
    254 ©2021 Cengage Learning.All Rights Reserved. May not be scanned, copied or duplicated, or posted to a publicly accessible website, in whole or in part. Distribution Facility Functionality Primary Functions: Accumulation The DC serves as a collection point for product coming from multiple origins and provides required transfer, storage, or processing services, allowing firms to consolidate orders and shipments for production and fulfillment processes. Source Figure 10.1: Brian J. Gibson, Ph.D. Used with permission.
  • 255.
    255 ©2021 Cengage Learning.All Rights Reserved. May not be scanned, copied or duplicated, or posted to a publicly accessible website, in whole or in part. Distribution Facility Functionality Primary Functions: Sortation and Allocation Sortation • Sortation focuses on assembling like products together for storage in the distribution facility, processing or transfer to customers. • Proper sortation is essential for effective inventory & order fulfillment. Allocation • Allocation focuses on matching available inventory to customer orders for an SKU. • This break-bulk capacity promotes product availability for multiple customers and in desired quantities.
  • 256.
    256 ©2021 Cengage Learning.All Rights Reserved. May not be scanned, copied or duplicated, or posted to a publicly accessible website, in whole or in part. Distribution Facility Functionality Primary Functions: Assortment Assortment involves the assembly of customer orders for multiple SKUs held in the distribution facility. This mixing capability avoids the expenses related to placing numerous orders and having them shipped from a variety of locations. Source Figure 10.2: Brian J. Gibson, Ph.D. Used with permission.
  • 257.
    257 ©2021 Cengage Learning.All Rights Reserved. May not be scanned, copied or duplicated, or posted to a publicly accessible website, in whole or in part. Distribution Facility Functionality Value-Adding Roles • Light assembly services • Inventory management and visibility • Product kitting, bundling, and unbundling • Product postponement • Production sequencing • Quality control • Recycling, repair, and returns management
  • 258.
    258 ©2021 Cengage Learning.All Rights Reserved. May not be scanned, copied or duplicated, or posted to a publicly accessible website, in whole or in part. Trade-offs and Challenges
  • 259.
    259 ©2021 Cengage Learning.All Rights Reserved. May not be scanned, copied or duplicated, or posted to a publicly accessible website, in whole or in part. Key Distribution Tradeoffs Functional Tradeoffs How to best balance customer service and costs. • Warehouse • Transportation • Inventory • Customer service Facility-Level Tradeoffs How to best balance financial and performance. • Space • Equipment • People
  • 260.
    260 ©2021 Cengage Learning.All Rights Reserved. May not be scanned, copied or duplicated, or posted to a publicly accessible website, in whole or in part. Key Distribution Tradeoffs Functional Tradeoffs Source Figure 10.3: Brian J. Gibson, Ph.D. Used with permission.
  • 261.
    261 ©2021 Cengage Learning.All Rights Reserved. May not be scanned, copied or duplicated, or posted to a publicly accessible website, in whole or in part. Key Distribution Tradeoffs Facility-Level Tradeoffs • Space vs. Equipment. The larger the facility and the more space used for distribution operations; the more equipment will be needed in the facility. • Equipment vs. People. The greater the use of equipment to automate materials handling and distribution activity, the lower the labor requirements of a facility. • People vs. Space. The larger the facility workforce, the larger the facility size and throughput possible.
  • 262.
    262 ©2021 Cengage Learning.All Rights Reserved. May not be scanned, copied or duplicated, or posted to a publicly accessible website, in whole or in part. Key Distribution Challenges Labor Availability Issues • Historically low U.S. unemployment rates • Nature of DC operations work creates ongoing turnover challenge • Smaller labor pool due to aging workforce • Solution: DC automation and assistive technology Demand Variation • Seasonal demand creates space and equipment utilization challenges, as well as labor retention problem. • Solution: Third party logistics facility use during peak season, shared capacity with seasonal products that have alternate primary selling seasons Increasing Customer Requirements • Strong desire for value- added capabilities and services. • Growing expectations for faster, smaller, and more frequent order fulfillment. • Solution: Flexible fulfillment processes
  • 263.
    263 ©2021 Cengage Learning.All Rights Reserved. May not be scanned, copied or duplicated, or posted to a publicly accessible website, in whole or in part. Planning and Strategy
  • 264.
    264 ©2021 Cengage Learning.All Rights Reserved. May not be scanned, copied or duplicated, or posted to a publicly accessible website, in whole or in part. Distribution Planning and Strategy Distribution strategies should tailor to products being handled, customer requirements, and available internal expertise and resources. A series of interrelated planning decisions must be made to ensure that the strategy can be executed at a reasonable cost while supporting supply chain demands. Source Figure 10.4: Brian J. Gibson, Ph.D. Used with permission.
  • 265.
    265 ©2021 Cengage Learning.All Rights Reserved. May not be scanned, copied or duplicated, or posted to a publicly accessible website, in whole or in part. Distribution Planning and Strategy Cross-Docking: Low-Tech Option Source Figure 10.5: Brian J. Gibson, Ph.D. Used with permission.
  • 266.
    266 ©2021 Cengage Learning.All Rights Reserved. May not be scanned, copied or duplicated, or posted to a publicly accessible website, in whole or in part. Distribution Planning and Strategy Cross-Docking: High-Tech Options Source Figure 10.5: Brian J. Gibson, Ph.D. Used with permission.
  • 267.
    267 ©2021 Cengage Learning.All Rights Reserved. May not be scanned, copied or duplicated, or posted to a publicly accessible website, in whole or in part. Distribution Planning and Strategy Network Design Issues: Number & Location Source Figure 10.6: Edward J. Bardi, Ph.D. Used with permission. • Determining the number of facilities needed for a supply chain involves the evaluation of cost tradeoffs with other functional areas. • Effective location selection requires analysis of the DC’s intended function, sources and volume of supply, customer locations and demand patterns, and related fulfillment costs.
  • 268.
    268 ©2021 Cengage Learning.All Rights Reserved. May not be scanned, copied or duplicated, or posted to a publicly accessible website, in whole or in part. Distribution Planning and Strategy (1 of 2) Network Design Issues: Ownerships Decisions on facility ownerships – private facilities, public facilities, or contract facilities – should be made based on the organization’s expertise vs. scope of tasks required & financial resources relative to the number and size of facilities needed. Source Figure 10.7: Edward J. Bardi, Ph.D. Used with permission.
  • 269.
    269 ©2021 Cengage Learning.All Rights Reserved. May not be scanned, copied or duplicated, or posted to a publicly accessible website, in whole or in part. Distribution Planning and Strategy (2 of 2) Network Design Issues: Ownerships Factors Affecting Distribution Facility Ownership Firm Characteristics Favors Private Distribution Favors 3PL Distribution Throughput volume Higher Lower Demand variability Stable Fluctuating Market density Higher Lower Special physical control needs Yes No Security requirements Higher Lower Customer service requirements Higher Lower Multiple use needs Yes No Source Table 10.2: Brian J. Gibson, Ph.D. Used with permission.
  • 270.
    270 ©2021 Cengage Learning.All Rights Reserved. May not be scanned, copied or duplicated, or posted to a publicly accessible website, in whole or in part. Distribution Planning and Strategy Facility Considerations: Size • Typically, the more facilities in the distribution network, the smaller they need to be. • Demand forecasts for the facility can be used to create a rough estimate of space requirements. • Given forecasted demand, each facility must be large enough to: − Accommodate the distribution activities that will be performed within the four walls. − Interface with the transportation network.
  • 271.
    271 ©2021 Cengage Learning.All Rights Reserved. May not be scanned, copied or duplicated, or posted to a publicly accessible website, in whole or in part. Distribution Planning and Strategy Facility Considerations: Layout The company must make decisions regarding aisle space, shelving, materials-handling equipment, and interior dimensions of the facility. Facility Layout Principle Benefit Use a one-story facility  Provides more usable space per investment dollar  Results in lower construction costs Use vertical capacity  Reduces building footprint and land requirements Minimize aisle space  Provides more storage and processing capacity Use direct product flows  Avoids backtracking and costly travel time Deploy warehouse automation solutions  Improves facility productivity and safety  Reduces travel time  Reduces labor needs Use an appropriate product storage plan  Maximizes space utilization and product protection Source Table 10.3: Brian J. Gibson, Ph.D. Used with permission.
  • 272.
    272 ©2021 Cengage Learning.All Rights Reserved. May not be scanned, copied or duplicated, or posted to a publicly accessible website, in whole or in part. Distribution Planning and Strategy Facility Considerations: Product Location (Slotting) Slotting is defined as the placement of product in a facility for the purpose of optimizing materials-handling and space efficiency. Commonly Used Criteria 1. Popularity. Locate high volume (popular) items near the shipping area and the low volume (unpopular) items away from the shipping area. 2. Unit size. Locate small-size items (cubic dimensions) near the shipping area and larger-size items farther away from the shipping area. 3. Cube. Locate the items with smaller total cubic space requirements (item cube multiplied by the number of items held) near the shipping area and those with larger space requirements farther away from the shipping area.
  • 273.
    273 ©2021 Cengage Learning.All Rights Reserved. May not be scanned, copied or duplicated, or posted to a publicly accessible website, in whole or in part. Distribution Planning and Strategy Facility Considerations: Slotting Proper product slotting can improve fulfillment performance and generate other advantages for the organization & its customers. • Picking productivity • Efficient replenishment • Work balancing • Load building • Picking accuracy • Ergonomics • Pre-consolidation
  • 274.
    274 ©2021 Cengage Learning.All Rights Reserved. May not be scanned, copied or duplicated, or posted to a publicly accessible website, in whole or in part. Execution
  • 275.
    275 ©2021 Cengage Learning.All Rights Reserved. May not be scanned, copied or duplicated, or posted to a publicly accessible website, in whole or in part. Distribution Execution Product-Handling Functions Source Figure 10.8: Brian J. Gibson, Ph.D. Used with permission.
  • 276.
    276 ©2021 Cengage Learning.All Rights Reserved. May not be scanned, copied or duplicated, or posted to a publicly accessible website, in whole or in part. Distribution Execution Order Picking Best Practices For many organizations, order picking is the most labor-intensive and expensive distribution activity, often accounting for more than half of DC operating costs. Principle Best Practices Minimize travel time  Sequence pick patterns for single trip  Use batch picking or zone picking Maximize time spent picking product  Eliminate paperwork  Store like items near each other Facilitate accurate order picking  Provide clean, well-lit work areas  Identify all pick locations clearly  Require location validation during picking Leverage materials-handling equipment  Use carousels and AS/RS systems  Deploy conveyors and shuttle systems Minimize idle time  Slot fast-moving inventory for easy access  Use time standards for picking operations  Maintain inventory in pick slots Source Table 10.4: Adapted from Gwynne Richards, Warehouse Management: A Complete Guide to Improving Efficiency and Minimizing Cost in the Modern Warehouse , 3 rd Edition, (London England: Kogan Page, 2018), Chapter 5; WIQ Editor, “Order Picking Strategies for a Warehouse,” Warehouse IQ (April 20, 2017). Retrieved June 24, 2019 from https://www.warehouseiq.com/order-picking-strategies-warehouse/; and, “Tips for Improving Warehouse Efficiency,” Cherry’s Industrial Equipment (August 27, 2018). Retrieved June 24, 2019 from https://www.material-handling.com/blogs/improve-picking-efficiency/.
  • 277.
    277 ©2021 Cengage Learning.All Rights Reserved. May not be scanned, copied or duplicated, or posted to a publicly accessible website, in whole or in part. Distribution Execution Support Functions Support functions provide coordination between key processes and across the supply chain, protect the organization’s inventory investment, and improve working conditions within the facility. Key support functions • Inventory control • Safety, maintenance, and sanitation • Security • Performance analysis • Information technology
  • 278.
    278 ©2021 Cengage Learning.All Rights Reserved. May not be scanned, copied or duplicated, or posted to a publicly accessible website, in whole or in part. Metrics
  • 279.
    279 ©2021 Cengage Learning.All Rights Reserved. May not be scanned, copied or duplicated, or posted to a publicly accessible website, in whole or in part. Distribution Metrics Customer service aspects of distribution performance should target order accuracy, completeness, and timeliness. Customer-Facing Metrics Calculation Unit Fill Rate Total units shipped / Total units ordered Case Fill Rate Total cases shipped / Total cases ordered Order Value Fill Rate Total value shipped / Total value ordered Order Accuracy Total correct units shipped / Total units shipped Document Accuracy Total correct customer invoices / Total customer invoices On Time Dispatch Total orders ready by deadline / Total orders dispatched Perfect Order Index Complete Order % x Damage-Free % x Billing Accuracy % x On-Time Dispatch % Source Table 10.5: Brian J. Gibson, Ph.D. Used with permission.
  • 280.
    280 ©2021 Cengage Learning.All Rights Reserved. May not be scanned, copied or duplicated, or posted to a publicly accessible website, in whole or in part. Distribution Metrics Key elements of distribution performance address the efficiency, utilization, and productivity of operations Distribution Operation Metrics Calculation Distribution cost per unit Total distribution cost/Total number of units processed Distribution cost ratio Total distribution cost/Total cost of goods sold Capacity utilization Total storage slots used/Total storage slots available Equipment utilization Total operational time/Total time available Labor productivity Total number of cases processed/Total hours paid Distribution efficiency Task completion time/Standard time allowed Source Table 10.6: Brian J. Gibson, Ph.D. Used with permission.
  • 281.
    281 ©2021 Cengage Learning.All Rights Reserved. May not be scanned, copied or duplicated, or posted to a publicly accessible website, in whole or in part. Technology
  • 282.
    282 ©2021 Cengage Learning.All Rights Reserved. May not be scanned, copied or duplicated, or posted to a publicly accessible website, in whole or in part. Distribution Technology Warehouse Management Systems (WMS) • Core software used to manage fulfillment processes, with value-added capabilities, including labor management, automated data collection, task interleaving, fulfillment flexibility, and systems convergence. Automatic Identification (Auto-ID) Tools • Auto-ID technologies help machines identify objects. Examples: Bar codes, smart cards, voice recognition, biometric technologies, radio-frequency identification (RFID). Source Figure 10.9: Courtesy of GS1 https://www.gs1.org/standards/barcodes/databar. Used with permission.
  • 283.
    283 ©2021 Cengage Learning.All Rights Reserved. May not be scanned, copied or duplicated, or posted to a publicly accessible website, in whole or in part. Distribution Technology The increasing use of technology and automation in distribution operations requires a new breed of warehouse control systems (WCS) and warehouse execution systems (WES) to supplement traditional WMS.
  • 284.
    284 ©2021 Cengage Learning.All Rights Reserved. May not be scanned, copied or duplicated, or posted to a publicly accessible website, in whole or in part. Summary • Four primary functions of distribution facilities are: Accumulation, Sortation, Allocation, and Assortment. • Value-adding roles of distribution facilities complement the primary functions and support evolving supply chain needs. • Distribution strategy and planning involves decisions regarding capability requirements, network design issues, and facility considerations. • Distribution execution involves five primary processes related to the handling and storage of product: (1) receiving, (2) put-away, (3) order picking, (4) replenishment, and (5) shipping. • Distribution KPIs address asset utilization, labor productivity, cost efficiency of the operation, and customer service quality.
  • 285.
    285 ©2021 Cengage Learning.All Rights Reserved. May not be scanned, copied or duplicated, or posted to a publicly accessible website, in whole or in part. Supply Chain Management, 11e Chapter 11: Transportation—Managing the Flow of the Supply Chain ©2021 Cengage Learning. All Rights Reserved. May not be scanned, copied or duplicated, or posted to a publicly accessible website, in whole or in part.
  • 286.
    286 ©2021 Cengage Learning.All Rights Reserved. May not be scanned, copied or duplicated, or posted to a publicly accessible website, in whole or in part. Discussion Outline • The role of transportation in SCM • Modes of transportation • Transportation planning and strategy • Transportation execution and control • Transportation technology
  • 287.
    287 ©2021 Cengage Learning.All Rights Reserved. May not be scanned, copied or duplicated, or posted to a publicly accessible website, in whole or in part. The Role of Transportation in SCM Transportation Spend Transportation accounts for nearly $1.04 trillion of the $1.6 trillion spent on U.S. business logistics costs in 2018. That’s 63% of the total!
  • 288.
    288 ©2021 Cengage Learning.All Rights Reserved. May not be scanned, copied or duplicated, or posted to a publicly accessible website, in whole or in part. The Role of Transportation in Supply Chain Management (SCM) Transportation provides the critical links between organizations in a supply chain network, permitting goods to flow between their facilities. Transportation also influences supply chain design, strategy development, and total cost management.
  • 289.
    289 ©2021 Cengage Learning.All Rights Reserved. May not be scanned, copied or duplicated, or posted to a publicly accessible website, in whole or in part. The Role of Transportation in SCM Role Inhibitors • Offshore manufacturing • Changing customer requirements • Transportation capacity constraints • Transportation rate variation • Growing governmental requirements
  • 290.
    290 ©2021 Cengage Learning.All Rights Reserved. May not be scanned, copied or duplicated, or posted to a publicly accessible website, in whole or in part. The Role of Transportation in SCM Transportation Challenges In 2018 Major transportation challenges • Qualified driver availability – 56% • Rising customer expectations – 48% • managerial talent retention – 48% • Service capacity availability – 45% • Technology deployment cost – 42% • Operating cost volatility – 34% By 2030 The single most important challenge • Rising customer expectations – 23% • Technology deployment cost – 16% • Qualified driver availability – 13% • Operating cost volatility – 13% • Capacity availability – 10%
  • 291.
    291 ©2021 Cengage Learning.All Rights Reserved. May not be scanned, copied or duplicated, or posted to a publicly accessible website, in whole or in part. Modes of Transportation
  • 292.
    292 ©2021 Cengage Learning.All Rights Reserved. May not be scanned, copied or duplicated, or posted to a publicly accessible website, in whole or in part. Modes of Transportation Five Basic and Intermodal The five basic modes of transportation and intermodal transportation each has different economic and technical structures, and each can provide different qualities of link service. Freight Shipments within the US (2019) Mode of Transportation Value of Goods Tons (Millions) Ton-Miles (Billions) Truck 69.3% 65.7% 39.6% Rail 4.6% 10.4% 27.9% Water 2.6% 4.2% 6.9% Air 3.0% <1% <1% Pipeline 7.4% 16.4% 17.5% Multiple modes 12.3% 2.7% 7.8% Other/Unknown <1% <1% <1% Source Table 11.1: U.S. Department of Transportation Bureau of Transportation Statistics, 2019 Pocket Guide to Transportation (2019):19.
  • 293.
    293 ©2021 Cengage Learning.All Rights Reserved. May not be scanned, copied or duplicated, or posted to a publicly accessible website, in whole or in part. Modes of Transportation (1 of 2) Motor Carriers • Motor carriage is the most widely used mode of transportation in the US domestic supply chain, and is useful for shipping goods to an adjacent countries like Canada and Mexico. • Much of the freight moved by the trucking industry is regional in nature, moving within a 500-mile radius of the origin. • Multiple equipment types and sizes allow motor carriers to transport a wide variety of commodities and shipment sizes. • Trucking is a high-variable-cost, low-fixed-cost business.
  • 294.
    294 ©2021 Cengage Learning.All Rights Reserved. May not be scanned, copied or duplicated, or posted to a publicly accessible website, in whole or in part. Modes of Transportation (2 of 2) Motor Carriers The trucking industry is highly competitive, comprising of 543,061 interstate carriers and intrastate hazardous materials carriers that range in size from single-truck, owner-operator service providers to conglomerate like UPS. Key challenges: Labor, costs, and competition Motor Carrier Industry • For-Hire (54%) − Truckload (TL) – Less-than-Truckload (LTL) – Small Package • Private (36%) • For-Hire/Private Hybrid (9%) • Others (1%)
  • 295.
    295 ©2021 Cengage Learning.All Rights Reserved. May not be scanned, copied or duplicated, or posted to a publicly accessible website, in whole or in part. Modes of Transportation (1 of 2) Railroads • Railroads is a high ton-mile mode of transportation, moving nearly 1.8 billion tons of freight with average shipment length of 554 miles annually. • Railroad transportation is primarily used for the long-distance movement of low- value goods. Railroads also handle some high-value goods, primarily automobiles and intermodal containers. • Railroads cost structure consists of high fixed costs in proportion to variable costs due to a large investment in terminals, equipment, and trackage. • Rail equipment can be organized into loads and transported in one of the three primary ways: mixed trains, unit trains, and intermodal trains.
  • 296.
    296 ©2021 Cengage Learning.All Rights Reserved. May not be scanned, copied or duplicated, or posted to a publicly accessible website, in whole or in part. Modes of Transportation (2 of 2) Railroads There are 600 railroads in the US, but the industry is dominated by seven Class I railroads. No single rail carrier services the entire country. Carriers use interline agreements to provide coast-to-coast rail service. Key challenges: Captive shippers’ demand for rate relief, external factors e.g. fluctuating economic conditions & severe weather events, and capacity. • 600 Freight Rail Carriers − 7 Class-I Linehaul Freight Carriers (BNSF, Canadian National, Canadian Pacific, CSX, Kansas City Southern, Norfolk Southern, Union Pacific) − 593 Shortline Carriers
  • 297.
    297 ©2021 Cengage Learning.All Rights Reserved. May not be scanned, copied or duplicated, or posted to a publicly accessible website, in whole or in part. Modes of Transportation (1 of 2) Air Carriers • Air cargo transportation is specialized mode in terms of tonnage with U.S. spending at $76.5 billion in 2018. • Air transportation is used to ship small quantities of high-value, low-weight goods. • The air carrier cost structure consists of high variable costs in proportion to fixed costs.
  • 298.
    298 ©2021 Cengage Learning.All Rights Reserved. May not be scanned, copied or duplicated, or posted to a publicly accessible website, in whole or in part. Modes of Transportation (2 of 2) Air Carriers Key challenges: Decreased demand for products previously moved in large volume via air, mode-shifting of freight from air to ocean, new rail connections in Asia, near-shoring and on- shoring strategies. Air Carriers • Combination Carriers • Air Cargo Carriers − Integrated carriers (e.g. FedEx and UPS) provide door-to-door service, scheduled pickup and delivery windows, and expedited service through their hub-and-spoke networks. − Nonintegrated carriers provide on-demand, air-only service from airport to airport.
  • 299.
    299 ©2021 Cengage Learning.All Rights Reserved. May not be scanned, copied or duplicated, or posted to a publicly accessible website, in whole or in part. Modes of Transportation (1 of 2) Water Carriers • Globally, water carriers dominate all other modes, garnering approximately half of the international freight revenue and handling nearly all tonnage. • The international ocean fleet includes approximately 53,000 merchant ships: 16,958 general cargo ships, 14,929 tankers, 11,379 bulk cargo ships, and 5,152 containerships. • Domestic water carriers compete with railroads for long-distance movement of low-value, high-density, bulk cargoes. • The fleet of U.S. flagged fleet moves 6.9 percent of the nation’s freight value. • Water transportation is a high variable cost business.
  • 300.
    300 ©2021 Cengage Learning.All Rights Reserved. May not be scanned, copied or duplicated, or posted to a publicly accessible website, in whole or in part. Modes of Transportation (2 of 2) Water Carriers Key challenges: Significant overcapacity in the container shipping sector, congestion at major ports and transfer points for containers, schedule reliability of liner service lagging behind other modes. Water Carriers. Widely used specialized ships include: containerships, bulk carriers, tankers, general cargo ships, roll-on/roll-off (RO-RO) vessels. • Private • For-Hire − Liner services − Charter services
  • 301.
    301 ©2021 Cengage Learning.All Rights Reserved. May not be scanned, copied or duplicated, or posted to a publicly accessible website, in whole or in part. Modes of Transportation (1 of 2) Pipelines • The United States has the largest network of energy pipelines of any nation in the world. • Pipelines is the most economical form of transport with the lowest cost per ton of any mode. • Pipelines handled 5.6 percent of U.S. freight tonnage, the vast majority of products moved are liquids and gases. • Pipeline costs are predominantly fixed as pipeline operators must build their own right-of-way. • The oil system is made up of three primary types of pipelines: gathering lines, trunk lines, and refined product pipelines. • The major difference of natural gas pipeline network from that of oil is the direct delivery of natural gas to homes & businesses via local distribution lines.
  • 302.
    302 ©2021 Cengage Learning.All Rights Reserved. May not be scanned, copied or duplicated, or posted to a publicly accessible website, in whole or in part. Modes of Transportation (2 of 2) Pipelines Key challenges: Network capacity, Health and environmental safety Pipeline Carriers • For-Hire − For-hire carriers of liquid products can move different products through their system at the same time. • Private − Private carriers include petroleum & natural gas companies that use pipelines to move product to and from their facilities. Companies, like a power plant or a chemical plant, may operate a small pipeline system to move fuel or feed-stocks.
  • 303.
    303 ©2021 Cengage Learning.All Rights Reserved. May not be scanned, copied or duplicated, or posted to a publicly accessible website, in whole or in part. Modes of Transportation (1 of 2) Intermodal Intermodal transportation service refers to uses of two or more carriers of different modes in the origin-to-destination movement of freight. Primary Benefits • Greater accessibility • Overall cost efficiency without sacrificing service quality or accessibility • Global trade facilitation Importance & Volume Growth • Number of containers flowing through North American ports reached 65 million TEUs in 2017 • U.S. rail system moved 14.5 million containers in 2018 Growth Drivers • Development of standardized containers • Better information systems • New generations of ocean vessels, railcars, and truck trailers
  • 304.
    304 ©2021 Cengage Learning.All Rights Reserved. May not be scanned, copied or duplicated, or posted to a publicly accessible website, in whole or in part. Modes of Transportation (2 of 2) Intermodal The freight services provided by intermodal transportation can be viewed in terms of product-handling characteristics or the type of service used. • Product-Handling Characteristics − Containerized freight is loaded into or onto storage equipment at the origin and delivered to the destination in or on that same piece of equipment with no additional handling. − Transload freight involves goods that are handled and transferred between transportation equipment and mode multiple times. • Type of Service Used − Pick up − Linehaul − Delivery
  • 305.
    305 ©2021 Cengage Learning.All Rights Reserved. May not be scanned, copied or duplicated, or posted to a publicly accessible website, in whole or in part. Transportation Planning & Strategy
  • 306.
    306 ©2021 Cengage Learning.All Rights Reserved. May not be scanned, copied or duplicated, or posted to a publicly accessible website, in whole or in part. Transportation Planning and Strategy Framework of Transportation Management Planning Activities Source Figure 11.3: Brian J. Gibson, Ph.D. Used with permission.
  • 307.
    307 ©2021 Cengage Learning.All Rights Reserved. May not be scanned, copied or duplicated, or posted to a publicly accessible website, in whole or in part. Transportation Planning and Strategy Functional Control of Transportation In most organizations, responsibility for transportation decisions falls to one or more of the following departments: logistics, procurement, and marketing. • Inbound − Inbound transportation typically controlled by the purchasing department • Outbound − Outbound transportation typically controlled by marketing or logistics Often, this decision-making structure leads to missed opportunities to generate transportation efficiencies and service improvements.
  • 308.
    308 ©2021 Cengage Learning.All Rights Reserved. May not be scanned, copied or duplicated, or posted to a publicly accessible website, in whole or in part. Transportation Planning and Strategy (1 of 2) Terms of Sale: Freight Control & Payment Terms Terms of sale clarify the delivery and payment terms agreed upon by a seller and buyer. Wise selection of these terms is critical as the decision determines where the buyer’s responsibilities begin and where the seller’s responsibilities end. FOB TERM AND FREIGHT PAYMENT RESPONSIBILITY WHO OWNS GOODS IN TRANSIT? WHO HANDLES FREIGHT CLAIMS? WHO SELECTS AND PAYS CARRIER? WHO ULTIMATELY BEARS FREIGHT COSTS? BEST USED WHEN _____ HAS GREATER INFLUENC E WITH CARRIER FOB Origin, Freight Collect Buyer Buyer Buyer Buyer Buyer FOB Origin, Freight Prepaid Buyer Buyer Seller Seller Seller Source Table 11.4: Adapted from DSI Freight Shipping, FOB Definition.: Shipping Terms of Sale. (Updated January 21, 2013). Retrieved July 2, 2019 from https://www.dsi-tms.com/hs-fs/hub/1987/file-18496826- pdf/docs/fob_definition.pdf
  • 309.
    309 ©2021 Cengage Learning.All Rights Reserved. May not be scanned, copied or duplicated, or posted to a publicly accessible website, in whole or in part. Transportation Planning and Strategy (2 of 2) Terms of Sale: Freight Control & Payment Terms FOB Origin, Freight Prepaid & Charged Back Buyer Buyer Seller Buyer. The seller adds freight costs to goods invoice. Seller FOB Destination, Freight Prepaid Seller Seller Seller Seller Seller FOB Destination, Freight Collect Seller Seller Buyer Buyer Buyer FOB Destination, Freight Collect & Allowed Seller Seller Buyer Seller. The buyer deducts freight cost from goods payment. Buyer Source Table 11.4: Adapted from DSI Freight Shipping, FOB Definition.: Shipping Terms of Sale. (Updated January 21, 2013). Retrieved July 2, 2019 from https://www.dsi-tms.com/hs-fs/hub/1987/file-18496826- pdf/docs/fob_definition.pdf
  • 310.
    310 ©2021 Cengage Learning.All Rights Reserved. May not be scanned, copied or duplicated, or posted to a publicly accessible website, in whole or in part. Transportation Planning and Strategy Terms of Sale: Incoterms 2010 Source Figure 11.4: Johnatas Montezuma, Incoterms 2010. Retrieved July 9, 2019 from https://internationalcommercialterms.guru/
  • 311.
    311 ©2021 Cengage Learning.All Rights Reserved. May not be scanned, copied or duplicated, or posted to a publicly accessible website, in whole or in part. Transportation Planning and Strategy Decision to Outsource Transportation The organization with FOB freight control and procurement responsibility must analyze and choose between using a private fleet (the “make” option) and using external service providers to move freight (the “buy” option). Private Fleet • Account for nearly half of all U.S. freight transportation spending & more than half of miles traveled. • A well-run private fleet can operate at costs competitive with for-hire carriers while providing greater scheduling flexibility and control over transit time. • Intangible benefits: Promotional impact and prestige of having highly visible company trucks on the road External Service Providers • For-hire carriers. Using for-hire carriers avoids large capital cost of starting a private fleet, time needed to build transportation expertise, and challenges inherent in operating a private fleet. • 3PLs. Provide a wide array of transportation services: (1) dedicated contract carriage, (2) traffic management, (3) specialized international freight 3PLs, notably International Freight Forwarders (IFF), Non Vessel-owning Common Carriers (NVOCC), and Customs Brokers
  • 312.
    312 ©2021 Cengage Learning.All Rights Reserved. May not be scanned, copied or duplicated, or posted to a publicly accessible website, in whole or in part. Transportation Planning and Strategy (1 of 2) Modal Selection: Capabilities, Product Characteristics & Pricing MODE STRENGTHS LIMITATIONS PRIMARY ROLE PRIMARY PRODUCT CHARACTERISTICS EXAMPLE PRODUCTS Truck • Accessible • Fast and versatile • Customer service • Limited capacity • High cost • Move smaller shipments in local, regional, and national markets • High value • Finished goods • Low volume • Food • Clothing • Electronics • Furniture Rail • High capacity • Low cost • Accessibility • Inconsistent service • Damage rates • Move large shipments of domestic freight long distances • Low value • Raw materials • High volume • Coal/coke • Lumber/paper • Grain • Chemicals Source Table 11.5: Brian J. Gibson, Ph.D. Used with permission.
  • 313.
    313 ©2021 Cengage Learning.All Rights Reserved. May not be scanned, copied or duplicated, or posted to a publicly accessible website, in whole or in part. Transportation Planning and Strategy (2 of 2) Modal Selection: Capabilities, Product Characteristics & Pricing Air • Speed • Freight protection • Flexibility • Accessibility • High cost • Low capacity • Move urgent shipments of domestic freight and smaller shipments of international freight • High value • Finished goods • Low volume • Time sensitive • Computers • Periodicals • Pharmaceuticals • E-commerce deliveries Water • High capacity • Low cost • International capabilities • Slow • Accessibility • Move large domestic shipments via rivers and canals • Move large shipments of international freight via oceans • Low value • Raw materials • Bulk commodities • Containerized finished goods • Crude oil • Ores/minerals • Farm products • Clothing • Electronics • Toys Pipeline • In-transit storage • Efficiency • Low cost • Slow • Limited network • Move large volumes of domestic freight long distances • Low value • Liquid commodities • Not time sensitive • Crude oil • Petroleum • Gasoline • Natural gas Source Table 11.5: Brian J. Gibson, Ph.D. Used with permission.
  • 314.
    314 ©2021 Cengage Learning.All Rights Reserved. May not be scanned, copied or duplicated, or posted to a publicly accessible website, in whole or in part. Transportation Planning and Strategy Modal Selection: Performance Ratings of Modes Mode of Transportation CRITERIA TRUCK AIR RAIL WATER PIPELINE Accessibility* 1 3 2 4 5 Transit time* 2 1 3 4 5 Reliability* 2 3 4 5 1 Security* 3 2 4 5 1 Cost** 4 5 3 2 1 Accessibility* 1 3 2 4 5 Source Figure 11.6: Edward J. Bardi, Ph.D. Used with permission. *1 = Best to 5 = Worst **1 = Lowest cost to 5 = Highest cost
  • 315.
    315 ©2021 Cengage Learning.All Rights Reserved. May not be scanned, copied or duplicated, or posted to a publicly accessible website, in whole or in part. Transportation Planning and Strategy (1 of 2) Carrier Selection Modal Selection vs. Carrier Selection • Number of options available − Modal selection: more options − Carrier selection: fewer options • Frequency of the decision − Modal selection: more long range − Carrier selection: more active & frequent Carrier Selection Factors • Geographic coverage • Transit time average and reliability • Freight rates • Equipment availability and capacity • Product protection
  • 316.
    316 ©2021 Cengage Learning.All Rights Reserved. May not be scanned, copied or duplicated, or posted to a publicly accessible website, in whole or in part. Transportation Planning and Strategy (2 of 2) Carrier Selection • Core carrier strategy. Carrier selection strategy commonly focuses on concentrating the transportation buy with a limited number of quality carriers, while striving to a carrier-friendly “shipper of choice.” • Advantages − Helps the organization leverage its purchasing dollars for lower overall rates. − Allows the company to focus its attention on other supply chain issues. − Promotes strong relationships with the carriers that produce mutual understanding of requirements, coordination of processes, and service improvement. − Give a company priority access to the carriers’ limited capacity.
  • 317.
    317 ©2021 Cengage Learning.All Rights Reserved. May not be scanned, copied or duplicated, or posted to a publicly accessible website, in whole or in part. Transportation Planning and Strategy Rate Negotiations BUYERS Key negotiation issues: Equipment availability, freight rates, and service levels CARRIERS Key negotiation issues: Volume commitments, shipment frequencies, origin–destination combinations, freight characteristics, and related cost issues NEGOTIATION APPROACHES Adversarial Approach Seeks to minimize transportation cost regardless of the impact on carrier financial performance or long-term viability. Collaborative Approach Focuses on developing contracts with carriers for a tailored set of transportation services at rates that fairly compensate the carriers.
  • 318.
    318 ©2021 Cengage Learning.All Rights Reserved. May not be scanned, copied or duplicated, or posted to a publicly accessible website, in whole or in part. Transportation Execution & Control
  • 319.
    319 ©2021 Cengage Learning.All Rights Reserved. May not be scanned, copied or duplicated, or posted to a publicly accessible website, in whole or in part. Transportation Execution and Control • Shipment Preparation • Freight Documentation • Maintain In-Transit Visibility • Transportation Metrics • Monitor Service Quality
  • 320.
    320 ©2021 Cengage Learning.All Rights Reserved. May not be scanned, copied or duplicated, or posted to a publicly accessible website, in whole or in part. Transportation Execution and Control Freight Documentation Source Figure 11.5: Brian J. Gibson, Ph.D. Used with permission.
  • 321.
    321 ©2021 Cengage Learning.All Rights Reserved. May not be scanned, copied or duplicated, or posted to a publicly accessible website, in whole or in part. Transportation Execution and Control Common Transportation Metrics METRIC FORMULA TYPICAL TARGET On-time Delivery Total on-time deliveries / Total deliveries > 95% Transit Time Average Sum of transit times / Total deliveries Low variation around goal Damage Rate Total units damaged / Total units shipped < 1% Shortage Rate Total units lost or stolen / Total units shipped < 1% Billing accuracy Total accurate freight bills / Total freight bills > 99% Perfect Delivery Index On-Time % × Damage-Free % × Billing Accuracy % > 95% Source Table 11.7: Brian J. Gibson, Ph.D. Used with permission.
  • 322.
    322 ©2021 Cengage Learning.All Rights Reserved. May not be scanned, copied or duplicated, or posted to a publicly accessible website, in whole or in part. Transportation Execution and Control Performance Scorecard PERFORMANCE CRITERIA WEIGHT FACTOR PERFORMANCE EVALUATION PERFORMANCE EVALUATION POTENTIAL SCORE CRITERIA SCORE On-time delivery 8 >98% = 5 96.01−98% = 4 94.01−96% = 3 92.01−94% = 2 <92% = 0 40 Loss and damage rate 5 <0.5% = 5 0.5−1% = 4 1–1.5% = 3 1.5−2% = 2 >2% = 0 25 Billing accuracy 3 >99% = 5 97−99% = 3 95−96% = 1 <95% = 0 15 Equipment condition 2 Safe & clean = 5 Poor condition = 0 10 Customer service 2 Superior = 5 Good = 4 Average = 3 Fair = 2 Unacceptable = 0 10 Total Score 100 Source Table 11.8: Brian J. Gibson, Ph.D. Used with permission.
  • 323.
    323 ©2021 Cengage Learning.All Rights Reserved. May not be scanned, copied or duplicated, or posted to a publicly accessible website, in whole or in part. Transportation Technology
  • 324.
    324 ©2021 Cengage Learning.All Rights Reserved. May not be scanned, copied or duplicated, or posted to a publicly accessible website, in whole or in part. Transportation Technology Buyers and Carriers Transportation buyers and managers leverage a variety of tools and technologies to support supply chain success. The carrier community relies on technology to coordinate the flow of customer freight. Buyers • Individual applications e.g. load planning optimization, freight rating, and load tendering • Integrated supply chain tools e.g. global trade management software, and transportation management systems (TMS) Carriers • Routing and load planning tools promoting optimization of pickup, linehaul, and delivery • Dispatching software facilitating management of drivers, in-transit visibility, & regulatory compliance. • Brokerage solutions helping to match loads with available capacity and transaction financial manage • Tracking and communication technology supporting visibility and control of freight • Others e.g. pricing strategy, documentation
  • 325.
    325 ©2021 Cengage Learning.All Rights Reserved. May not be scanned, copied or duplicated, or posted to a publicly accessible website, in whole or in part. Transportation Technology Transportation Management System (TMS) 1. Order ready to ship 2. Enter order info into cerasis rater 3. Integrate for order info automation 4. Hold freight services auction & choose the best carrier 5. Generate a bill of lading 6. Electronically request a shipment pickup 7. Automatically notify all parties 8. Electronically exchange shipping documents 9. Robust reporting and analytics 10.Shipments will be automatically allocated to carriers
  • 326.
    326 ©2021 Cengage Learning.All Rights Reserved. May not be scanned, copied or duplicated, or posted to a publicly accessible website, in whole or in part. Summary • Four Transportation is the largest logistics cost in most supply chains that directly impacts fulfillment speed and service quality. • Fulfillment of supply chain demand can be accomplished through five modal options or the intermodal use of these options. • Most commercial freight moves under contractual rates that are negotiated directly between freight buyers and transportation companies. • Organizations must continue to manage freight after it has been tendered to carriers by maintaining in-transit visibility of shipments and monitoring carrier performance. • Transportation management systems and related tools are widely used to support effective planning, execution, and analysis of transportation processes.
  • 327.
    327 ©2021 Cengage Learning.All Rights Reserved. May not be scanned, copied or duplicated, or posted to a publicly accessible website, in whole or in part. Supply Chain Management, 11e Chapter 12: Aligning Supply Chains ©2021 Cengage Learning. All Rights Reserved. May not be scanned, copied or duplicated, or posted to a publicly accessible website, in whole or in part.
  • 328.
    328 ©2021 Cengage Learning.All Rights Reserved. May not be scanned, copied or duplicated, or posted to a publicly accessible website, in whole or in part. Discussion Outline • Types of supply chain relationships • Model for developing and implementing successful supply chain relationships • Imperative for collaborative relationships • The third-party logistics (3PL) industry
  • 329.
    329 ©2021 Cengage Learning.All Rights Reserved. May not be scanned, copied or duplicated, or posted to a publicly accessible website, in whole or in part. Alignment in Supply Chain Management • Supply chain & Organizational strategies • Supply chain & Trading partners • Supply & Demand
  • 330.
    330 ©2021 Cengage Learning.All Rights Reserved. May not be scanned, copied or duplicated, or posted to a publicly accessible website, in whole or in part. Range of Relationship Types Source Figure 12.1: Copyright, C. John Langley Jr., Ph.D. Used with permission.
  • 331.
    331 ©2021 Cengage Learning.All Rights Reserved. May not be scanned, copied or duplicated, or posted to a publicly accessible website, in whole or in part. Model for Developing and Implementing Successful Supply Chain Relationships
  • 332.
    332 ©2021 Cengage Learning.All Rights Reserved. May not be scanned, copied or duplicated, or posted to a publicly accessible website, in whole or in part. Process Model for Forming Logistics Relationships Source Figure 12.2: Copyright, C. John Langley Jr., Ph.D. Used with permission.
  • 333.
    333 ©2021 Cengage Learning.All Rights Reserved. May not be scanned, copied or duplicated, or posted to a publicly accessible website, in whole or in part. Model for Successful Supply Chain Relationships Steps 1–3 Step 1: Perform Strategic Assessment • Involves the conduct of a logistics audit, which provides a perspective on the firm’s logistics and supply chain needs and a wide range of useful information. Step 2: Decision to Form Relationship • Decision involving external logistics service provider focuses on whether or not to have a relationship (core competency assessment) • Decision involving channel partners focuses on type of relationship that works best. Step 3: Evaluate Alternatives • Thorough assessment of the company’s needs and priorities in comparison with the capabilities of each potential partner. • A broad representation and involvement of people throughout the company
  • 334.
    334 ©2021 Cengage Learning.All Rights Reserved. May not be scanned, copied or duplicated, or posted to a publicly accessible website, in whole or in part. Model for Successful Supply Chain Relationships Step 2: Decision to Form Relationship (1 of 2) Core competency assessment is key in relationship decision that involves an external provider of logistics services. Source Figure 12.3: Copyright, C. John Langley Jr., Ph.D. Used with permission.
  • 335.
    335 ©2021 Cengage Learning.All Rights Reserved. May not be scanned, copied or duplicated, or posted to a publicly accessible website, in whole or in part. Model for Successful Supply Chain Relationships Step 2: Decision to Form Relationship (2 of 2) “Drivers” and “facilitators” are identified in relationship decision that involves channel partners. Drivers: Compelling reasons to partner − Asset/cost efficiency; customer service; marketing advantage; profit stability/growth Facilitators: Supportive corporate environmental factors that enhance partnership growth & development − Corporate compatibility; management philosophy; mutuality of commitment; symmetry on key factors (e.g. size) • Neither drivers nor facilitators present: More transactional, or “arm’s length” • Common drivers with facilitating factors: More structured, formal relationship
  • 336.
    336 ©2021 Cengage Learning.All Rights Reserved. May not be scanned, copied or duplicated, or posted to a publicly accessible website, in whole or in part. Model for Successful Supply Chain Relationships Steps 4–6 Step 4: Select Partner(s) • Select a logistics or supply chain partner only after very close consideration of the credentials of the most likely candidates. • Ensure that everyone involved has a consistent understanding of the decision made. Step 5: Structure Operating Model • The activities, processes, and priorities that will be used to build and sustain the relationship. Examples of components are: − Planning − Communication − Risk/reward sharing − Contract style − Financial investment Step 6: Implementation & Continuous Improvement • Depending on the complexity of the new relationship, the overall implementation process may be relatively short, or it may be extended over a longer period of time.
  • 337.
    337 ©2021 Cengage Learning.All Rights Reserved. May not be scanned, copied or duplicated, or posted to a publicly accessible website, in whole or in part. Model for Successful Supply Chain Relationships Step 6: Implementation & Continuous Improvement Future success of relationship is a direct function of the ability of involved organizations to achieve both continuous & breakthrough improvement. Source Figure 12.4: Adapted from Ray A. Mundy, C. John Langley Jr., and Brian J. Gibson, Continuous Improvement in Third Party Logistics, 2001.
  • 338.
    338 ©2021 Cengage Learning.All Rights Reserved. May not be scanned, copied or duplicated, or posted to a publicly accessible website, in whole or in part. Imperative for Collaborative Relationships
  • 339.
    339 ©2021 Cengage Learning.All Rights Reserved. May not be scanned, copied or duplicated, or posted to a publicly accessible website, in whole or in part. Imperative for Collaborative Relationships Elements of Successful Collaboration 1. Well-understood goals and objectives 2. Trust and commitment 3. Organizational compatibility and communication 4. Equitable sharing of gains and losses 5. Benefits greater than going it alone 6. Dedication to continuous improvement 7. Strategic plan to provide direction to the collaboration
  • 340.
    340 ©2021 Cengage Learning.All Rights Reserved. May not be scanned, copied or duplicated, or posted to a publicly accessible website, in whole or in part. Imperative for Collaborative Relationships Barriers and Benefits Benefits • Focus on core competencies of supply chain organizations • Increased sharing of information and knowledge • Greater responsiveness to customers’ needs • Creation of competitive advantage over competing supply chains • More productive and satisfying relationships Barriers • Resistance to change • Conflicting business objectives • Inconsistent goals and key performance indicators • Lack of trust • Unwillingness to share information • Lack of managerial support • Turf protection
  • 341.
    341 ©2021 Cengage Learning.All Rights Reserved. May not be scanned, copied or duplicated, or posted to a publicly accessible website, in whole or in part. Seven Immutable Laws of Collaborative Logistics 1. Real and recognized benefits to all members 2. Dynamic creation, measurement, and evolution of collaborative relationships 3. Co-buyer and co-seller relationships 4. Flexibility and security 5. Collaboration across all stages of business process integration 6. Open integration with other services 7. Collaboration across essential logistics flows
  • 342.
    342 ©2021 Cengage Learning.All Rights Reserved. May not be scanned, copied or duplicated, or posted to a publicly accessible website, in whole or in part. Imperative for Collaborative Relationships Three Important Types of Collaboration Source Figure 12.5: Copyright, C. John Langley Jr., Ph.D. Used with permission.
  • 343.
    343 ©2021 Cengage Learning.All Rights Reserved. May not be scanned, copied or duplicated, or posted to a publicly accessible website, in whole or in part. The Third-Party Logistics (3PL) Industry
  • 344.
    344 ©2021 Cengage Learning.All Rights Reserved. May not be scanned, copied or duplicated, or posted to a publicly accessible website, in whole or in part. Third-Party Logistics: Industry Overview “A third-party logistics firm may be defined as an external supplier that performs or manages the performance of all or part of a company’s logistics functions.” Participants who are involved in the buying and selling of outsourced logistics services range from 1PL’s to 5PL’s: • 1PL – Shippers or receivers of product moved through supply chain. • 2PL – Asset-based logistics providers that physically move product through the supply chain (transport carriers of various modes). • 3PL – Firms that manage and/or provide logistics services on behalf of their clients and customers. Most of these organizations are non-asset based. • 4PL – Firms that provide broader scope of services to help manage elements of the supply chain, and typically may be more strategically involved than 3PLs would be. • 5PL – Companies that aggregate demands of 3PLs into bulk volumes to negotiate better rates with logistics service providers.
  • 345.
    345 ©2021 Cengage Learning.All Rights Reserved. May not be scanned, copied or duplicated, or posted to a publicly accessible website, in whole or in part. Third-Party Logistics Evolution of Logistics Outsourcing Source Figure 12.6: Copyright, C. John Langley Jr., Ph.D. Used with permission.
  • 346.
    346 ©2021 Cengage Learning.All Rights Reserved. May not be scanned, copied or duplicated, or posted to a publicly accessible website, in whole or in part. Third-Party Logistics (1 of 2) Types of 3PL Providers Transportation-based • 3PL providers founded as a subsidiary or major division of a large transportation firm. • Examples: FedEx Supply Chain, UPS Supply Chain Solutions, DHL, Ryder Supply Chain Solutions, Schneider Logistics, Penske Logistics, and XPO Logistics. Contract Logistics-based • Generally referring to services relating to warehousing and distribution. • Examples: CEVA Logistics, DSC Logistics, Exel/DHL, Geodis, Penske Logistics, Saddle Creek Corporation. Freight Forwarding-based • Organizations performing services for the daily flow of global commerce, purchasing shipping capacity from asset-based providers, then re-selling to supply chain customers. • Examples: C.H. Robinson, DHL, DSV, Expeditors, Hub Group, and Kuehne & Nagel.
  • 347.
    347 ©2021 Cengage Learning.All Rights Reserved. May not be scanned, copied or duplicated, or posted to a publicly accessible website, in whole or in part. Third-Party Logistics (2 of 2) Types of 3PL Providers Financial-based • Firms providing services such as freight payment and auditing, cost accounting and control, tools for managing shipment visibility, information, and tracking, and consulting and advisory services. • Examples: Tranzact Technologies, CTSI, and Cass Information Systems. Information-based • A newer, innovative type of third-party provider emerged as a result of growth and development of Internet- based, business-to-business, electronic markets for transportation and logistics services. • Example: Transplace, Inc. Corporate Subsidiaries-based • 3PL organizations that initially were divisions or subsidiaries of manufacturing or distributor organizations. • Examples: Neovia, Inc. (formerly Caterpillar Logistics), IBM Global Business Services, Odyssey Logistics.
  • 348.
    348 ©2021 Cengage Learning.All Rights Reserved. May not be scanned, copied or duplicated, or posted to a publicly accessible website, in whole or in part. Third-Party Logistics Logistics Outsourcing Activities Source Figure 12.7: Langley, C. John Jr., and Infosys, 2020 24th Annual 3PL Study.
  • 349.
    349 ©2021 Cengage Learning.All Rights Reserved. May not be scanned, copied or duplicated, or posted to a publicly accessible website, in whole or in part. Third-Party Logistics Important 3PL IT Capabilities Shippers • Transportation management (planning) • Warehouse/DC management • Visibility (order, shipment, inventory, etc.) • Electronic Data Interchange (EDI) • Transportation management (scheduling) • Transportation sourcing Providers • Transportation management (planning) • Visibility (order, shipment, inventory, etc.) • Transportation management (scheduling) • Electronic Data Interchange (EDI) • Warehouse/DC management • Customer relationship management (CRM)
  • 350.
    350 ©2021 Cengage Learning.All Rights Reserved. May not be scanned, copied or duplicated, or posted to a publicly accessible website, in whole or in part. Third-Party Logistics: IT Gap Source Figure 12.8: Langley, C. John Jr., and Infosys, 2020 24th Annual 3PL Study.
  • 351.
    351 ©2021 Cengage Learning.All Rights Reserved. May not be scanned, copied or duplicated, or posted to a publicly accessible website, in whole or in part. Third-Party Logistics Management and Relationship Issues Customers’ Expectations of 3PL Providers • Superior service and execution (proven results and performance) • Trust, openness, and information sharing • Solution innovation and relationship reinvention • Capable information technologies to support the relationship • Ongoing executive level support • Service offering aligned with customer strategy and deep industry knowledge 3PL Providers’ Expectations of Customers • Mutually beneficial, long-term relationship with company • Trust, openness, and information sharing • Dedicating the right resources at the right levels, including executives • Access to useful data to design solutions and provide desired services to customers • Clearly defined service level agreements • Fiduciary responsibility and overall fairness relative to pricing
  • 352.
    352 ©2021 Cengage Learning.All Rights Reserved. May not be scanned, copied or duplicated, or posted to a publicly accessible website, in whole or in part. Third-Party Logistics: Future 3PL Industry Trends 1. Continued expansion, acquisition and consolidation of 3PL industry 2. Expansion of global markets and needed services 3. Broadening of service offerings across supply chain, and business process outsourcing 4. Increased efforts to update, enhance, and improve 3PL-customer relationships 5. Growing range of “strategic” services offered by 3PLs and 4PLs 6. Innovation and transformation to meet needs of e-Commerce businesses 7. IT capabilities to become an even greater differentiator 8. Increased adoption of shared service networks and sometimes collaborative initiatives with traditional competitors 9. Emphasis on relationship reinvention, mechanisms for continual improvement, and solution innovation
  • 353.
    353 ©2021 Cengage Learning.All Rights Reserved. May not be scanned, copied or duplicated, or posted to a publicly accessible website, in whole or in part. Summary • Inter-firm relationships may span from transactional to relational and may take the form of vendor, partner, and strategic alliances. • Collaborative relationships have been identified as highly useful to the achievement of long-term supply chain objectives. • Third-party logistics providers are “external suppliers that perform all or part of a company’s logistics functions.” • 3PLs may be thought of as transportation-based, warehouse/distribution-based, forwarder-based, financial-based, and information-based. • The most prevalent 3PL services used are transportation, warehousing, customs clearance and brokerage, and forwarding.
  • 354.
    354 ©2021 Cengage Learning.All Rights Reserved. May not be scanned, copied or duplicated, or posted to a publicly accessible website, in whole or in part. Supply Chain Management, 11e Chapter 13: Supply Chain Performance Measurement and Financial Analysis ©2021 Cengage Learning. All Rights Reserved. May not be scanned, copied or duplicated, or posted to a publicly accessible website, in whole or in part.
  • 355.
    355 ©2021 Cengage Learning.All Rights Reserved. May not be scanned, copied or duplicated, or posted to a publicly accessible website, in whole or in part. Discussion Outline • Characteristics of good performance measures • Performance categories • The supply chain–finance connection • Financial implications of supply chain strategies • Financial implications of supply chain services
  • 356.
    356 ©2021 Cengage Learning.All Rights Reserved. May not be scanned, copied or duplicated, or posted to a publicly accessible website, in whole or in part. Measure vs. Metric vs. Index Index • Combines two or more metrics into a single indicator, usually used to track trends in the output of a process. • Logistics example: Perfect order Metric • Involves a calculation or a combination of measurements, often in the form of a ratio. • Logistics examples : Inventory future days of supply, Inventory turns, Sales dollars per stock- keeping unit Measure • Requires no calculations and with simple dimensions. • Logistics examples: Units of inventory, Backorder dollars
  • 357.
    357 ©2021 Cengage Learning.All Rights Reserved. May not be scanned, copied or duplicated, or posted to a publicly accessible website, in whole or in part. Characteristics of Good Performance Measures 1. Is quantitative 2. Is easy to understand 3. Encourages appropriate behavior 4. Is visible 5. Is defined & mutually understood 6. Encompasses outputs & inputs 7. Measures only what is important 8. Is multidimensional 9. Uses economies of effort 10. Facilitates trust
  • 358.
    358 ©2021 Cengage Learning.All Rights Reserved. May not be scanned, copied or duplicated, or posted to a publicly accessible website, in whole or in part. Characteristics of Good Performance Measures Raising the Performance Bar Source Figure 13.3: J. S. Keebler, D. A. Durtsche, K. B. Manrodt, and D. M. Ledyard, Keeping Score: Measuring the Business Value of Logistics in the Supply Chain (University of Tennessee, Council of Logistics Management, 1999). Reproduced by permission from Council of Supply Chain Management Professionals.
  • 359.
    359 ©2021 Cengage Learning.All Rights Reserved. May not be scanned, copied or duplicated, or posted to a publicly accessible website, in whole or in part. Successful Development of a Supply Chain Metrics Program • Is a result of a team effort. • Involves customers and suppliers (where appropriate). • Develops a tiered structure. • Identifies metric “owners” and ties metric goal achievement to an individual’s or division’s performance evaluation. • Establishes a procedure to mitigate conflicts. • Is consistent with corporate strategy. • Establishes top management support.
  • 360.
    360 ©2021 Cengage Learning.All Rights Reserved. May not be scanned, copied or duplicated, or posted to a publicly accessible website, in whole or in part. Performance Categories Process Measure Categories SCOR Level-1 Metrics Logistics Quantification Pyramid
  • 361.
    361 ©2021 Cengage Learning.All Rights Reserved. May not be scanned, copied or duplicated, or posted to a publicly accessible website, in whole or in part. Performance Categories Process Measure Categories Time • On-time delivery/receipt • Order cycle time • Order cycle time variability • Response time • Forecasting/ Planning cycle time Quality • Overall customer satisfaction • Processing accuracy • Perfect order fulfillment • On-time delivery • Complete order • Accurate product selection • Damage-free • Accurate invoice • Forecast accuracy • Planning accuracy: Budgets and operating plans • Schedule adherence Cost • Finished goods inventory turns • Days sales outstanding • Cost to serve • Cash-to-cash cycle time • Total delivered cost − Cost of goods − Transportation costs − Inventory carrying costs − Material handling costs • All other costs • Info systems • Administrative • Cost of excess capacity • Cost of capacity shortfall Other/Supporting • Approval exceptions to standard • Minimum order quantity • Change order timing • Availability of information Source Figure 13.4: J. S. Keebler, D. A. Durtsche, K. B. Manrodt, and D. M. Ledyard, Keeping Score: Measuring the Business Value of Logistics in the Supply Chain (University of Tennessee, Council of Logistics Management, 1999). Reproduced by permission from Council of Supply Chain Management.
  • 362.
    362 ©2021 Cengage Learning.All Rights Reserved. May not be scanned, copied or duplicated, or posted to a publicly accessible website, in whole or in part. Performance Categories SCOR Level-1 Metrics (1 of 2) Attribute Performance Attribute Definition Level 1 Metric Supply Chain Reliability The performance of the supply chain in delivering: the correct product, to the correct place and customer, at the correct time, in the correct condition and packaging, and with the correct quantity and documentation • Delivery Performance • Fill Rates • Product Order Fulfillment Supply Chain Responsiveness The velocity at which a supply chain provides products to the customer • Order Fulfillment Lead Times Supply Chain Flexibility The agility of a supply chain in responding to marketplace changes to gain or maintain competitive advantage. • Supply Chain Response Time • Production Flexibility Source Figure 13-5: Adapted from Supply Chain Council (2015). Reproduced by permission.
  • 363.
    363 ©2021 Cengage Learning.All Rights Reserved. May not be scanned, copied or duplicated, or posted to a publicly accessible website, in whole or in part. Performance Categories SCOR Level-1 Metrics (2 of 2) Attribute Performance Attribute Definition Level 1 Metric Supply Chain Costs The costs associated with operating the supply chain. • Cost of Goods Sold • Total Supply Chain Management Costs • Value-Added Productivity • Warranty / Returns Processing Costs Supply Chain Asset Management Efficiency The effectiveness of an organization in managing assets to support demand satisfaction. This includes the management of all assets: fixed and working capital. • Cash-to-Cash Cycle Time • Inventory Days of Supply • Asset Turn Source Figure 13-5: Adapted from Supply Chain Council (2015). Reproduced by permission.
  • 364.
    364 ©2021 Cengage Learning.All Rights Reserved. May not be scanned, copied or duplicated, or posted to a publicly accessible website, in whole or in part. Performance Categories SCOR Process D1 Metrics Process Category: Deliver Stocked Product Process Number: D1 Performance Attributes Metric Reliability • Perfect order fulfillment Responsiveness • Order fulfillment cycle time Agility • Upside Supply Chain Flexibility • Upside Supply Chain Adaptability • Downside Supply Chain Adaptability • Overall Value at Risk Costs • Total cost to serve Asset Management • Cash-to-Cash Cycle Time • Return on Supply Chain Fixed Assets • Return on Working Capital Source Figure 13.6: Adapted from Supply Chain Council (2015). Reproduced by permission.
  • 365.
    365 ©2021 Cengage Learning.All Rights Reserved. May not be scanned, copied or duplicated, or posted to a publicly accessible website, in whole or in part. Performance Categories Logistics Quantification Pyramid 1. Looks at how logistics cost and service are perceived by channel members. 2. Focuses on how a seller’s cost influences a customer’s profit and on how a seller’s service impacts a customer’s revenue. 3. Example: Transportation cost tradeoffs between less expensive (slower & less reliable) and more expensive (faster & more reliable) transportation. 4.  Product availability  Order cycle time  Logistics operations responsiveness  Logistics system information  Post-sale logistics support Source Figure 13.7: R. A. Novack, Center for Supply Chain Research, Penn State University (2015).
  • 366.
    366 ©2021 Cengage Learning.All Rights Reserved. May not be scanned, copied or duplicated, or posted to a publicly accessible website, in whole or in part. The Supply Chain–Finance Connection Revenue–Cost Savings Connection Supply Chain Impact on ROA
  • 367.
    367 ©2021 Cengage Learning.All Rights Reserved. May not be scanned, copied or duplicated, or posted to a publicly accessible website, in whole or in part. The Supply Chain–Finance Connection The cost of providing logistics service not only affects the marketability of the product (via the landed cost, or price), but also impacts its profitability. Inventory management & capital • Logistics techniques such as just-in-time and vendor-managed inventories reduce inventory levels and capital required. Lead times & inventory cost and customer service • Consistent and short lead times helps inventories and can build customer satisfaction and loyalty. Order processing time & order-to-cash cycle • Order processing time has a direct bearing on an organization’s order-to-cash cycle: Longer order-to-cash cycle = higher accounts receivable and higher investment in “sold” finished goods.
  • 368.
    368 ©2021 Cengage Learning.All Rights Reserved. May not be scanned, copied or duplicated, or posted to a publicly accessible website, in whole or in part. The Supply Chain–Finance Connection Revenue–Cost Savings Connection (1 of 2) Transform cost reductions into equivalent revenue increases Profit = Revenue − Costs Where: Cost = (X%)(Revenue) Then: Profit = Revenue − (X%)(Revenue) = Revenue (1 − X%) Where: (1 − X%) = Profit margin Sales = Profit/Profit Margin
  • 369.
    369 ©2021 Cengage Learning.All Rights Reserved. May not be scanned, copied or duplicated, or posted to a publicly accessible website, in whole or in part. The Supply Chain–Finance Connection Revenue–Cost Savings Connection (2 of 2) CLGN Example CLGN 2020 SALES EQUIVALENT FOR COST SAVINGS OF (000) Percentage $200,000 $500,000 $1,000,000 Sales $150,000 100.0 $2,857,143* $7,142,857** $14,285,714† Total cost 139,500 93.0 2,657,143 6,642,857 13,285,714 Net profit 10,500 7.0 200,000 500,000 1,000,000 Source Table 13.1: Edward J. Bardi, Ph.D. Used with permission. * $200,000 cost saving ÷ 0.07 profit margin ** $500,000 cost saving ÷ 0.07 profit margin † $1,000,000 cost saving ÷ 0.07 profit margin
  • 370.
    370 ©2021 Cengage Learning.All Rights Reserved. May not be scanned, copied or duplicated, or posted to a publicly accessible website, in whole or in part. Financial Implications of Supply Chain Strategies Supply Chain Impact on ROA Source Figure 13.9: Robert A. Novack, Ph.D. Used with permission.
  • 371.
    371 ©2021 Cengage Learning.All Rights Reserved. May not be scanned, copied or duplicated, or posted to a publicly accessible website, in whole or in part. Financial Implications of Supply Chain Strategies Supply Chain Impact on Balance Sheet Source Figure 13.10: Robert A. Novack, Ph.D. Used with permission.
  • 372.
    372 ©2021 Cengage Learning.All Rights Reserved. May not be scanned, copied or duplicated, or posted to a publicly accessible website, in whole or in part. Financial Implications of Supply Chain Strategies
  • 373.
    373 ©2021 Cengage Learning.All Rights Reserved. May not be scanned, copied or duplicated, or posted to a publicly accessible website, in whole or in part. Financial Implications of Supply Chain Strategies Supply Chain Strategic Areas Affecting ROA Source Figure 13.11: R. A. Novack, Center for Supply Chain Research, Penn State University (2015).
  • 374.
    374 ©2021 Cengage Learning.All Rights Reserved. May not be scanned, copied or duplicated, or posted to a publicly accessible website, in whole or in part. Financial Implications of Supply Chain Strategies Supply Chain Decision and ROA (1 of 2) CLGN Example: Comparison of Supply Chain Alternatives Ratio Analysis CLGN, 2020 $(000) Transport Cost Reduced 10 % Warehousing Cost Reduced 10% Inventory Reduced 10 % Profit margin 7.00% 7.24% 7.06% 7.12% Return on assets 7.24% 7.49% 7.30% 7.42% Inventory turns/year 8.00 8.00 8.00 8.89 Transportation as percentage of sales 4.00% 3.60% 4.00% 4.00% Warehousing as percentage of sales 1.00% 1.00% 0.90% 1.00% Inventory carrying as percentage of sales 2.00% 2.00% 2.00% 1.80% Source Figure 13.17: Edward J. Bardi, Ph.D. Used with permission.
  • 375.
    375 ©2021 Cengage Learning.All Rights Reserved. May not be scanned, copied or duplicated, or posted to a publicly accessible website, in whole or in part. Financial Implications of Supply Chain Strategies Supply Chain Decision and ROA (2 of 2) Example: CLGN 2020 and Reduced Transportation Costs • Source Figure 13.18: Edward J. Bardi, Ph.D. Used with permission.
  • 376.
    376 ©2021 Cengage Learning.All Rights Reserved. May not be scanned, copied or duplicated, or posted to a publicly accessible website, in whole or in part. Financial Implications of Supply Chain Services
  • 377.
    377 ©2021 Cengage Learning.All Rights Reserved. May not be scanned, copied or duplicated, or posted to a publicly accessible website, in whole or in part. Financial Implications of Supply Chain Service Supply Chain Service Failure Source Figure 13.19: Edward J. Bardi, Ph.D. Used with permission.
  • 378.
    378 ©2021 Cengage Learning.All Rights Reserved. May not be scanned, copied or duplicated, or posted to a publicly accessible website, in whole or in part. Financial Implications of Supply Chain Service Supply Chain Service Improvement Example: Strategic Profit Model & On-Time Delivery Improvement Source Figure 13.22: Edward J. Bardi, Ph.D. Used with permission.
  • 379.
    379 ©2021 Cengage Learning.All Rights Reserved. May not be scanned, copied or duplicated, or posted to a publicly accessible website, in whole or in part. Summary • Successful metric development for logistics and supply chains is consistent with corporate strategy, focuses on customer needs, carefully selects and prioritizes metrics, focuses on processes, uses a balanced approach, and uses technology to improve measurement effectiveness. • Four principal categories for performance metrics are: time, quality, cost, and miscellaneous or support; OR: operations cost, service, revenue or value, and channel satisfaction. • Supply chain management impacts ROA via decisions regarding channel structure management, inventory management, order management, and transportation management. • Supply chain service failures result in lost sales and rehandling costs. The financial impact of modifications to supply chain services can be analyzed using the strategic profit model which shows the relationship of sales, costs, assets, and equity.
  • 380.
    380 ©2021 Cengage Learning.All Rights Reserved. May not be scanned, copied or duplicated, or posted to a publicly accessible website, in whole or in part. Supply Chain Management, 11e Chapter 14: Supply Chain Technology: Managing Information Flows ©2021 Cengage Learning. All Rights Reserved. May not be scanned, copied or duplicated, or posted to a publicly accessible website, in whole or in part.
  • 381.
    381 ©2021 Cengage Learning.All Rights Reserved. May not be scanned, copied or duplicated, or posted to a publicly accessible website, in whole or in part. Discussion Outline • Information requirements • Systems capabilities • Supply chain management software • Technology selection • Supply chain technology innovations
  • 382.
    382 ©2021 Cengage Learning.All Rights Reserved. May not be scanned, copied or duplicated, or posted to a publicly accessible website, in whole or in part. Information Requirements (1 of 2) Source Figure 14.1: Brian J. Gibson, Ph.D. Used with permission. • Information connects the extended supply chain, providing cross-chain insights regarding demand, customer orders, delivery status, inventory stock levels, and production schedules. • Three principle supply chain information requirements: − Meet quality standards − Support multidirectional flows − Provide decision support
  • 383.
    383 ©2021 Cengage Learning.All Rights Reserved. May not be scanned, copied or duplicated, or posted to a publicly accessible website, in whole or in part. Information Requirements (2 of 2) Meet Quality Standards Seven information quality standards: • Accuracy • Accessibility • Relevancy • Timeliness • Transferability • Usability • Reliability Support Multidirectional Flows • Internal information sharing • External information sharing • Suppliers − Logistics service providers − Financial institutions − Government agencies Provide Decision Support • Strategic decisions: Long- range supply chain plans • Tactical planning: Cross- organization linkages and supply chain activity coordination. • Routine decisions: Rules- based decision making. • Execution and transaction processing: Completion of fulfillment activities
  • 384.
    384 ©2021 Cengage Learning.All Rights Reserved. May not be scanned, copied or duplicated, or posted to a publicly accessible website, in whole or in part. Systems Capabilities Enable Process Excellence Link Network Elements Mitigate Technology Risks
  • 385.
    385 ©2021 Cengage Learning.All Rights Reserved. May not be scanned, copied or duplicated, or posted to a publicly accessible website, in whole or in part. Systems Capabilities Enable Process Excellence The system must facilitate excellent performance across the plan, buy, make, move, and return processes of a supply chain. 1. Cross-chain visibility. Supports process variability reduction, performance optimization, & cost control. 2. Agility. Support analytics that help to understand volatility and respond appropriately. 3. Velocity. Adjust speeds according to situations. 4. Synchronization. Facilitates data synchronization & real-time information sharing between partners. 5. Adaptability. Enable strategic adaptation of supply chain design & capabilities to evolving conditions. 6. Segmentation. Help define customer segments, understand cost to serve & prioritize service execution. 7. Optimization. Enable consideration of trade-offs, effectively deploy resources, & make decision.
  • 386.
    386 ©2021 Cengage Learning.All Rights Reserved. May not be scanned, copied or duplicated, or posted to a publicly accessible website, in whole or in part. Systems Capabilities Link Network Elements A cohesive network of integrated technologies, skilled people, and robust processes must be established. Source Figure 14.2: Brian J. Gibson, Ph.D. Used with permission.
  • 387.
    387 ©2021 Cengage Learning.All Rights Reserved. May not be scanned, copied or duplicated, or posted to a publicly accessible website, in whole or in part. Systems Capabilities Mitigate Technology Risks Common risks must be identified and mitigated to maximize the return on technology investments. The pitfalls associated with systems adoption or upgrades • Unrealistic assumption that supply chain technologies will readily solve or fix flawed supply chains. • Weak technology-process alignment, leading to ill-fitting solutions that fail to achieve their promise • Technology gaps as a result of piecemeal purchases and deployment of technologies • Challenges in cross-chain systems integration with suppliers, service providers, and customers • Poor planning and preparation for technology implementation
  • 388.
    388 ©2021 Cengage Learning.All Rights Reserved. May not be scanned, copied or duplicated, or posted to a publicly accessible website, in whole or in part. SCM Software
  • 389.
    389 ©2021 Cengage Learning.All Rights Reserved. May not be scanned, copied or duplicated, or posted to a publicly accessible website, in whole or in part. SCM Software Primary Categories Source Figure 14.3: Brian J. Gibson, Ph.D. Used with permission.
  • 390.
    390 ©2021 Cengage Learning.All Rights Reserved. May not be scanned, copied or duplicated, or posted to a publicly accessible website, in whole or in part. SCM Software: Planning Applications SCM planning applications help organizations shift from autonomous planning activities to synchronized planning processes that use real-time data for collaboration across departments, suppliers & customers. • Available/capable to promise • Sales and operations planning/integrated business planning • Collaborative planning, forecasting, and replenishment • Vendor-managed inventory/direct point of sale • Event planning • Demand planning • Inventory planning • Distribution planning • Strategic network design • Inventory strategy optimization • Supply planning • Production/multiplant capacity planning • Production/factory planning and scheduling Source Table 14.1: Adapted from Gartner IT Glossary. Retrieved from https://www.gartner.com/it-glossary/scp-supply-chain-planning/
  • 391.
    391 ©2021 Cengage Learning.All Rights Reserved. May not be scanned, copied or duplicated, or posted to a publicly accessible website, in whole or in part. SCM Software: Execution Applications Companies deploy a variety of execution software to facilitates desired performance of day-to-day operating tasks required to support customer demand. Warehouse Management Systems • Inventory management • Labor management • Order processing • Yard/dock management • Returns management Order Management Systems • Sales order entry • Pricing and credit checks • Inventory allocation • Invoice generation Distributed Order Management • Order assignment Transportation Management Systems • Mode and carrier selection • Route planning and optimization • Dispatching and scheduling • Freight audit and payment • Performance analysis Global Trade Management • Trade compliance • International logistics • Global order management • Global trade financial management Manufacturing Execution Systems • Work-in-process management Source Table 14.2: Adapted from Gartner IT Glossary. Retrieved from http://www.gartner.com/it-glossary/ sce-supply-chain-execution/
  • 392.
    392 ©2021 Cengage Learning.All Rights Reserved. May not be scanned, copied or duplicated, or posted to a publicly accessible website, in whole or in part. SCM Software: Event Management Tools Supply chain event management tools collect data in real time from multiple sources across the network and convert them into information that allows companies to automate the monitoring of supply chain events as they occur on a day-to-day basis. • Provide the cross-chain visibility needed to detect, evaluate, and adapt to changing conditions before they snowball into major problems. • Built-in work flow rules initiate automated responses that are either preemptive or reactive. • Integrated into other applications, event management solutions help to close the loop between planning and execution to support synchronization of end-to-end activities.
  • 393.
    393 ©2021 Cengage Learning.All Rights Reserved. May not be scanned, copied or duplicated, or posted to a publicly accessible website, in whole or in part. SCM Software: Analytics & Intelligence Tools Capabilities • The data collection & “big data” analytics • Self-service reporting • Performance scorecarding versus goals • Development of graphical dashboards • Activity monitoring supporting event mgmt. • Access to data residing on multiple SCIS Opportunity Areas • Generating valuable insights about complex global operations • Providing more granular visibility of spending • Improving S&OP & demand forecasting • Resolving logistics bottlenecks
  • 394.
    394 ©2021 Cengage Learning.All Rights Reserved. May not be scanned, copied or duplicated, or posted to a publicly accessible website, in whole or in part. SCM Software: Facilitating Tools Facilitating systems and applications provide critical links between supply chain processes, the organization, and external stakeholders. Collectively, they create a holistic view of the supply chain. Enterprise resource planning (ERP) systems • Incorporate internal and external systems into a single unified solution that spans the enterprise. Supplier relationship management (SRM) • A controlled and systematic approach to managing an organization’s sourcing activities for goods and services. Customer relationship management (CRM) • Focuses on practices, strategies & technologies used to manage and analyze customer interactions & data throughout relationship lifecycle. Automatic identification (auto-ID) & data capture technologies • Recognize objects, collect relevant information, and feed the data directly into the SCIS.
  • 395.
    395 ©2021 Cengage Learning.All Rights Reserved. May not be scanned, copied or duplicated, or posted to a publicly accessible website, in whole or in part. SCM Technology Implementation
  • 396.
    396 ©2021 Cengage Learning.All Rights Reserved. May not be scanned, copied or duplicated, or posted to a publicly accessible website, in whole or in part. SCM Technology Implementation Informed Decision Making 1. Need assessment. Understand the supply chain that the technology is intended to support. 2. Software selection. A multifaceted decision, involving development alternatives (off the shelves vs. in-house), types of applications (individual applications vs. integrated suite), and purchase options (on-premise vs. SaaS) 3. Implementation issues. Training, cultural change, systems interoperability, data synchronization, data standardization, and application integration
  • 397.
    397 ©2021 Cengage Learning.All Rights Reserved. May not be scanned, copied or duplicated, or posted to a publicly accessible website, in whole or in part. SCM Technology Implementation Golden Rules for Success 1. Get sponsorship of senior leaders 2. Choose the right technology solutions 3. Select an implementation leader with project management skills 4. Choose the right consultants to support implementation 5. Staff the project team with the best and brightest people 6. Manage “scope creep” to avoid implementation delays 7. Secure adequate resources for training and post-go-live support
  • 398.
    398 ©2021 Cengage Learning.All Rights Reserved. May not be scanned, copied or duplicated, or posted to a publicly accessible website, in whole or in part. Supply Chain Technology Innovations
  • 399.
    399 ©2021 Cengage Learning.All Rights Reserved. May not be scanned, copied or duplicated, or posted to a publicly accessible website, in whole or in part. Supply Chain Technology Innovations Smart Technologies To enable the supply chain evolution, companies must effectively digitize their supply chains and deploy smart technologies • Supply Chain Digitization • Artificial Intelligence & Machine Learning • IoT • Blockchain • Digital Twin • Quantum Computing
  • 400.
    400 ©2021 Cengage Learning.All Rights Reserved. May not be scanned, copied or duplicated, or posted to a publicly accessible website, in whole or in part. Summary • To produce actionable knowledge, supply chain information must be high quality, readily flow between organizations, and support a variety of decision types. • A well-designed SCIS links people, processes, and technology in a manner that provides actionable information and enhances decision making. • four general categories of supply chain software are: (1) planning tools for forecasting and related activities, (2) execution systems for management of day- to-day processes, (3) event management tools to monitor supply chain flows, and (4) business intelligence applications used to analyze performance. • To maximize SCIS investment success, managers must effectively assess the SCM requirements, understand software options, and address the technical issues.
  • 401.
    401 ©2021 Cengage Learning.All Rights Reserved. May not be scanned, copied or duplicated, or posted to a publicly accessible website, in whole or in part. Supply Chain Management, 11e Chapter 15: Strategic Challenges and Change for Supply Chains ©2021 Cengage Learning. All Rights Reserved. May not be scanned, copied or duplicated, or posted to a publicly accessible website, in whole or in part.
  • 402.
    402 ©2021 Cengage Learning.All Rights Reserved. May not be scanned, copied or duplicated, or posted to a publicly accessible website, in whole or in part. Discussion Outline • Principles of supply chain management • Game-changing supply chain technologies • Supply chain analytics • Supply chain talent management • Sustainability • Supply chain innovation and transformation
  • 403.
    403 ©2021 Cengage Learning.All Rights Reserved. May not be scanned, copied or duplicated, or posted to a publicly accessible website, in whole or in part. Principles of Supply Chain Management
  • 404.
    404 ©2021 Cengage Learning.All Rights Reserved. May not be scanned, copied or duplicated, or posted to a publicly accessible website, in whole or in part. Seven Principles of Supply Chain Management Update on the Seven Principles: • The seven principles basically survive the test of time. • We still have a long way to go on supply chain strategy implementation. • Technology and data will be the major game changer going forward. Source Figure 15.1: David L. Anderson, Frank F. Britt, and Donavan J. Favre, “The Seven Principles of Supply Chain Management, Supply Chain Management Review (April, 2007): 46. Copyright © 2007 Reed Business, a division of Reed Elsevier.
  • 405.
    405 ©2021 Cengage Learning.All Rights Reserved. May not be scanned, copied or duplicated, or posted to a publicly accessible website, in whole or in part. Game-Changing Supply Chain Technologies
  • 406.
    406 ©2021 Cengage Learning.All Rights Reserved. May not be scanned, copied or duplicated, or posted to a publicly accessible website, in whole or in part. Game-Changing Technologies • Mobility • Digitization • Automation
  • 407.
    407 ©2021 Cengage Learning.All Rights Reserved. May not be scanned, copied or duplicated, or posted to a publicly accessible website, in whole or in part. Mobility Mobile internet (MI) and communication Combinations of mobile devices (e.g. smartphones and tablets), high-speed wireless networks, and associated applications. Multipurpose mobile computing device Commercial grade device with features such as built- in processor, memory and operating system (OS); camera; barcode and label printers; scanners; RFID readers; GPS; voice recognition software. Mobile cloud The combination of mobile development with cloud- based storage, applications, computing and services. • GPS technologies integrated with wireless telecommunication and computing devices • Maximize fleet and asset utilization − Real-time routing − Response to weather conditions − Dynamic driver dispatching
  • 408.
    408 ©2021 Cengage Learning.All Rights Reserved. May not be scanned, copied or duplicated, or posted to a publicly accessible website, in whole or in part. Digitization Deep Learning Emphasize “autonomous” learning that has become an AI aspect of assets, advanced (predictive and prescriptive) analytics, AI- driven automation, and business intelligence software. Additive Mfg. 3D printing technology creates physical objects from digital models. Potential uses of will continue to broaden as the range of printable materials continues to expand. Augmented Reality (AR) AR in warehouse operations AR technology, which could come in the form of integrated smart phone cameras or wearable headsets and accessories, could guide a worker who needs to find, move, pick, pack, and ship a particular product; and allow him/her to scan barcode and capture image. Cloud Computing Offering access to a shared pool of computing resources (e.g. servers, storage, software) over the Internet. Augmented Reality Integrates contextual information into individuals’ field of view through an AR headset, providing virtual images, videos, animation or informational content to users who wear them.
  • 409.
    409 ©2021 Cengage Learning.All Rights Reserved. May not be scanned, copied or duplicated, or posted to a publicly accessible website, in whole or in part. Automation Intelligent Robotics Emphasize “autonomous” learning that has become an AI aspect of assets, advanced (predictive and prescriptive) analytics, AI-driven automation, and business intelligence software. Internet Of Things (IoT) 3D printing technology creates physical objects from digital models. Potential uses will continue to broaden as the range of printable materials continues to expand. Automation: M2M Vehicle-to-Infrastructure (V2I) Car manufacturers such as Volvo and Ford have V2I vehicles in production that are capable of reading new smart road signs now used in France and Germany.
  • 410.
    410 ©2021 Cengage Learning.All Rights Reserved. May not be scanned, copied or duplicated, or posted to a publicly accessible website, in whole or in part. Supply Chain Analytics
  • 411.
    411 ©2021 Cengage Learning.All Rights Reserved. May not be scanned, copied or duplicated, or posted to a publicly accessible website, in whole or in part. Supply Chain Analytics From Data to Information to Understanding One major topic of great contemporary interest is that of supply chain analytics that center on taking a giant leap from data to information, and then from information to understanding. Understanding Information that has been examined & studied in context of specific business situations (e.g., inventory levels in relation to overall economic conditions) Information Data that has been gathered, processed, organized & structured in a given context (e.g. average levels of inventory and/or levels of inventory by SKU) Data Unorganized facts that need to be processed (e.g. levels of inventory at ends of financial periods)
  • 412.
    412 ©2021 Cengage Learning.All Rights Reserved. May not be scanned, copied or duplicated, or posted to a publicly accessible website, in whole or in part. The Velocity of Data Every 60 seconds: • 98,000+ tweets • 695,000 status updates • 11 million instant messages • 698,445 Google searches • 168 million+ emails sent • 1,820TB of data created • 217 new mobile web users Kalakota, R. (2012, October 22). Sizing “Mobile + Social” Big Data Stats. Retrieved from http://practicalanalytics.wordpress.com/
  • 413.
    413 ©2021 Cengage Learning.All Rights Reserved. May not be scanned, copied or duplicated, or posted to a publicly accessible website, in whole or in part. Supply Chain Analytics Supply Chain Analytics Maturity Figure 15.2: C. John Langley Jr., Ph.D., Penn State University. Used with permission.
  • 414.
    414 ©2021 Cengage Learning.All Rights Reserved. May not be scanned, copied or duplicated, or posted to a publicly accessible website, in whole or in part. Supply Chain Analytics Analytical Resources Level of Analytics Analytical Resources Descriptive • Standard and ad hoc reporting • Data from supply chain partners • Alerts and notifications • Query/drill down Predictive • Forecasting • Heuristic analysis • Simulation • Statistical analysis • Predictive modeling Prescriptive • Stochastic optimization • Scenario planning Cognitive • IBM Watson Analytics Source Table 15.1: C. John Langley Jr., Ph.D., Penn State University. Used with permission.
  • 415.
    415 ©2021 Cengage Learning.All Rights Reserved. May not be scanned, copied or duplicated, or posted to a publicly accessible website, in whole or in part. Supply Chain Analytics Big Data and the Supply Chain A primary goal of big data is to help organizations better understand the information that resides within the data, and to focus attention on those factors that are most relevant to making well-informed supply chain decisions. Big data may be thought of as the process of accumulating, organizing and analyzing very large sets of data to identify patterns, trends and other information of interest.
  • 416.
    416 ©2021 Cengage Learning.All Rights Reserved. May not be scanned, copied or duplicated, or posted to a publicly accessible website, in whole or in part. Supply Chain Talent and Management
  • 417.
    417 ©2021 Cengage Learning.All Rights Reserved. May not be scanned, copied or duplicated, or posted to a publicly accessible website, in whole or in part. Supply Chain Talent Management Key Steps to Building A High Quality SCM Team Acquiring new staff Deploy active recruiting techniques such as building recruiting relationships with leading universities, leveraging employee referrals, and creating online communities via LinkedIn and other sites to facilitate candidate interaction. Developing talent Development programs that include effective onboarding, ongoing training, and individual guidance, coupled with a strong culture of development and supply chain–human resources collaboration. Fostering the advancement of top supply chain talent Deploy a proactive combination of career guidance and challenging assignments, while providing compelling SCM advancement opportunities via logical career paths, retention strategies, and succession planning.
  • 418.
    418 ©2021 Cengage Learning.All Rights Reserved. May not be scanned, copied or duplicated, or posted to a publicly accessible website, in whole or in part. Supply Chain Talent Management Effective Talent Management Linking People Strategy to Business Strategy Source Figure 15.4: Langley, C. John Jr., and Capgemini, LLC, 2015 19th Annual 3PL Study, Capgemini, LLC. Figure courtesy of KornFerry International.
  • 419.
    419 ©2021 Cengage Learning.All Rights Reserved. May not be scanned, copied or duplicated, or posted to a publicly accessible website, in whole or in part. Sustainability
  • 420.
    420 ©2021 Cengage Learning.All Rights Reserved. May not be scanned, copied or duplicated, or posted to a publicly accessible website, in whole or in part. Sustainability Considerations Sustainability requires companies to consider and manage the impact that their supply chain has on both the ecological and social environment in which they operate.
  • 421.
    421 ©2021 Cengage Learning.All Rights Reserved. May not be scanned, copied or duplicated, or posted to a publicly accessible website, in whole or in part. Sustainability Includes Many Dimensions Sustainability: • Political • Economic • Social • Technological • Environmental • Legal
  • 422.
    422 ©2021 Cengage Learning.All Rights Reserved. May not be scanned, copied or duplicated, or posted to a publicly accessible website, in whole or in part. Sustainability The Business Case for Sustainability • Regulation − Legislation & compliance • Risk − Short-term cost & long-term supply • Reputation − Brand loyalty, sentiment & awareness • Profit − Cost reduction & competitive advantages
  • 423.
    423 ©2021 Cengage Learning.All Rights Reserved. May not be scanned, copied or duplicated, or posted to a publicly accessible website, in whole or in part. Sustainability Four “R’s” of Sustainability Sustainability Approaches Description Reuse Reuse often requires disassembly, which is a systematic method of separating a product into constituent parts, components, subassemblies, or other component parts. The parts or components may be reassembled for reuse after cleaning, checking, and repair, or the individual components may be reused. Remanufacturing Remanufacturing essentially means that a product or part is returned to the market as “good as new.” Auto parts, tires, and electronics are frequently remanufactured. Reconditioning Reconditioning usually means returning used products to working order but not “as good as new.” Recycling Recycling generally refers to the secondary use of materials. It usually includes glass bottles, cans, newspapers, corrugated material, tires, etc. The recycling is usually performed for individual households by municipal government agencies. Source Table 15.2: Center for Supply Chain Research TM , Penn State University.
  • 424.
    424 ©2021 Cengage Learning.All Rights Reserved. May not be scanned, copied or duplicated, or posted to a publicly accessible website, in whole or in part. Sustainability Reverse Flows: Key Observations • Global supply chains − Global supply chains present both challenge and opportunity for reverse flows. • Cash/value & technology − Cash/value from returns, and power of technology has not received enough emphasis in return flows. • Necessary evil/cost center − Reverse direction needs continual scrutiny to control and reduce. • Increased reverse flow − Easy return as part of customer service policies. − Increased consumer recycling programs. − High obsolescence rate in technological products.
  • 425.
    425 ©2021 Cengage Learning.All Rights Reserved. May not be scanned, copied or duplicated, or posted to a publicly accessible website, in whole or in part. Supply Chain Innovation and Transformation
  • 426.
    426 ©2021 Cengage Learning.All Rights Reserved. May not be scanned, copied or duplicated, or posted to a publicly accessible website, in whole or in part. Supply Chain Transformation Process Model Source Figure 15.5: C. John Langley Jr., Ph.D., Penn State University. Used with permission.
  • 427.
    427 ©2021 Cengage Learning.All Rights Reserved. May not be scanned, copied or duplicated, or posted to a publicly accessible website, in whole or in part. Example Process Elements and Details (1 of 2) Process Elements Description Examples Examples (cont.) INPUT Basically, the state of the supply chain prior to the intended transformation (“as- is” state)  Supply chain goals and objectives  Configuration/mapping of current supply chain  Details relating to facilities, customers, suppliers, capital, cost, and growth  Economic and competitive environments  Macro and micro changes in product and service markets PROCESS Conversion or transformation of inputs into outputs  Supply chain innovations  Flows of products, information, capital, throughout the supply chain  Alignment within and among organizations  Essentially, what needs to be converted, changed, or added to achieve results of the transformation OUTPUT Results of the transformation (“to- be” state)  Improvements in supply chain processes  Measurable results  Impacts on customers, cost, capital, and growth of organization  Enhanced competitive advantage Source Table 15.3: C. John Langley Jr., Ph.D., Penn State University. Used with permission.
  • 428.
    428 ©2021 Cengage Learning.All Rights Reserved. May not be scanned, copied or duplicated, or posted to a publicly accessible website, in whole or in part. Example Process Elements and Details (2 of 2) Process Elements Description Examples Examples (cont.) Resources Capabilities needed to accomplish the transformation  People  Information  Technology  Financial support  Change management capabilities Constraints Constrain the process and/or outputs  Organizational policies  Budget/financial capabilities  Supply chain partner capabilities  Culture/environmental  Government/regulatory  Contract terms  Risk Feedback Assess process and process outcomes with desired goals and objectives—use as basis for needed revisions to process inputs or changes to process steps  Comparisons of outputs with goals and objectives  Identify elements of the process map that are in need of re- thinking or revision  Valuable step to make mid-course modifications to improve process outputs Governance Rules or policies of how the process works—actually, governance itself is a process  Who is to be involved, and what are their roles  Protocols for decision making  Documentation of information and status relating to steps in transformation process Source Table 15.3: C. John Langley Jr., Ph.D., Penn State University. Used with permission.
  • 429.
    429 ©2021 Cengage Learning.All Rights Reserved. May not be scanned, copied or duplicated, or posted to a publicly accessible website, in whole or in part. Supply Chain Transformation in the Digital Disruptive Age • Commerce is changing (rapidly). • Supply chain must evolve to meet strategic needs. • Tradeoffs between efficient and customer-focused. • People, process and tech must be aligned. • Added complexity and expectations. • View supply chain as “end-to-end” and not as function(s). • Collaboration and leadership is KEY. • Four themes—technology, analytics, ecosystems, and talent.
  • 430.
    430 ©2021 Cengage Learning.All Rights Reserved. May not be scanned, copied or duplicated, or posted to a publicly accessible website, in whole or in part. Summary • Seven landmark principles of supply chain management have withstood the test of time. These principles contribute to the objectives of revenue growth, asset utilization, and cost reduction. • Supply chains are impacted by a wide variety of external and internal factors, among which the importance of game-changing technologies to the future of SCM cannot be overstated. • Supply chains generate a wealth of data that can be transformed into information and insight through the use of supply chain analytics. • A shortage of qualified supply chain talent requires a proactive SCM talent management process to acquire, develop, and retain key individuals. • The importance of sustainability to supply chains cannot be over-stated. The four “R’s” of sustainability provide useful guideposts for action. • The extent to which organizations and supply chains are able to remain relevant and competitive will be directly related to their abilities to innovate and transform themselves.

Editor's Notes

  • #5  Source Figure 1.1: Center for Supply Chain Research, Penn State University.
  • #144 Source Figure 6.5: Adapted from Jacobs and Chase, Operation and Supply Chain Management 15th ed. (Boston, MA: McGraw-Hill Irwin, 2018). Reprinted with permission of McGraw-Hill Companies, Inc.
  • #239 Source Figures 9.15 and 9.16: John J. Coyle, DBA. Used with permission.
  • #242 Source Figures 9.15 and 9.16: John J. Coyle, DBA. Used with permission.
  • #243 Source Figure 9.19: Robert A. Novack, Ph.D. Used with permission.
  • #321 Source Figure 11.5: Brian J. Gibson, Ph.D. Used with permission.
  • #326 Source Figure 11.3: Brian J. Gibson, Ph.D. Used with permission.
  • #335 Source Figure 12.3: Copyright, C. John Langley Jr., Ph.D. Used with permission.
  • #343 Source Figure 12.5: Copyright, C. John Langley Jr., Ph.D. Used with permission.
  • #374 Source Figure 13.11: R. A. Novack, Center for Supply Chain Research, Penn State University (2015).
  • #398 Source Figure 14.3: Brian J. Gibson, Ph.D. Used with permission.