Download as PDF, PPTX


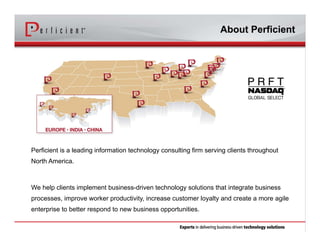
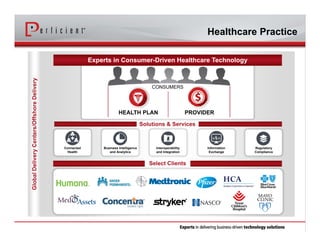
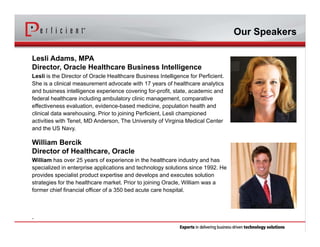
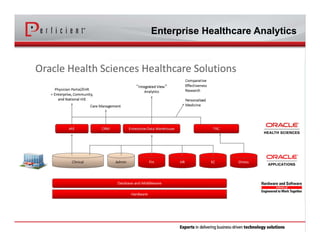
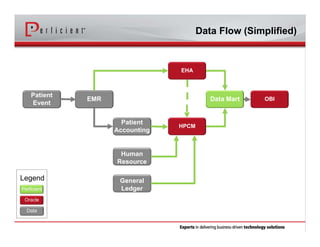
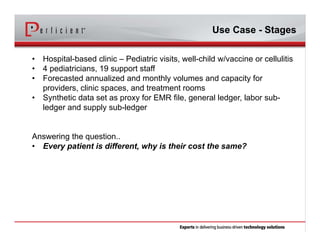
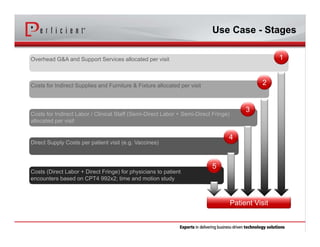
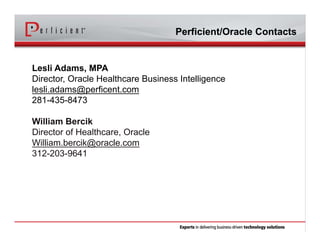

Perficient is an IT consulting firm that helps clients implement business technology solutions. The document discusses Perficient's healthcare solutions and services, including business intelligence, ERP, mobile platforms, and its Oracle partnership. It then provides biographies of two speakers, Lesli Adams and William Bercik, before outlining a presentation on using data and analytics to understand healthcare costs and their relationship to quality of care.


