
Recommended
More Related Content
Similar to Unit 1 - Measures of Dispersion - 18MAB303T - PPT - Part 2.pdf
Similar to Unit 1 - Measures of Dispersion - 18MAB303T - PPT - Part 2.pdf (20)
Recently uploaded
Recently uploaded (20)
Unit 1 - Measures of Dispersion - 18MAB303T - PPT - Part 2.pdf
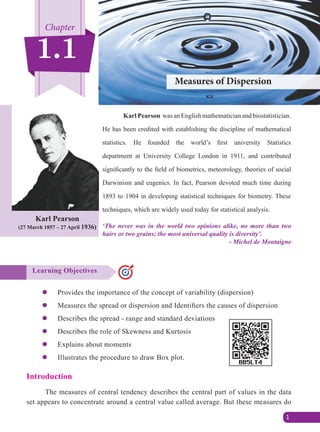
- 1. z z Provides the importance of the concept of variability (dispersion) z z Measures the spread or dispersion and Identifiers the causes of dispersion z z Describes the spread - range and standard deviations z z Describes the role of Skewness and Kurtosis z z Explains about moments z z Illustrates the procedure to draw Box plot. Introduction The measures of central tendency describes the central part of values in the data set appears to concentrate around a central value called average. But these measures do Chapter 1.1 Measures of Dispersion Karl Pearson was an English mathematician and biostatistician. He has been credited with establishing the discipline of mathematical statistics. He founded the world’s first university Statistics department at University College London in 1911, and contributed significantly to the field of biometrics, meteorology, theories of social Darwinism and eugenics. In fact, Pearson devoted much time during 1893 to 1904 in developing statistical techniques for biometry. These techniques, which are widely used today for statistical analysis. Learning Objectives ‘The never was in the world two opinions alike, no more than two hairs or two grains; the most universal quality is diversity’. - Michel de Montaigne Karl Pearson (27 March 1857 – 27 April 1936) 1 Ch6_11th Stats.indd 157 2/3/2019 11:01:50 AM www.tntextbooks.in
- 2. 2 not reveal how these values are dispersed (spread or scattered) on each side of the central value. Therefore while describing data set it is equally important to know how for the item in the data are close around or scattered away from the measures of central tendency. Example 1.1 Look at the runs scored by the two cricket players in a test match: Players I Innings II Innings Mean Player 1 0 100 50 Player 2 40 60 50 Comparing the averages of the two players we may come to the conclusion that they were playing alike. But player 1 scored 0 runs in I innings and 100 in II innings. Player 2 scored nearly equal runs in both the innings. Therefore it is necessary for us to understand data by measuring dispersion. 1.1 Characteristics of a good Measure of Dispersion An ideal measure of dispersion is to satisfy the following characteristics. (i) It should be well defined without any ambiguity. (ii) It should be based on all observations in the data set.. (iii) It should be easy to understand and compute. (iv) It should be capable of further mathematical treatment. (v) It should not be affected by fluctuations of sampling. (vi) It should not be affected by extreme observations. 1.2 Types of measures of dispersion Range, Quartile deviation, Mean deviations, Standard deviation and their Relative measures The measures of dispersion are classified in two categories, namely (i) Absolute measures (ii) Relative measures. 1.3 Absolute Measures It involves the units of measurements of the observations. For example, (i) the dispersion of salary of employees is expressed in rupees, and (ii) the variation of time Ch6_11th Stats.indd 158 2/3/2019 11:01:50 AM www.tntextbooks.in
- 3. “Measures of Dispersion” 3 required for workers is expressed in hours. Such measures are not suitable for comparing the variability of the two data sets which are expressed in different units of measurements. 1.3.1 Range Raw Data: Range is defined as difference between the largest and smallest observations in the data set. Range(R) = Largest value in the data set (L) –Smallest value in the data set(S) R= L - S Grouped Data: For grouped frequency distribution of values in the data set, the range is the difference between the upper class limit of the last class interval and the lower class limit of first class interval. Coefficient of Range The relative measure of range is called the coefficient of range Co efficient of Range = ( L- S) / (L+ S) Example 1.2 The following data relates to the heights of 10 students (in cms) in a school. Calculate the range and coefficient of range. 158, 164, 168, 170, 142, 160, 154, 174, 159, 146 Solution: L=174 S=142 Range = L – S = 174 – 142 = 32 Coefficient of range = ( L - S)/(L + S) = (174-142) / (174+142) = 32 / 316 = 0.101 Example 1.3 Calculate the range and the co-efficient of range for the marks obtained by 100 students in a school. Ch6_11th Stats.indd 159 2/3/2019 11:01:50 AM www.tntextbooks.in
- 4. 4 Marks 60-63 63-66 66-69 69-72 72-75 No. of students 5 18 42 27 8 Solution: L = Upper limit of highest class = 75 S = lower limit of lowest class = 60 Range = L-S = 75-60 = 15 Co - efficient of Range = (L- S) / (L+ S) = 15/ (75 + 60) = 15 / 135=0.111 Merits: z z Range is the simplest measure of dispersion. z z It is well defined, and easy to compute. z z It is widely used in quality control, weather forecasting, stock market variations etc. Limitations: z z The calculations of range is based on only two values – largest value and smallest value. z z It is largely influenced by two extreme values. z z It cannot be computed in the case of open-ended frequency distributions. z z It is not suitable for further mathematical treatment. 1.3.2 Inter Quartile Range and Quartile Deviation The quartiles Q1 , Q2 and Q3 have been introduced and studied in Chapter 5. Inter quartile range is defined as: Inter quartile Range (IQR) = Q3 – Q1 Quartile Deviation is defined as, half of the distance between Q1 and Q3 . Quartile Deviation Q.D = Q Q 2 3 1 - It is also called as semi-inter quartile range. Ch6_11th Stats.indd 160 2/3/2019 11:01:51 AM www.tntextbooks.in
- 5. “Measures of Dispersion” 5 Coefficient of Quartile Deviation: The relative measure corresponding to QD is coefficient of QD and is defined as: Coefficient of Quartile Deviation = Q Q Q Q 3 1 3 1 + - Merits: z z It is not affected by the extreme (highest and lowest) values in the data set. z z It is an appropriate measure of variation for a data set summarized in open- ended class intervals. z z It is a positional measure of variation; therefore it is useful in the cases of erratic or highly skewed distributions. Limitations: z z The QD is based on the middle 50 per cent observed values only and is not based on all the observations in the data set, therefore it cannot be considered as a good measure of variation. z z It is not suitable for mathematical treatment. z z It is affected by sampling fluctuations. z z The QD is a positional measure and has no relationship with any average in the data set. 1.3.3 Mean Deviation The Mean Deviation (MD) is defined as the arithmetic mean of the absolute deviations of the individual values from a measure of central tendency of the data set. It is also known as the average deviation. The measure of central tendency is either mean or median. If the measure of central tendency is mean (or median), then we get the mean deviation about the mean (or median). MD (about mean) = n D / D = ( x - x ) MD (about median) = n m D / = Dm = x - Median The coefficient of mean deviation (CMD) is the relative measure of dispersion corresponding to mean deviation and it is given by Coefficient of Mean Deviation (CMD) = mean or median MD mean or median ] g Ch6_11th Stats.indd 161 2/3/2019 11:01:52 AM www.tntextbooks.in
- 6. 6 Example 1.4 The following are the weights of 10 children admitted in a hospital on a particular day. Find the mean deviation about mean, median and their coefficients of mean deviation. 7, 4, 10, 9, 15, 12, 7, 9, 9, 18 Solution: n = 10; Mean: x = n x 10 100 / = = 10 Median: The arranged data is: 4, 7, 7, 9, 9, 9, 10, 12, 15, 18 Median = 2 9 9 2 18 + = = 9: Marks (x) | D | = | x x - r | | Dm | = | x- Median| 7 3 2 4 6 5 10 0 1 9 1 0 15 5 6 12 2 3 7 3 2 9 1 0 9 1 0 18 8 9 Total =100 30 28 Mean deviation from mean = n D / = 10 30 =3 Co-efficient mean deviation about mean = Mean deviation about mean x = 10 3 = 0.3 Mean deviation about median = n Dm / = 10 28 = 2.8 Co- efficient mean deviation about median = Mean deviation about median median = . 9 2 8 = 0.311 Ch6_11th Stats.indd 162 2/3/2019 11:01:55 AM www.tntextbooks.in
- 7. “Measures of Dispersion” 7 1.3.4 Standard Deviation Consider the following data sets. 10, 7, 6, 5, 4, 3, 2 10, 10, 10, 9, 9, 9, 2 ,2 10, 4, 4, 3, 2, 2, 2 It is obvious that the range for the three sets of data is 8. But a careful look at these sets clearly shows the numbers are different and there is a necessity for a new measure to address the real variations among the numbers in the three data sets. This variation is measured by standard deviation. The idea of standard deviation was given by Karl Pearson in 1893. Definition: ‘Standard deviation is the positive square root of average of the deviations of all the observation taken from the mean.’ It is denoted by a greek letter v. (a) Ungrouped data x1 , x2 , x3 ... xn are the ungrouped data then standard deviation is calculated by 1. Actual mean method: Standard deviation σ = n d 2 / , d= x- x 2. Assumed mean method: Standard deviation σ = n d n d 2 2 / / -c m ,d= x-A (b) Grouped Data (Discrete) σ = N fd N fd 2 2 / / -c m , d =x-A Where, f = frequency of each class interval N = total number of observation (or elements) in the population x = mid – value of each class interval where A is an assumed A.M. (c) Grouped Data (continuous) σ = N fd N fd 2 2 / / -c m C # , d = c x A - Where, f = frequency of each class interval N = total number of observation (or elements) in the population Ch6_11th Stats.indd 163 2/3/2019 11:01:56 AM www.tntextbooks.in
- 8. 8 c = width of class interval NOTE The simplified form of standard deviation formula may also be used 1. v = n 1 n d d 2 2 / / -_ i (for raw data) 2. v = N 1 N fd fd C 2 2 # / / -^ h (for grouped data) where d = (x-A)/c x = mid-value of each class interval where A is an assumed A.M. Variance : Sum of the squares of the deviation from mean is known as Variance. The square root of the variance is known as standard deviation. Example 1.5 The following data gives the number of books taken in a school library in 7 days find the standard deviation of the books taken 7, 9, 12, 15, 5, 4, 11 Solution: Actual mean method x = n x / ...... 7 7 9 11 + + + = 7 63 = 9 x d = x x - r d2 7 -2 4 9 0 0 12 3 9 15 6 36 5 -4 16 4 -5 25 11 2 4 94 σ = n d 2 / NOTE We can use two methods to find standard deviation 1. Direct method 2. Shortcut method = 7 94 = . 13 43 = 3.66 Ch6_11th Stats.indd 164 2/3/2019 11:01:57 AM www.tntextbooks.in
- 9. “Measures of Dispersion” 9 Merits: z z The value of standard deviation is based on every observation in a set of data. z z It is less affected by fluctuations of sampling. z z It is the only measure of variation capable of algebraic treatment. Limitations: z z Compared to other measures of dispersion, calculations of standard deviation are difficult. z z While calculating standard deviation, more weight is given to extreme values and less to those near mean. z z It cannot be calculated in open intervals. z z If two or more data set were given in different units, variation among those data set cannot be compared. Example 1.6 Raw Data: Weights of children admitted in a hospital is given below calculate the standard deviation of weights of children. 13, 15, 12, 19, 10.5, 11.3, 13, 15, 12, 9 Solution: A.M., x = n x / = ....... 10 13 15 49 + + + = . 10 129 8 = 12.98 Deviation from actual mean x d = x-12.98 d2 13 0.02 0.0004 15 2.02 4.0804 12 –0.98 0.9604 19 6.02 36.2404 10.5 2.48 6.1504 Ch6_11th Stats.indd 165 2/3/2019 11:01:58 AM www.tntextbooks.in
- 10. 10 11.3 –1.68 2.8224 13 0.02 0.0004 15 2.02 4.0804 12 –0.98 0.9604 9 –3.98 15.8404 n =10 71.136 NOTE If the mean value is not an integer, the calculation is difficult. In such a case we use the alternative formula for the calculation. Standard deviation σ = n d 2 / = . 10 71 136 = 2.67 Example 1.7 Find the standard deviation of the first ‘n’ natural numbers. Solution: The first n natural numbers are 1, 2, 3,…, n. The sum and the sum of squares of these n numbers are xi / = 1+2+3+.....+n = n n 2 1 + ] g x i 2 / = .....n 1 2 3 2 2 2 + + + = ( ) n n n 6 1 2 1 + + ] g Mean x = n 1 xi / = ( ) n n n 2 1 + = ( ) n 2 1 + n xi 2 / = n n 6 1 2 1 + + ] ] g g Standard deviation, σ = n x n x 2 i i 2 / / -b l = n n n 6 1 2 1 4 1 2 + + - + ] ] ] g g g = n n n 12 2 1 2 1 3 1 2 + + - + ] ] ] g g g = ( ) ( ) n n n 12 1 2 2 1 3 1 + + - + ] g6 @ = ( )( ) ( ) n n n 12 1 1 12 1 2 + - = - σ = ( ) n 12 1 2 - Ch6_11th Stats.indd 166 2/3/2019 11:02:01 AM www.tntextbooks.in
- 11. “Measures of Dispersion” 11 Example 1.8 The wholesale price of a commodity for seven consecutive days in a month is as follows: Days 1 2 3 4 5 6 7 Commodity/price/ quintal 240 260 270 245 255 286 264 Calculate the variance and standard deviation. Solution: The computations for variance and standard deviation is cumbersome when x values are large. So, another method is used, which will reduce the calculation time. Here we take the deviations from an assumed mean or arbitrary value A such that d = x – A In this question, if we take deviation from an assumed A.M. =255. The calculations then for standard deviation will be as shown in below Table; Observations (x) d = x – A d2 240 –15 225 260 5 25 270 15 225 245 –10 100 255 A 0 0 286 31 961 264 9 81 35 1617 Variance = σ2 = n d 2 / n d 2 / -b l = 7 1617 - 7 35 2 b l = 231 - 52 = 231 - 25 = 206 Standard deviation σ = variance σ = 206 = 14.35 Ch6_11th Stats.indd 167 2/3/2019 11:02:02 AM www.tntextbooks.in
- 12. 12 Example 1.9 The mean and standard deviation from 18 observations are 14 and 12 respectively. If an additional observation 8 is to be included, find the corrected mean and standard deviation. Solution: The sum of the 18 observations is = n x # = 18 × 14 = 252. The sum of the squares of these 18 observations σ2 = n x n x 2 2 / / -b l 122 = x 18 2 / – 142 144+196 = x 18 2 / x 18 2 / = 340 x2 / =340#18 = 6120 When the additional observation 8 is included, then n=19 , Σx = 252+8 = 260 Therefore, Corrected Mean = 260/19 = 13.68 Corrected x 2 / = x 2 / +82 = 6120+64 = 6184 Corrected Variance σ2 = 19 6184 – 13.682 = 325.47 – 187.14 = 138.33; Corrected Standard deviation σ = . 138 33 σ =11.76 Example 1.10 A study of 100 engineering companies gives the following information Ch6_11th Stats.indd 168 2/3/2019 11:02:03 AM www.tntextbooks.in
- 13. “Measures of Dispersion” 13 Profit (` in Crore) 0 – 10 10 – 20 20 – 30 30 – 40 40 – 50 50 – 60 Number of Companies 8 12 20 30 20 10 Calculate the standard deviation of the profit earned. Solution: A = 35 C = 10 Profit (Rs. in Crore) Mid-value (x) d = C x A - f fd fd2 0 – 10 5 -3 8 -24 72 10 – 20 15 -2 12 -24 48 20 – 30 25 -1 20 -20 20 30 – 40 35 0 30 0 0 40 – 50 45 1 20 20 20 50 – 60 55 2 10 20 40 Total 100 -28 200 Standard deviation σ = N fd N fd C 2 2 # / / -d n Activity Find the standard deviation for this problem using the other two formulae. = 100 200 100 28 10 2 # - - b l = ( . ) 2 0 078 - # 10 = 13.863 1.4 Combined Mean and Combined Standard Deviation Combined arithmetic mean can be computed if we know the mean and number of items in each group of the data. x x 1 2 , , σ1 , σ2 are mean and standard deviation of two data sets having n1 and n2 as number of elements respectively. combined mean x12 = n n n x n x 1 2 1 1 2 2 + + (if two data sets) x123 = n n n n x n x n x 1 2 3 1 1 2 2 3 3 + + + + (if three data sets) Ch6_11th Stats.indd 169 2/3/2019 11:02:05 AM www.tntextbooks.in
- 14. 14 Combined standard deviation σ12 = n n n d n d 1 2 1 2 1 2 1 2 2 2 2 2 v v + + + + _ _ i i d1 = x x 12 1 - d2 = x x 12 2 - Example 1.11 From the analysis of monthly wages paid to employees in two service organizations X and Y, the following results were obtained Organization X Organization Y Number of wage-earners 550 650 Average monthly wages 5000 4500 Variance of the distribution of wages 900 1600 (i) Which organization pays a larger amount as monthly wages? (ii) Find the combined standard deviation? Solution: (i) For finding out which organization X or Y pays larger amount of monthly wages, we have to compare the total wages: Total wage bill paid monthly by X and Y is X : n x 1 1 # r = 550 5000 # = ` 27,50,000 Y : n x 2 2 # r = 650 # 4500 = ` 29,25,000 Organization Y pays a larger amount as monthly wages as compared to organization X. (ii) For calculating the combined variance, we will first calculate the combined mean x12 = n n n x n x 1 2 1 1 2 2 + + = 550 650 2750000 29250000 + + = Rs. 4729.166 Ch6_11th Stats.indd 170 2/3/2019 11:02:06 AM www.tntextbooks.in
- 15. “Measures of Dispersion” 15 Combined standard deviation d1 = x x 12 1 - = 4729.166—5000= . 270 834 - σ12 = n n n d n d 1 2 1 2 1 2 1 2 2 2 2 2 v v + + + + _ _ i i = ( , . ) ( , . ) 550 650 550 900 73 351 05 650 1600 52 517 05 + + + + = , , , . , , , . 1200 4 08 38 080 55 3 51 76 082 50 + . 633445 251 68 = = 1.5 Relative Measures It is a pure number independent of the units of measurements. This measure is useful especially when the data sets are measured in different units of measurement. For example, suppose a nutritionist would like to compare the obesity of school children in India and England. He collects data from some of the schools in these two countries. The weight is normally measured in kilograms in India and in pounds in England. It will be meaningless, if we compare the obesity of students using absolute measures. So it is sensible to compare them in relative measures. 1.5.1 Coefficient of Variation The standard deviation is an absolute measure of dispersion. It is expressed in terms of units in which the original figures are collected and stated. The standard deviation of heights of students cannot be compared with the standard deviation of weights of students, as both are expressed in different units, ie., heights in centimeter and weights in kilograms. Therefore the standard deviation must be converted into a relative measure of dispersion for the purpose of comparison. The relative measure is known as the coefficient of variation. The coefficient of variation is obtained by dividing the standard deviation by the mean and multiplying it by 100. Symbolically, Coefficient of Variation (C.V) = x 100 # v If we want to compare the variability of two or more series, we can use C.V. The series or groups of data for which the C.V is greater indicate that the group is more variable, less stable, less uniform, less consistent or less homogeneous. If the C.V is less, it indicates that the group is less variable, more stable, more uniform, more consistent or more homogeneous. Ch6_11th Stats.indd 171 2/3/2019 11:02:07 AM www.tntextbooks.in
- 16. 16 Merits: z z The C.V is independent of the unit in which the measurement has been taken, but standard deviation depends on units of measurement. Hence one should use the coefficient of variation instead of the standard deviation. Limitations: z z If the value of mean approaches 0, the coefficient of variation approaches infinity. So the minute changes in the mean will make major changes. Example 1.12 If the coefficient of variation is 50 per cent and a standard deviation is 4, find the mean. Solution: Coefficient of Variation = x 100 # v 50 = x 4 100 # x = 50 4 100 # =8 Example 1.13 The scores of two batsmen, A and B, in ten innings during a certain season, are as under: A: Mean score = 50; Standard deviation = 5 B: Mean score = 75; Standard deviation = 25 Find which of the batsmen is more consistent in scoring. Solution: Coefficient of Variation (C.V) = x 100 # v C.V for batsman A = 50 5 100 # = 10% C.V for batsman B = 75 25 100 # = 33.33% The batsman with the smaller C.V is more consistent. Since for Cricketer A, the C.V is smaller, he is more consistent than B. Ch6_11th Stats.indd 172 2/3/2019 11:02:08 AM www.tntextbooks.in
- 17. “Measures of Dispersion” 17 Example 1.14 The weekly sales of two products A and B were recorded as given below Product A 59 75 27 63 27 28 56 Product B 150 200 125 310 330 250 225 Find out which of the two shows greater fluctuations in sales. Solution: For comparing the fluctuations in sales of two products, we will prefer to calculate coefficient of variation for both the products. Product A: Let A = 56 be the assumed mean of sales for product A. Sales(x) Frequency(f) A= 56 d x A = − fd 2 fd 27 2 -29 -58 1682 28 1 -28 -28 784 56 A 1 0 0 0 59 1 3 3 9 63 1 7 7 49 75 1 19 19 361 Total 7 -57 2885 x = A + N fd / = 56 - 7 57 = 47.86 Variance σ2 = N fd 2 / N fd 2 / -c m = 7 2885 7 57 2 - - b l = 412.14-66.30 = 345.84 Standard deviation σ = . 345 84 = 18.59 Coefficient of variation (C.V) = x v 100 # = . . 47 86 18 59 100 # = 38.84 % Ch6_11th Stats.indd 173 2/3/2019 11:02:10 AM www.tntextbooks.in
- 18. 18 Product B Sales(x) Frequency(f) A= 225 d x A = − 2 fd 2 fd 125 1 -100 -100 10,000 150 1 -75 -75 5625 200 1 -25 -25 625 225 1 0 0 0 250 1 25 25 625 310 1 85 85 7225 330 1 105 105 11,025 Total 7 15 35,125 x = A + N fd / = 225+ 7 15 = 225 + 2.14 = 227.14 Variance 2 v = N fd 2 / N fd 2 / -c m = 7 35125 7 15 2 -b l = 5017.85 - 4.59 = 5013.26 Standard deviation = . 5013 26 = 70.80 Coefficient of variation (C.V) B = . . 227 14 70 80 100 # = 31.17% Since the coefficient of variation for product A is more than that of product B, Therefore the fluctuation in sales of product A is higher than product B. 1.6 Moments 1.6.1 Raw moments: Raw moments can be defined as the arithmetic mean of various powers of deviations taken from origin. The rth Raw moment is denoted by r n l, r = 1,2,3... Then the first raw moments are given by Ch6_11th Stats.indd 174 2/3/2019 11:02:11 AM www.tntextbooks.in
- 19. “Measures of Dispersion” 19 Raw moments Raw data (d=x - A) Discrete data (d=x - A) Continuous data (d = (x – A) /c) 1 n l n d / N fd / N fd c # / 2 n l n d2 / N fd2 / N fd c 2 2 # / 3 n l n d3 / N fd3 / N fd c 3 3 # / 4 n l n d4 / N fd4 / N fd c 4 4 # / 6.6.2 Central Moments: Central moments can be defined as the arithmetic mean of various powers of deviation taken from the mean of the distribution. The r th central moment is denoted by r n , r = 1, 2, 3... Central moments Raw data Discrete data Continuous data d c x x = - l ] g 1 n ( ) 0 = − ∑ n x x ( ) 0 = − ∑ N x x f ' N fd c # / 2 n ( ) 0 2 = − ∑ N x x f N f x x 2 2 v - = ] g / ' N fd c 2 2 # / 3 n n x x 3 - ] g / N f x x 3 - ] g / ' N fd c 3 3 # / 4 n n x x 4 - ] g / N f x x 4 - ] g / ' N fd c 4 4 # / In general, given n observation x1 , x2 , …, xn the rth order raw moments (r = 0,1,2,...) are defined as follows: NOTE Raw moments are denoted by 'r n and central moments are denoted by r n 'r n = ( ) N f x A 1 r / - (about A) 'r n = N fxr / (about origin) r n = N f x x 1 r / - ] g (about mean) Ch6_11th Stats.indd 175 2/3/2019 11:02:17 AM www.tntextbooks.in
- 20. 20 1.6.3 Relation between raw moments and central moments 1 n = 0 2 n = ' ' 2 1 2 n n -^ h 3 n = ' ' ' ' 3 2 3 2 1 1 3 n n n n - + 4 n = ' ' ' ( ) ( ') 4 6 3 ' ' 4 3 1 2 1 2 1 4 n n n n n n - + - Example 1.15 The first two moments of the distribution about the value 5 of the variable, are 2 and 20.find the mean and the variance. Solution: ' , 2 20 1 2 n n = = l and A 5 = x = ' A 1 n + x = 2+5=7 2 v = ' ' 2 1 2 n n -^ h 2 v = 20 2 16 2 - = Mean = 7 and Variance = 16 1.7 SKEWNESS AND KURTOSIS There are two other comparable characteristics called skewness and kurtosis that help us to understand a distribution. 1.7.1 Skewness Skewness means ‘lack of symmetry’. We study skewness to have an idea about the shape of the curve drawn from the given data. When the data set is not a symmetrical distribution, it is called a skewed distribution and such a distribution could either be positively skewed or negatively skewed. The concept of skewness will be clear from the following three diagrams showing a symmetrical distribution, a positively skewed distribution and negatively skewed distribution. We can see the symmetricity from the following diagram. Ch6_11th Stats.indd 176 2/3/2019 11:02:18 AM www.tntextbooks.in
- 21. “Measures of Dispersion” 21 (a) Symmetrical Distribution Mean = Median = Mode Fig.6.1 It is clear from the diagram below that in a symmetrical distribution the values of mean, median and mode coincide. The spread of the frequencies is the same on both sides of the centre point of the curve. (b) Positively Skewed Distribution Right-Skewed (Positive Skewness Fig.6.2 Mode Median Mean In the positively skewed distribution the value of the mean is maximum and that of mode is least – the median lies in between the two. In the positively skewed distribution the frequencies are spread out over a greater range of values on the high-value end of the curve (the right-hand side) than they are on the low – value end. For a positively skewed distribution, Mean>Median> Mode (c) Negatively skewed distribution Left-Skewed (Positive Skewness Fig.6.3 Mode Median Mean In a negatively skewed distribution the value of mode is maximum and that of mean least-the median lies in between the two. In the negatively skewed distribution the position is reversed, i.e., the excess tail is on the left-hand side. It should be noted that in moderately symmetrical distribution the interval between the mean and the median is approximately one-third of the interval between the mean and the mode. It is this relationship which provides a means of measuring the degree of skewness. d. Some important Measures of Skewness (i) Karl-Pearson coefficient of skewness (ii) Bowley’s coefficient of skewness (iii) Coefficient of skewness based on moments Ch6_11th Stats.indd 177 2/3/2019 11:02:18 AM www.tntextbooks.in
- 22. 22 (i) Karl – Person coefficient of skewness According to Karl-Pearson the absolute measure of skewness = Mean – Mode. Karl- Pearson coefficient of skewness = . S D Mean Mode - Example 1.16 From the known data, mean = 7.35, mode = 8 and Variance = 1.69 then find the Karl- Pearson coefficient of skewness. Solution: Karl- Pearson coefficient of skewness = . S D Mean Mode - Variance = 1.69 Standard deviation = . 1 69 = 1.3 Karl- Pearson coefficient of skewness = . . 1 3 7 35 8 - = . . 1 3 0 65 - = - 0.5 (ii) Bowley’s coefficient of skewness In Karl Pearson method of measuring skewness the whole of the series is needed. Prof. Bowley has suggested a formula based on position of quartiles. In symmetric distribution quartiles will be equidistance from the median. Q2 – Q1 = Q3 – Q2 , but in skewed distributions it may not happen. Hence Bowley’s coefficient of skewness (SK) = Q Q Q Q Q 2 3 1 3 1 2 - + - Example 1.17 If Q1 = 40, Q2 = 50, Q3 = 60, find Bowley’s coefficient of skewness NOTE If the difference between the mean and median or mean and mode is greater, the data is said to be more dispersed. Solution: Bowley’s coefficient of skewness = Q Q Q Q Q 2 3 1 3 1 2 - + - Bowley’s coefficient of skewness = 60 40 40 60 2 50 20 0 0 # - + - = = ` Given distribution is symmetric. Ch6_11th Stats.indd 178 2/3/2019 11:02:19 AM www.tntextbooks.in
- 23. “Measures of Dispersion” 23 (iii) Measure of skewness based on Moments The Measure of skewness based on moments is denoted by β1 and is given by β1 = 2 3 3 2 n n Example 1.18 Find β1 for the following data 1 n = 0, 2 n = 8.76, 3 n = -2.91 Solution: 1 b = 2 3 3 2 n n 1 b = ( . ) ( . ) 8 76 2 91 3 2 - = . . 672 24 8 47 . 0 0126 = 1.7.2 Kurtosis Kurtosis in Greek means ‘bulginess’. In statistics kurtosis refers to the degree of flatness or peakedness in the region about the mode of a frequency curve. The degree of kurtosis of distribution is measured relative to the peakedness of normal curve. In other words, measures of kurtosis tell us the extent of which a distribution is more peaked or flat-topped than the normal curve. The following diagram illustrates the shape of three different curves mentioned below: Fig.6.4 Leptokutic Mesokurtic Platykurtic If a curve is more peaked than the normal curve, it is called ‘leptokurtic’. In such a case items are more closely bunched around the mode. On the other hand if a curve is more flat-topped than the normal curve, it is called ‘platykurtic’. The bell shaped normal curve itself is known as ‘mesokurtic’. We can find how much the frequency curve is flatter than the normal curve using measure of kurtosis. Measures of Kurtosis The most important measure of kurtosis is the value of the coefficient. It is defined as: coefficient of kurtosis 2 b = 2 2 4 n n Ch6_11th Stats.indd 179 2/3/2019 11:02:21 AM www.tntextbooks.in
- 24. 24 NOTE The greater the value of 2 b , the more peaked the distribution. (i) The normal curve and other curves with 2 b = 3 are called mesokurtic. (ii) When the value of 2 b is greater than 3, the curve is more peaked than the normal curve, i.e., leptokurtic. (iii) When the value of 2 b is less than 3 the curve is less peaked than the normal curve, i.e., platykurtic. Example 6.19 Find the value of β2 for the following data . 0 4 0 37 6 1 2 3 4 n n n n = = = = Solution: 2 b = 2 2 4 n n 2 b = . . 4 37 2 16 37 6 2 = = 2.35 < 3 2 b < 3, The curve is platykurtic. Fig.6.5 37.6 Ch6_11th Stats.indd 180 2/3/2019 11:02:21 AM www.tntextbooks.in