Download to read offline

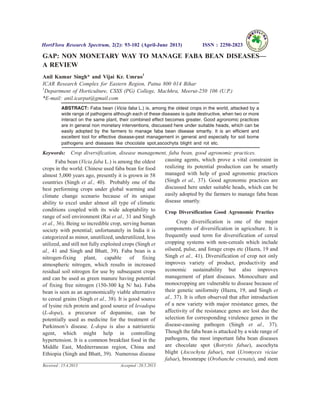
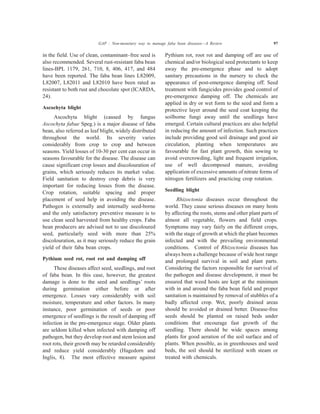
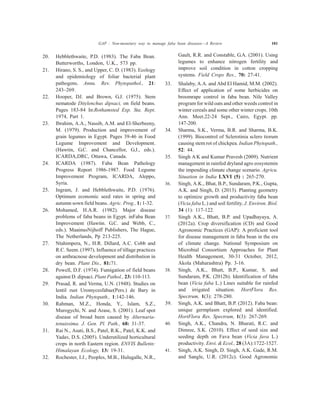
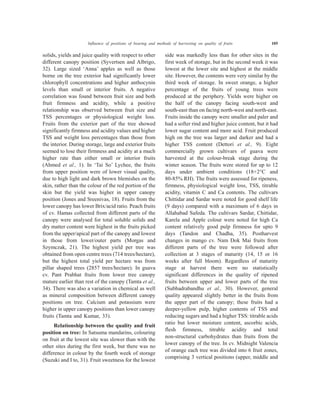
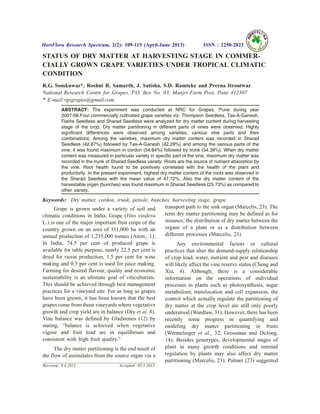
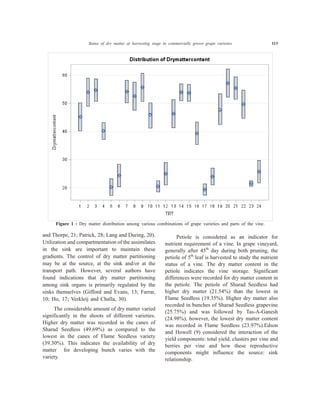
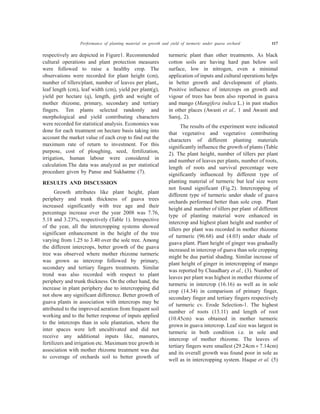
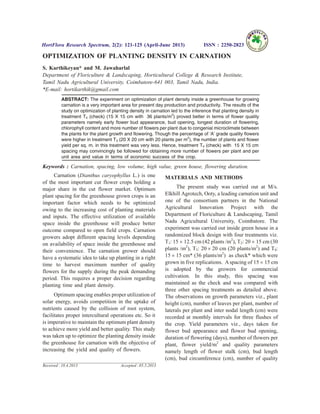
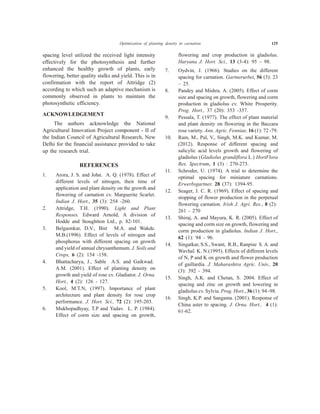
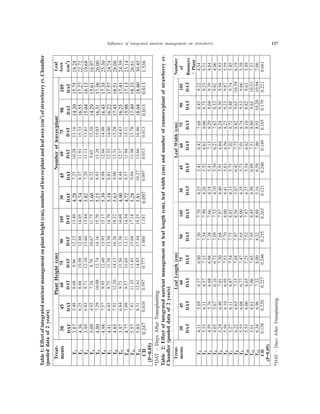
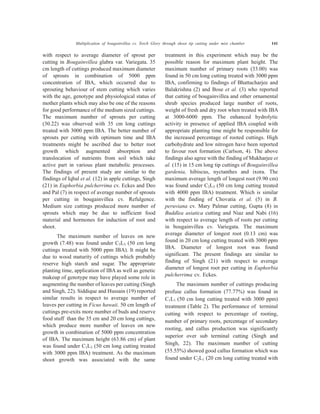
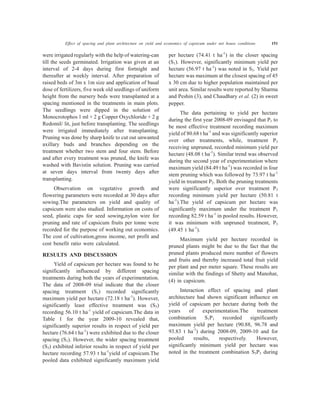
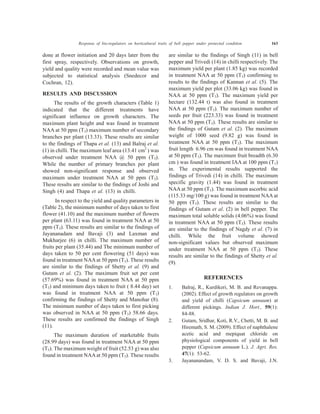
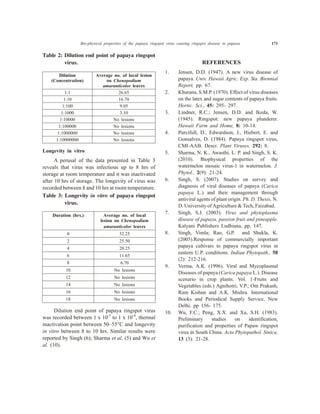
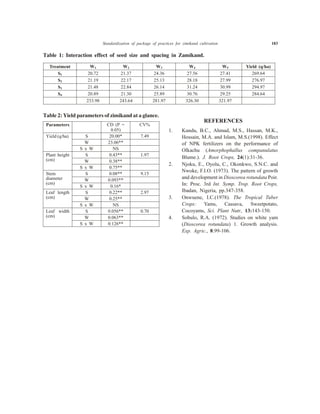
![Distribution pattern of diamondback moth on cabbage under gangetic alluvial condition 147
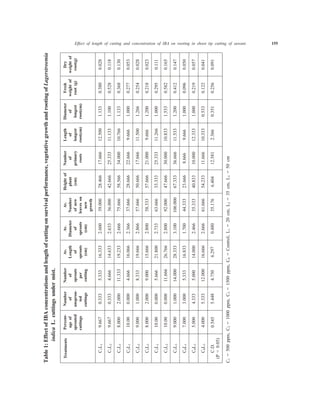
,htomkcabdnomaidfonrettapnoitubirtsiD:1elbaT,alletsolyx.P5gnirudegabbacylraenoht
9ot9002,rebotcOht
.9002,rebmevoN
foetaD
gnikat
noitavresbo
porC
ega
)syaD(
fo.oN
selpmas
naeM
X
ecnairaV
S2
noisrepsiD
retemaraP
K
X
Sx
=
-
2
2
foxednI
-repsiD
nois
IdS=2
/`X
lacorpiceR
)K/I(=Kfo
-ixaM
mum
-lugeR
ytira
)n/1(
s’eloC
xednI
IC=
Sx2
(/Sx)2
reilrahC
tneiciffeoC
001´
SX2
-
´/1X
dyolL
foxedni
naem
gnidworc
=xx+
s([2
/x])-1
dyolL
ssenihctap
xedni
90/01/505104574.0178.0075.0438.1657.1520.0911.0705.231903.1657.2
90/01/010204578.0489.0620.7521.1241.0520.0650.0727.73000.1241.1
90/01/515204053.1009.2671.1841.2058.0520.0460.0122.29894.2058.1
90/01/020304058.1779.3906.1051.2126.0520.0350.0238.87000.3126.1
90/01/525304057.1639.3104.1942.2417.0520.0650.0484.48999.2417.1
90/01/030404005.1333.3722.1222.2518.0520.0160.0762.09227.2518.1
90/11/405404524.1016.2417.1138.1385.0520.0650.0973.67652.2385.1
90/11/900504009.0624.1145.1485.1946.0520.0860.0755.08484.1946.1
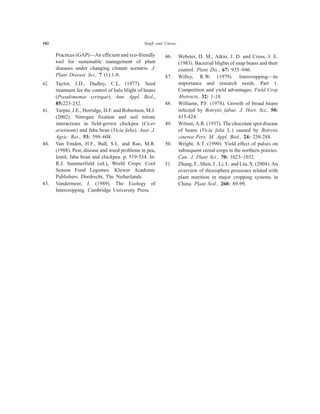
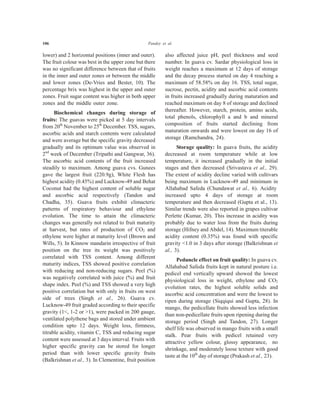
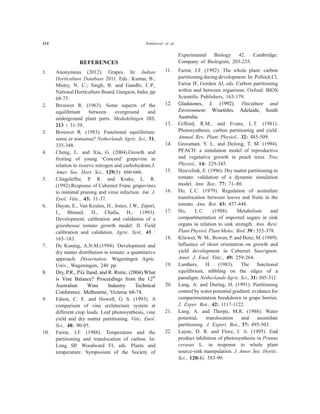
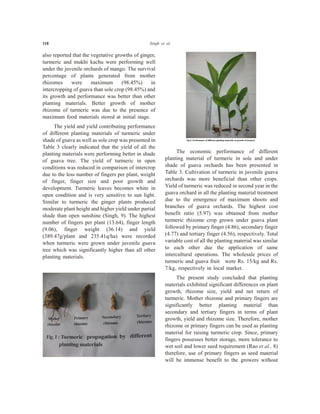
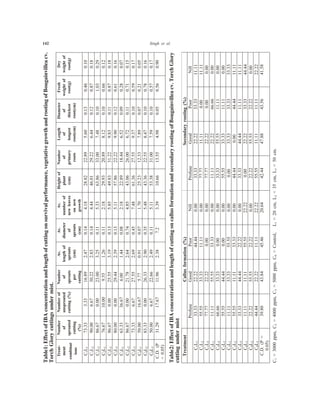
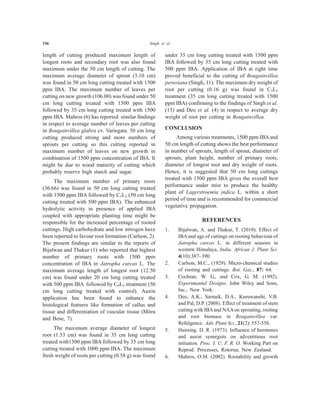
,htomkcabdnomaidfonrettapnoitubirtsiD:2elbaTalletsolyx.P32gnirudegabbacno,dr
81ot9002,rebmevoNht
no(9002,rebmeceD
)egabbacnosaes
foetaD
gnikat
noitavresbo
porC
ega
)syaD(
fooN
selpmas
naeM
`X
ecnairaV
S2
-repsiD
nois
retemaraP
K
X
Sx
=
-
2
2
foxednI
-repsiD
nois
IdS=2
/`X
lacorpiceR
fo
)K/I(=K
mumixaM
ytiralugeR
)n/1(
s’eloC
xednI
IC=
Sx2
(/Sx)2
reilrahC
eiciffeoC
tn
001´
SX2
-
´/1X
dyolL
foxedni
naem
gnidworc
=xx+
s([2
/x])-1
dyolL
ssenihctap
xedni
90/11/325104524.0217.0926.0676.1095.1520.01121.0290.621101.1095.2
90/11/820204528.0969.0047.4471.1112.0520.07950.0139.54999.0112.1
90/21/305204520.1652.1355.4522.1022.0520.01450.0768.64052.1022.1
90/21/800304057.0019.0015.3412.1582.0520.04460.0673.35469.0582.1
90/21/315304006.0957.0562.2562.1244.0520.04670.0354.66568.0244.1
90/21/810404523.0536.0043.0559.1739.2520.06171.0783.171082.1739.3](https://image.slidesharecdn.com/fc9a88a7-3f12-4a93-90ce-e99b05cd72f3-161102170131/85/6-HortFlora-Full-PDF-Vol-2-2-Apr-Jun2013-59-320.jpg)
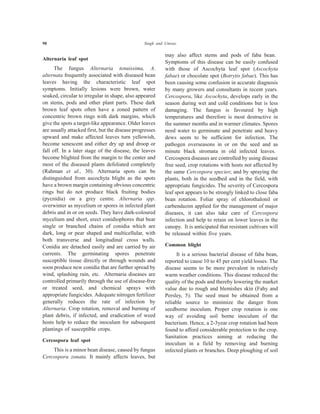
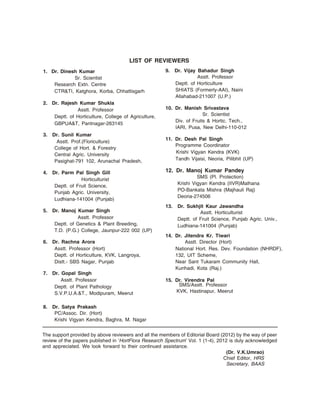
![148 Goswami and Mukhopadhyay
moth was aggregative distribution. The study
further indicated that aggregation was species
characteristic, as it did not alter even in different
cabbage seasons.
Distribution pattern of diamondback moth on
cabbage have been studied by various scientists in
different parts of India but it is reported by the
present author for the first time from West Bengal.
Rai et al. (7) studied the spatial distribution of
diamondback moth on cabbage and cauliflower at
Panipat (Haryana), Jaunpur (Uttar Pradesh) Ranchi
(Jharkhand) and Delhi during 1988-89 and they
found the aggregative pattern of distribution of the
pest on both the crops which corroborates the
finding by the present author. Reddy et al. (8)
reported spatial distribution of DBM larvae on
cabbage at Hyderabad during 1994-95. They
calculated several indices like variance-mean ratio,
Coles Index, K of negative binomial and Lloyds
Index of mean crowding which showed aggregative
nature of distribution of diamondback moth. The
value of these indices in present study also
supported the same distribution pattern as reported
by Reddy et al. (8) and Mishra et. al. (6). The
findings of the present study also corroborated the
distribution pattern as reported by Koteswara Rao
and Lal (4) who also reported spatial distribution
pattern of DBM larvae on cabbage under Delhi
condition.
REFERENCES
1. Anonymous (2005). Cabbage: Cabbage History,
Cabbage Facts & Recipes. USDA Nutrient
Database. Available from
http://www.nal.usda.gov/2005/fnic/food.
2. Cole, L.C. (1946). A theory for analyzing
contagiously distributed populations. Ecology,
27 : 329-341.
3. Elliott, J.M. (1977). Some methods for
statistical analysis of benthic invertebrates.
Fresh water biological association. Scientific
Publication- 25, P. 156 .
4. Koteswara Rao, S.R. and Lal, O.P. (1999).
Distribution pattern of diamondback moth
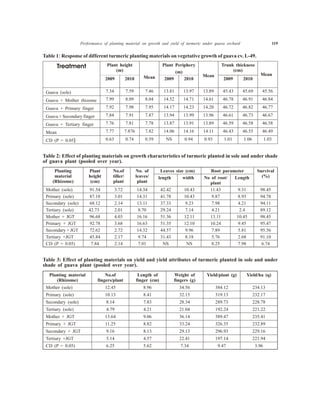
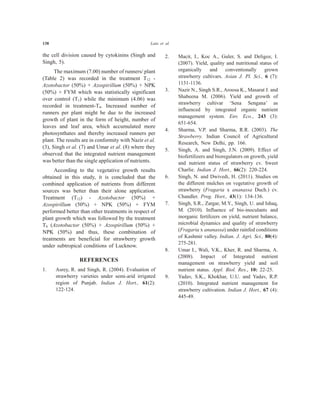
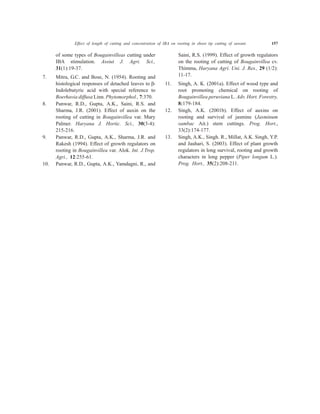
,htomkcabdnomaidfonrettapnoitubirtsiD:3elbaTalletsolyx.P82gnirudegabbacetalno,ht
2ot0102,yraurbeFdn
0102,lirpA
foetaD
gnikat
-avresbo
noit
egaporC
)syaD(
fooN
selpmas
naeM
`X
-iraV
ecna
S2
-repsiD
nois
-araP
retem
K
X
Sx
=
-
2
2
foxednI
-repsiD
nois
IdS=2
/`X
-orpiceR
lac
fo
)K/I(=K
mumixaM
-lugeR
ytira
)n/1(
s’eloC
xednI
IC=
Sx2
(/Sx)2
reilrahC
neiciffeoC
t
001´
SX2
-
´/1X
dyolL
foxedni
naem
gnidworc
=xx+
s([2
/x])-1
dyolL
ssenihctap
xedni
01/20/825104051.1328.1569.1585.1905.0520.06850.0043.17537.1905.1
01/30/400204527.1046.3455.1011.2446.0520.08450.0032.08538.2446.1
01/30/905204059.1316.2737.5043.1471.0520.07140.0157.14092.2471.1
01/30/310304577.2046.6299.1393.2205.0520.00640.0948.07861.4205.1
01/30/815304003.3776.01674.1532.3776.0520.09840.0503.28535.5776.1
01/30/320404007.3780.31854.1735.3686.0520.03840.0708.28732.6686.1
01/30/825404057.5442.02182.2125.3834.0520.09930.0902.66172.8834.1
01/40/200504005.4967.61056.1627.3606.0520.02540.0938.77062.7606.1](https://image.slidesharecdn.com/fc9a88a7-3f12-4a93-90ce-e99b05cd72f3-161102170131/85/6-HortFlora-Full-PDF-Vol-2-2-Apr-Jun2013-60-320.jpg)


This document summarizes good agronomic practices (GAP) that can be used to manage diseases in faba bean crops. It discusses how crop diversification, intercropping faba beans with cereals, and appropriate crop rotations can disrupt disease cycles and reduce pathogen buildup. Intercropping in particular has been shown to decrease incidence and severity of diseases in both faba beans and intercropped components. The document also reviews how faba beans can improve soil nitrogen levels and increase yields and protein content of subsequent crops. Finally, it provides an overview of the most important diseases of faba beans, including chocolate spot, ascochyta blight, and rust, and how GAPs like rotations, tillage, and


