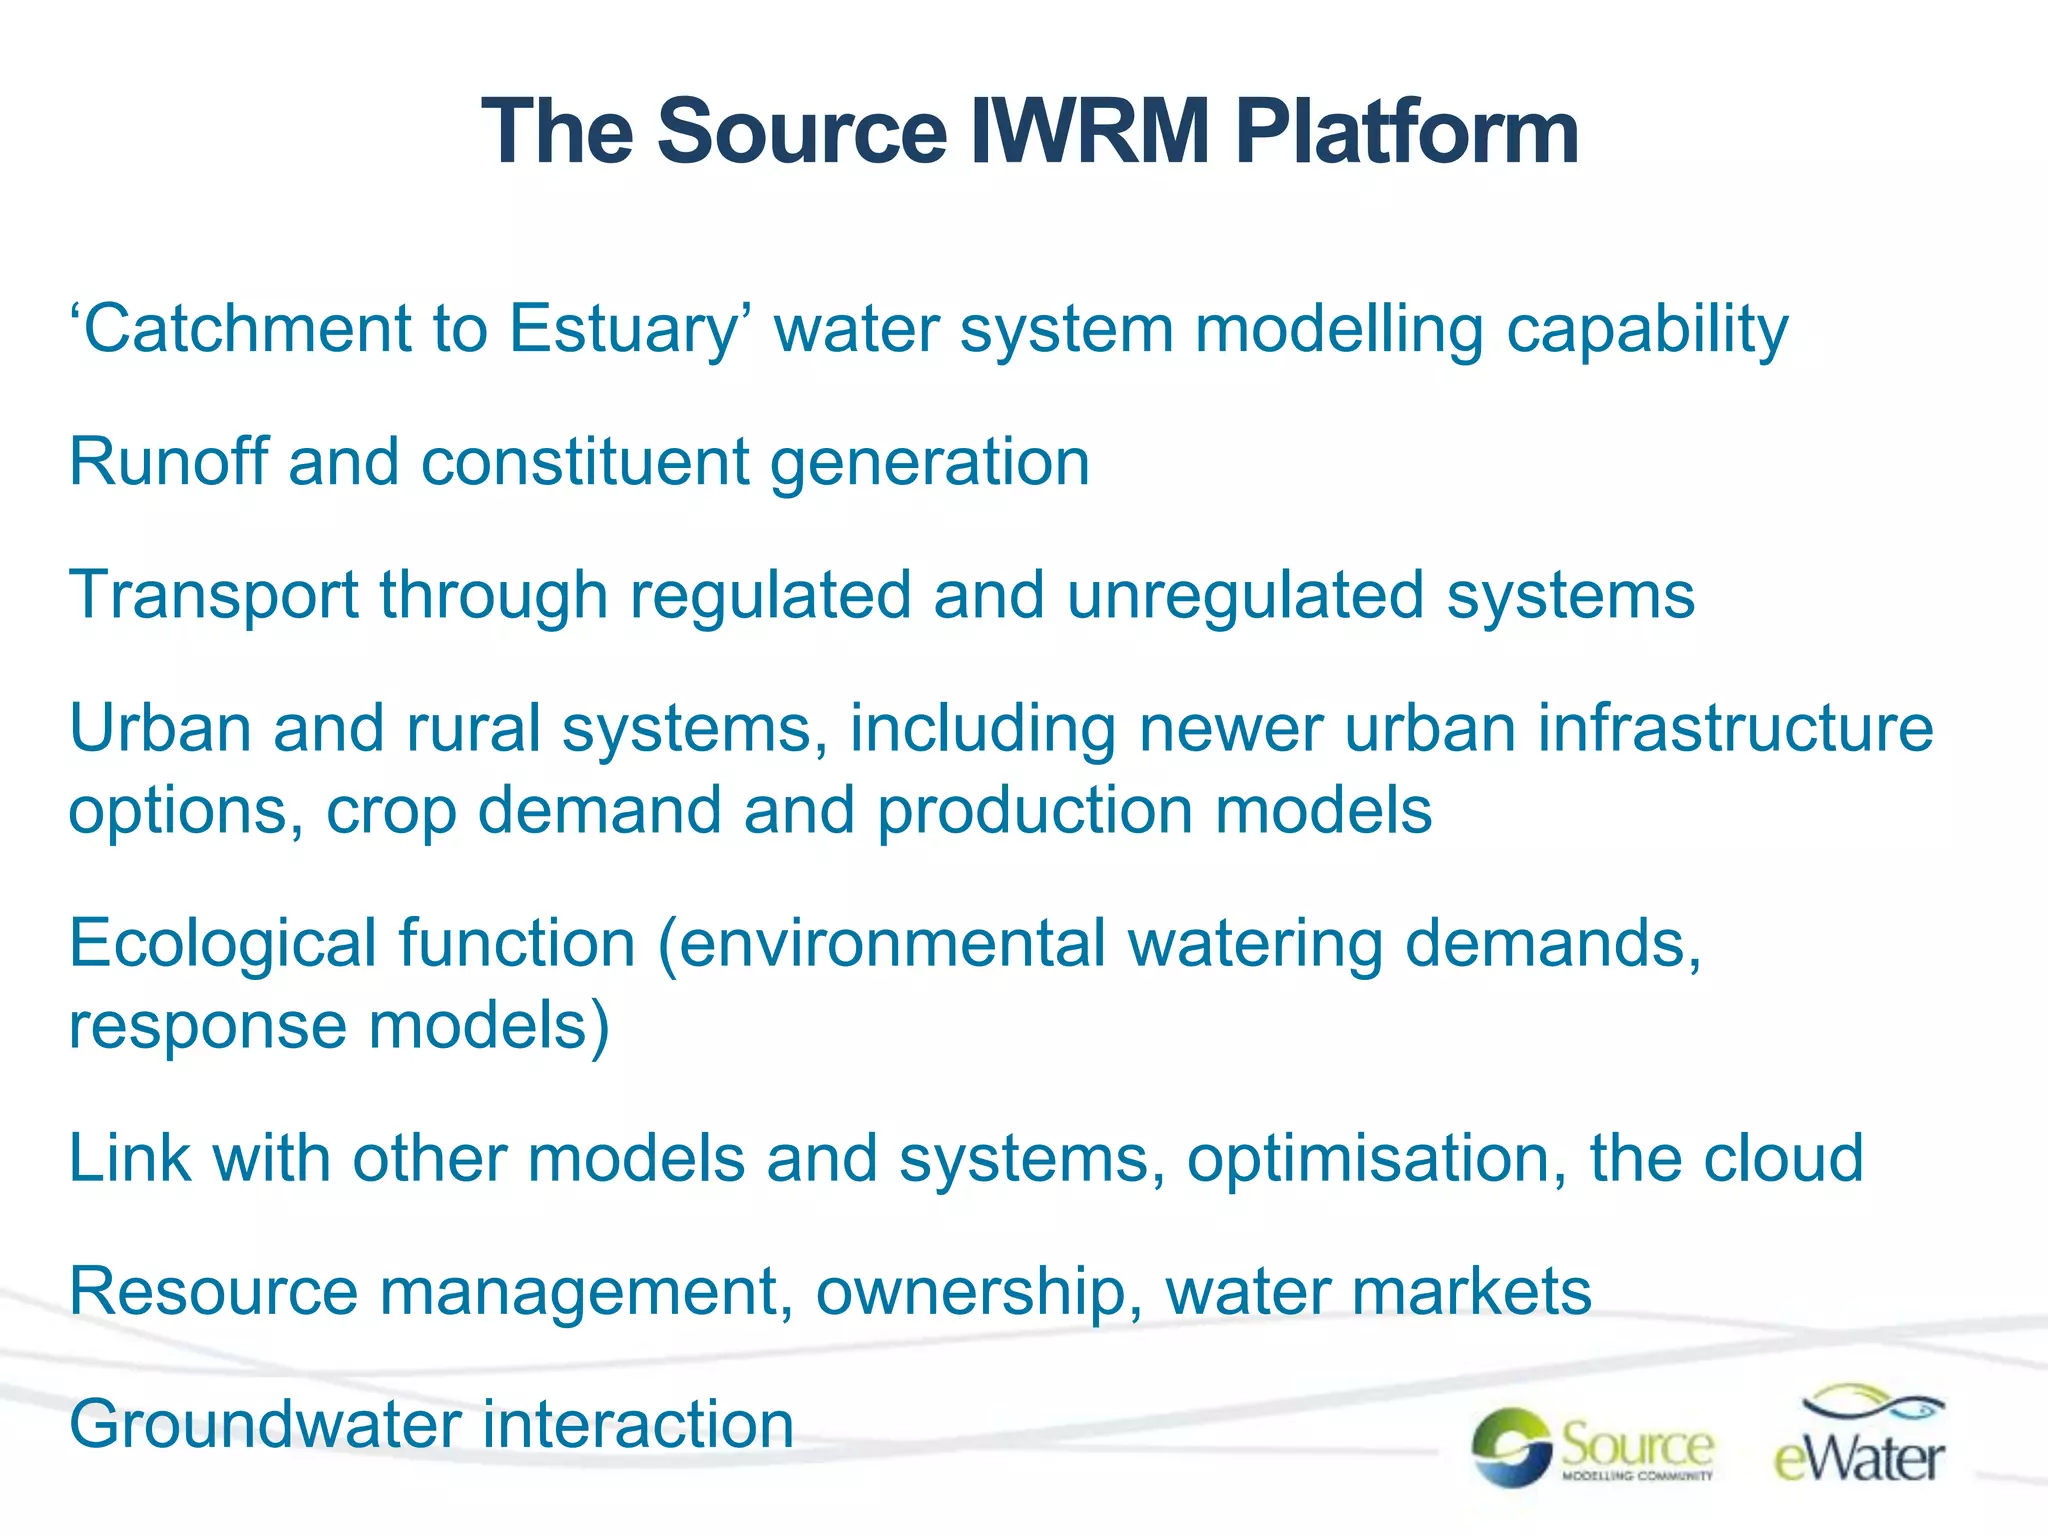
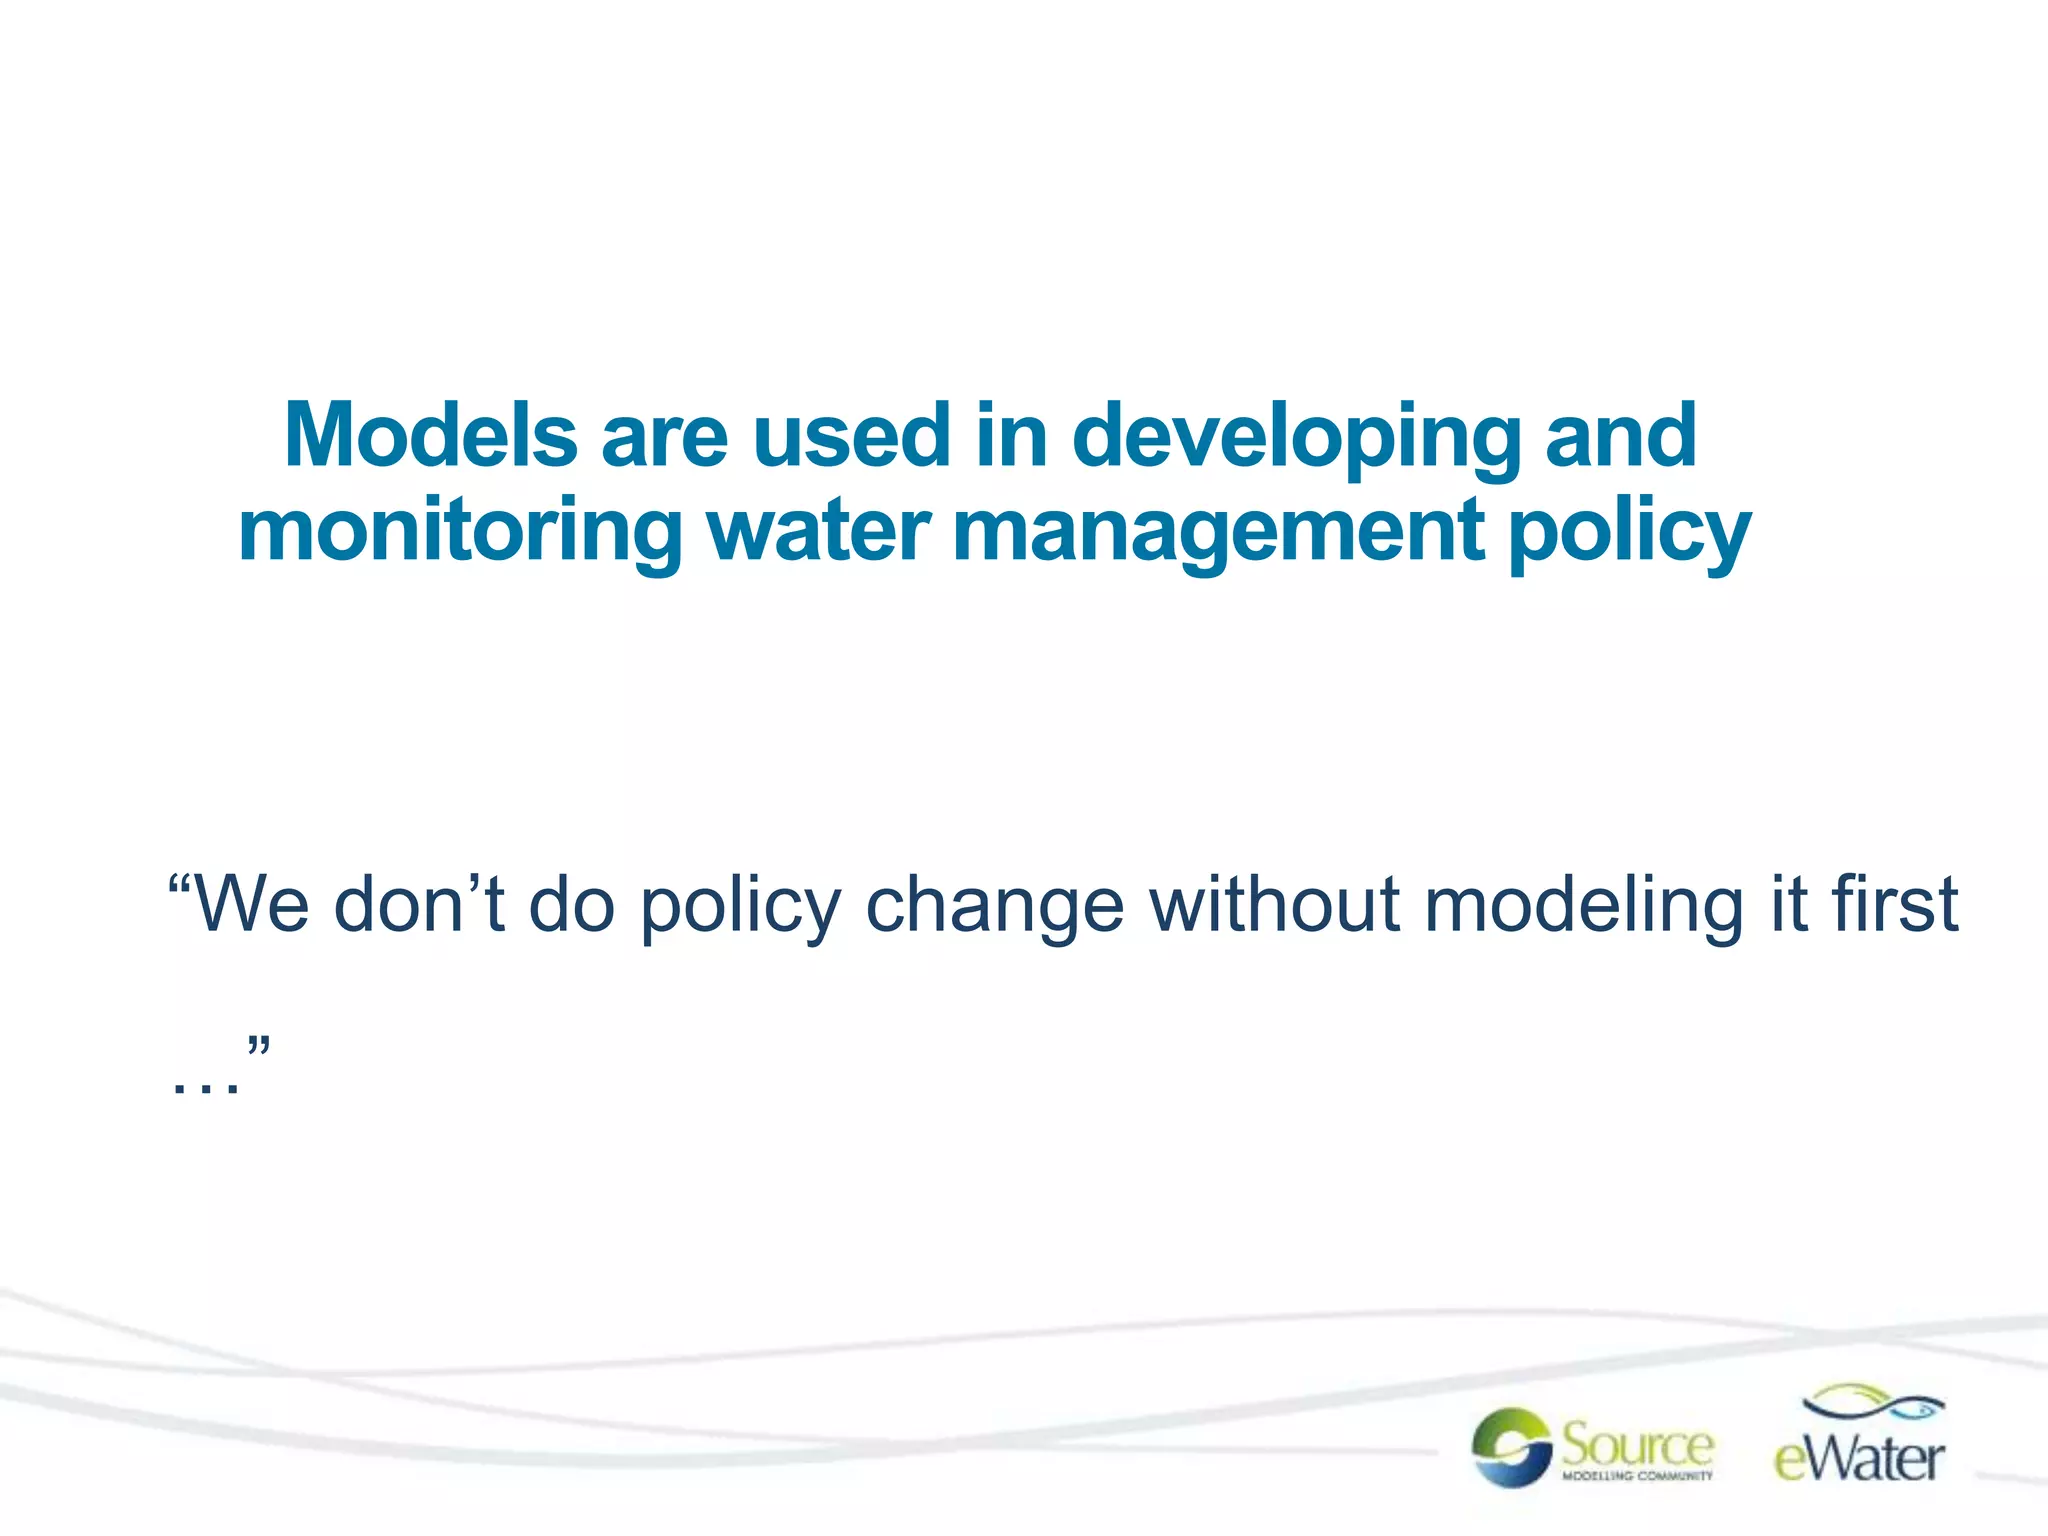
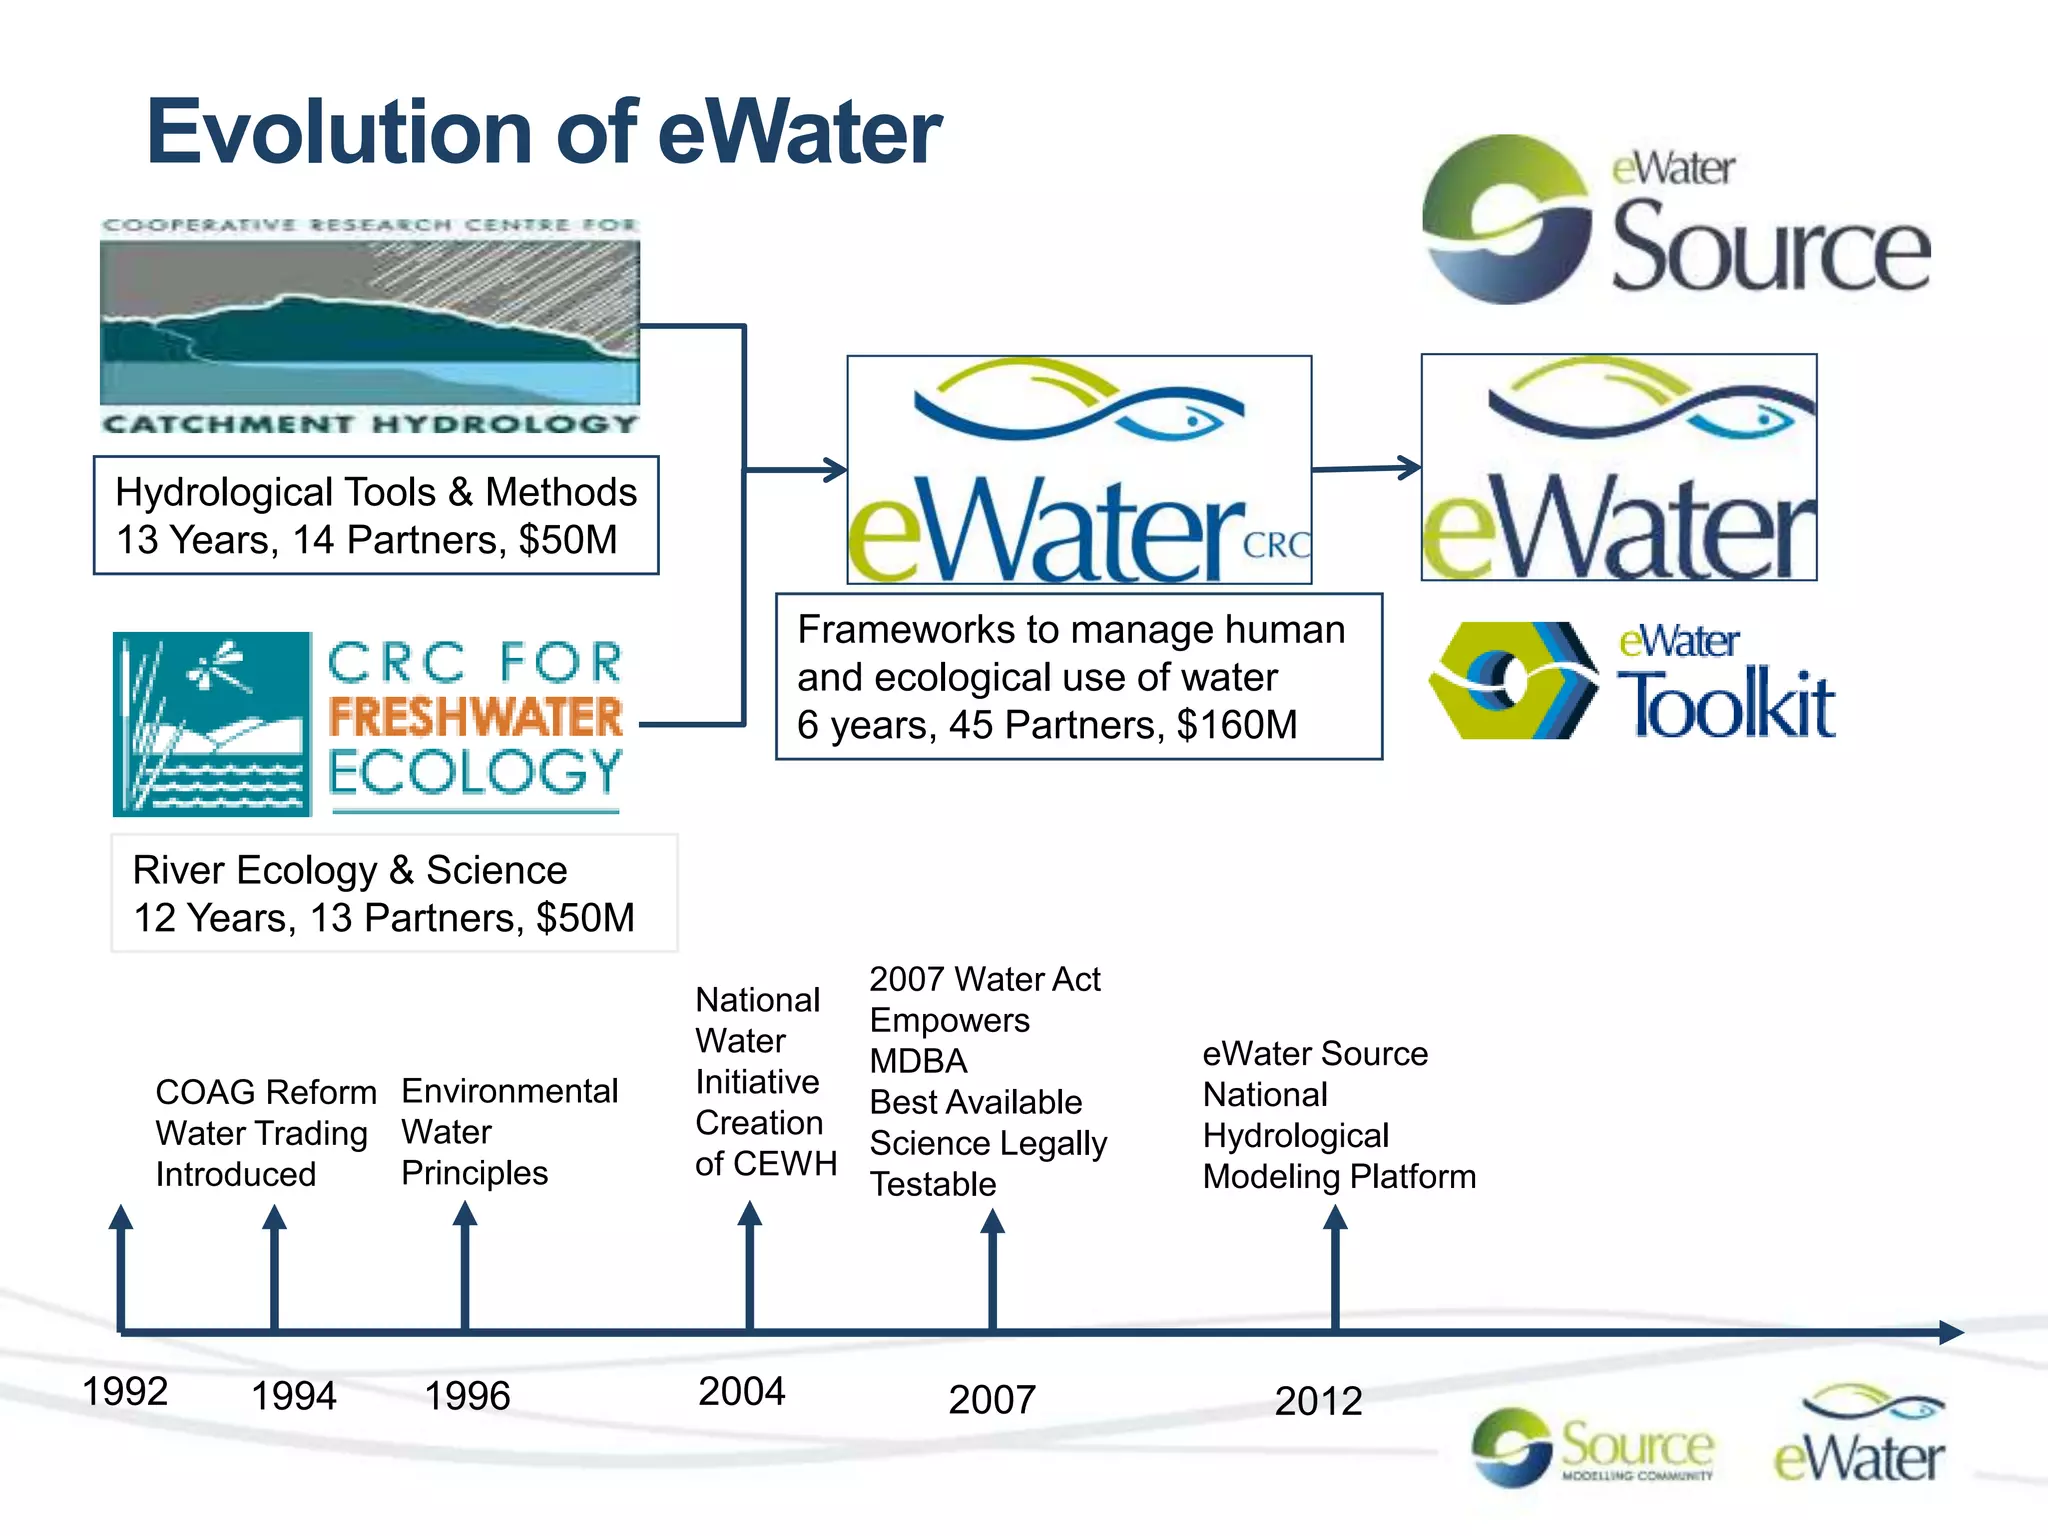
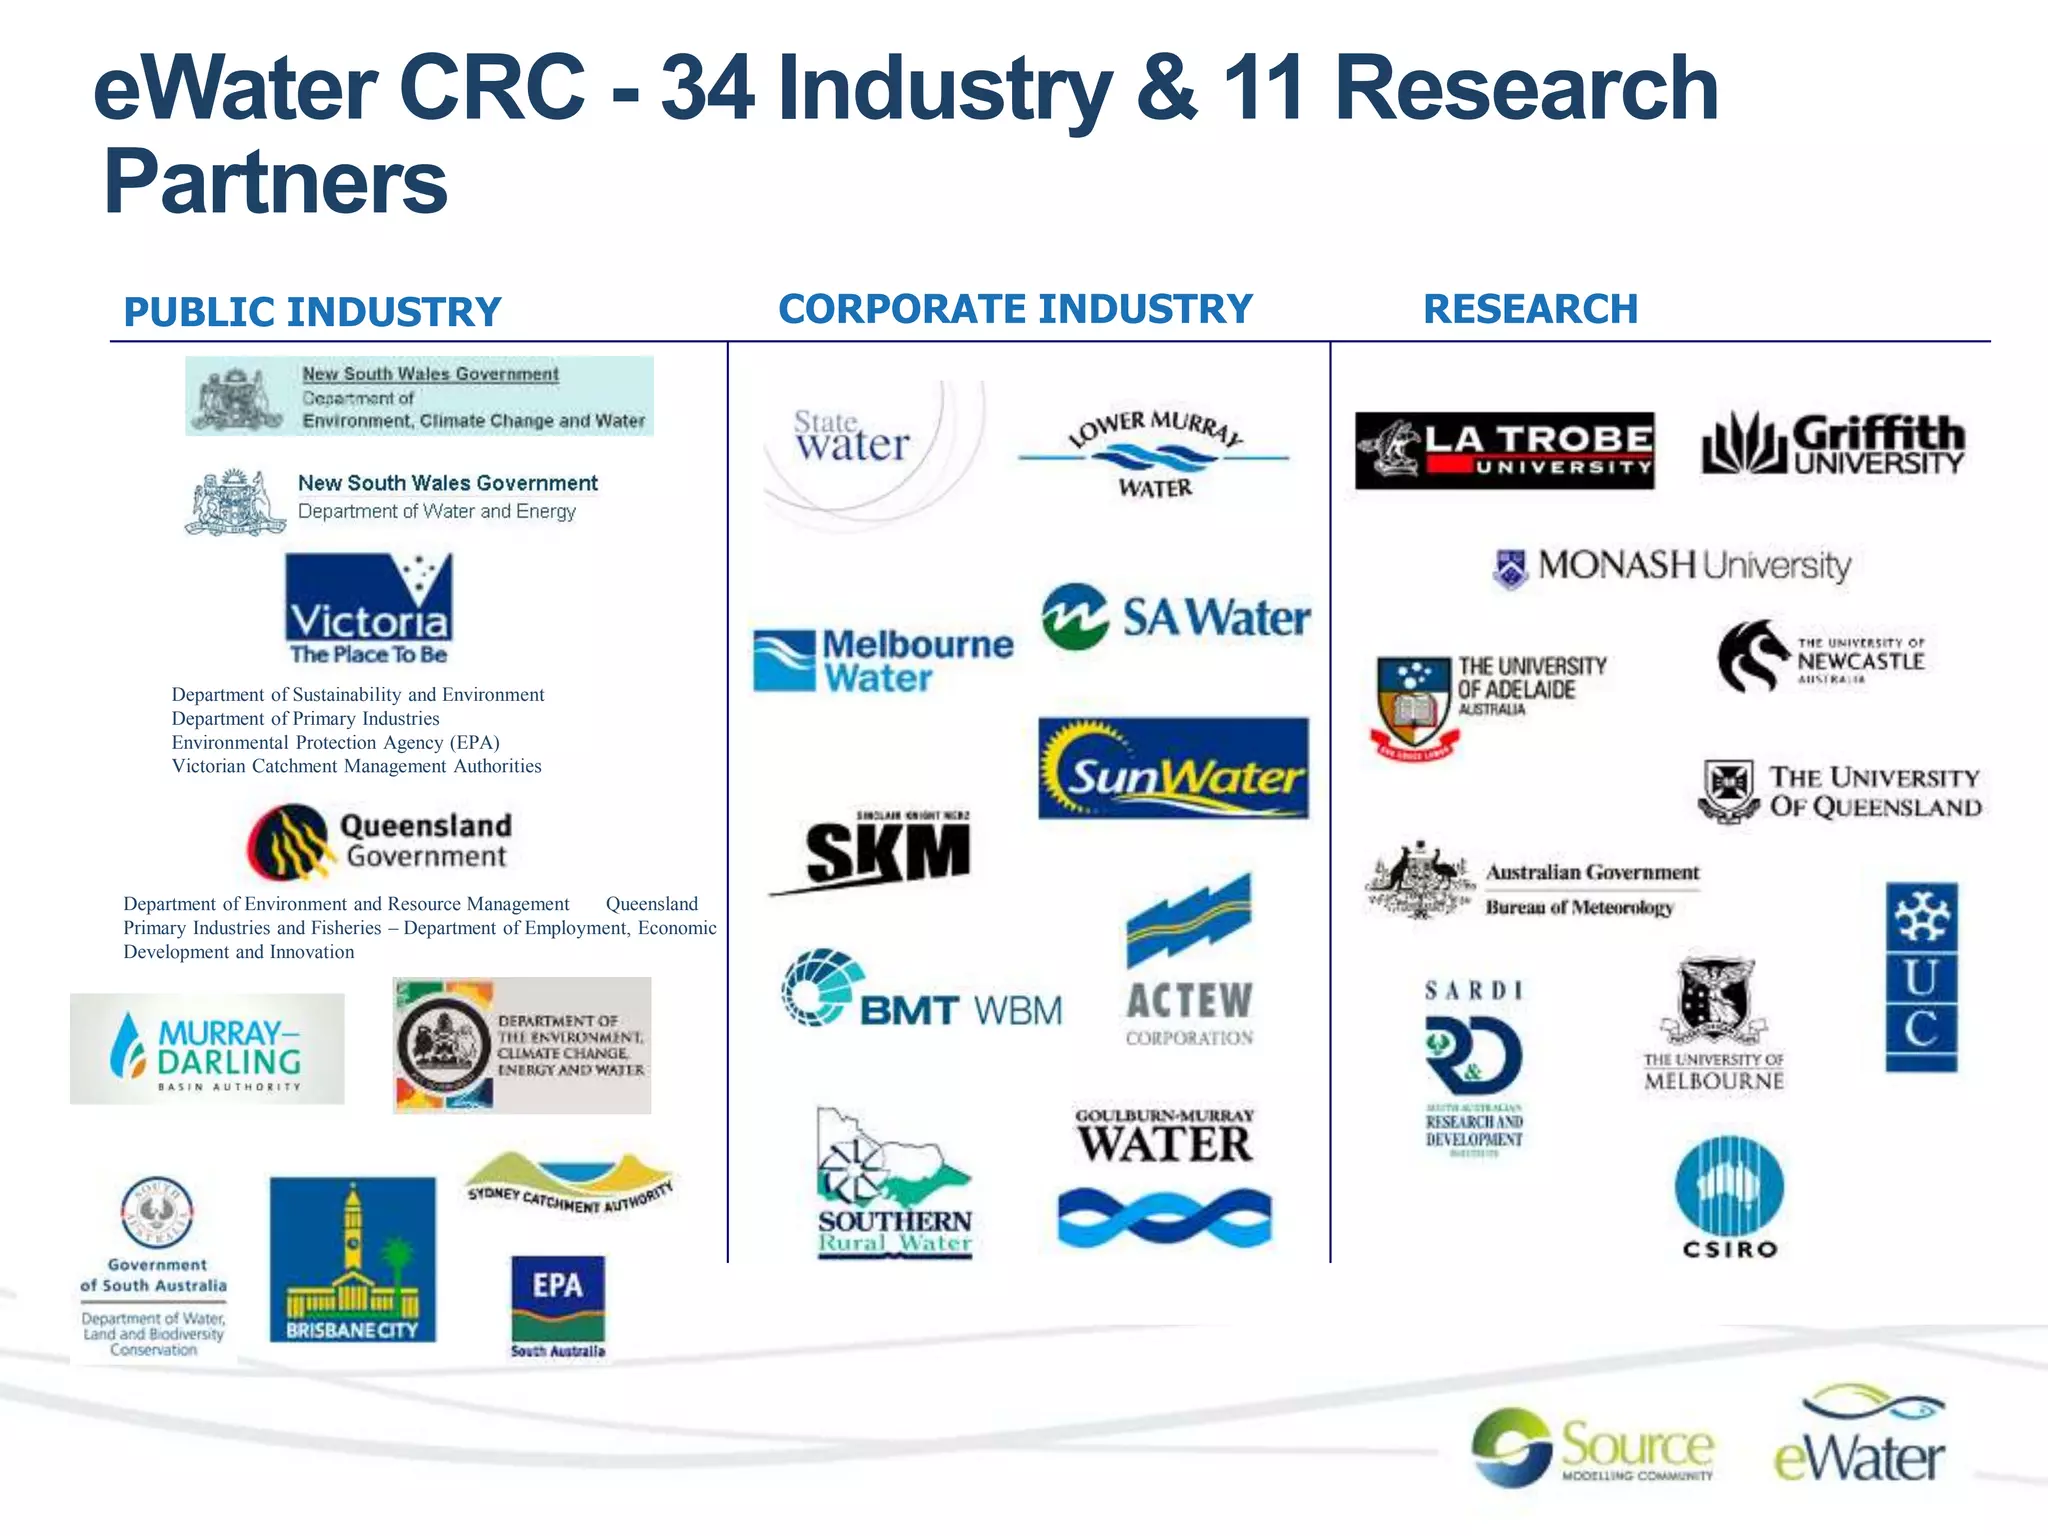
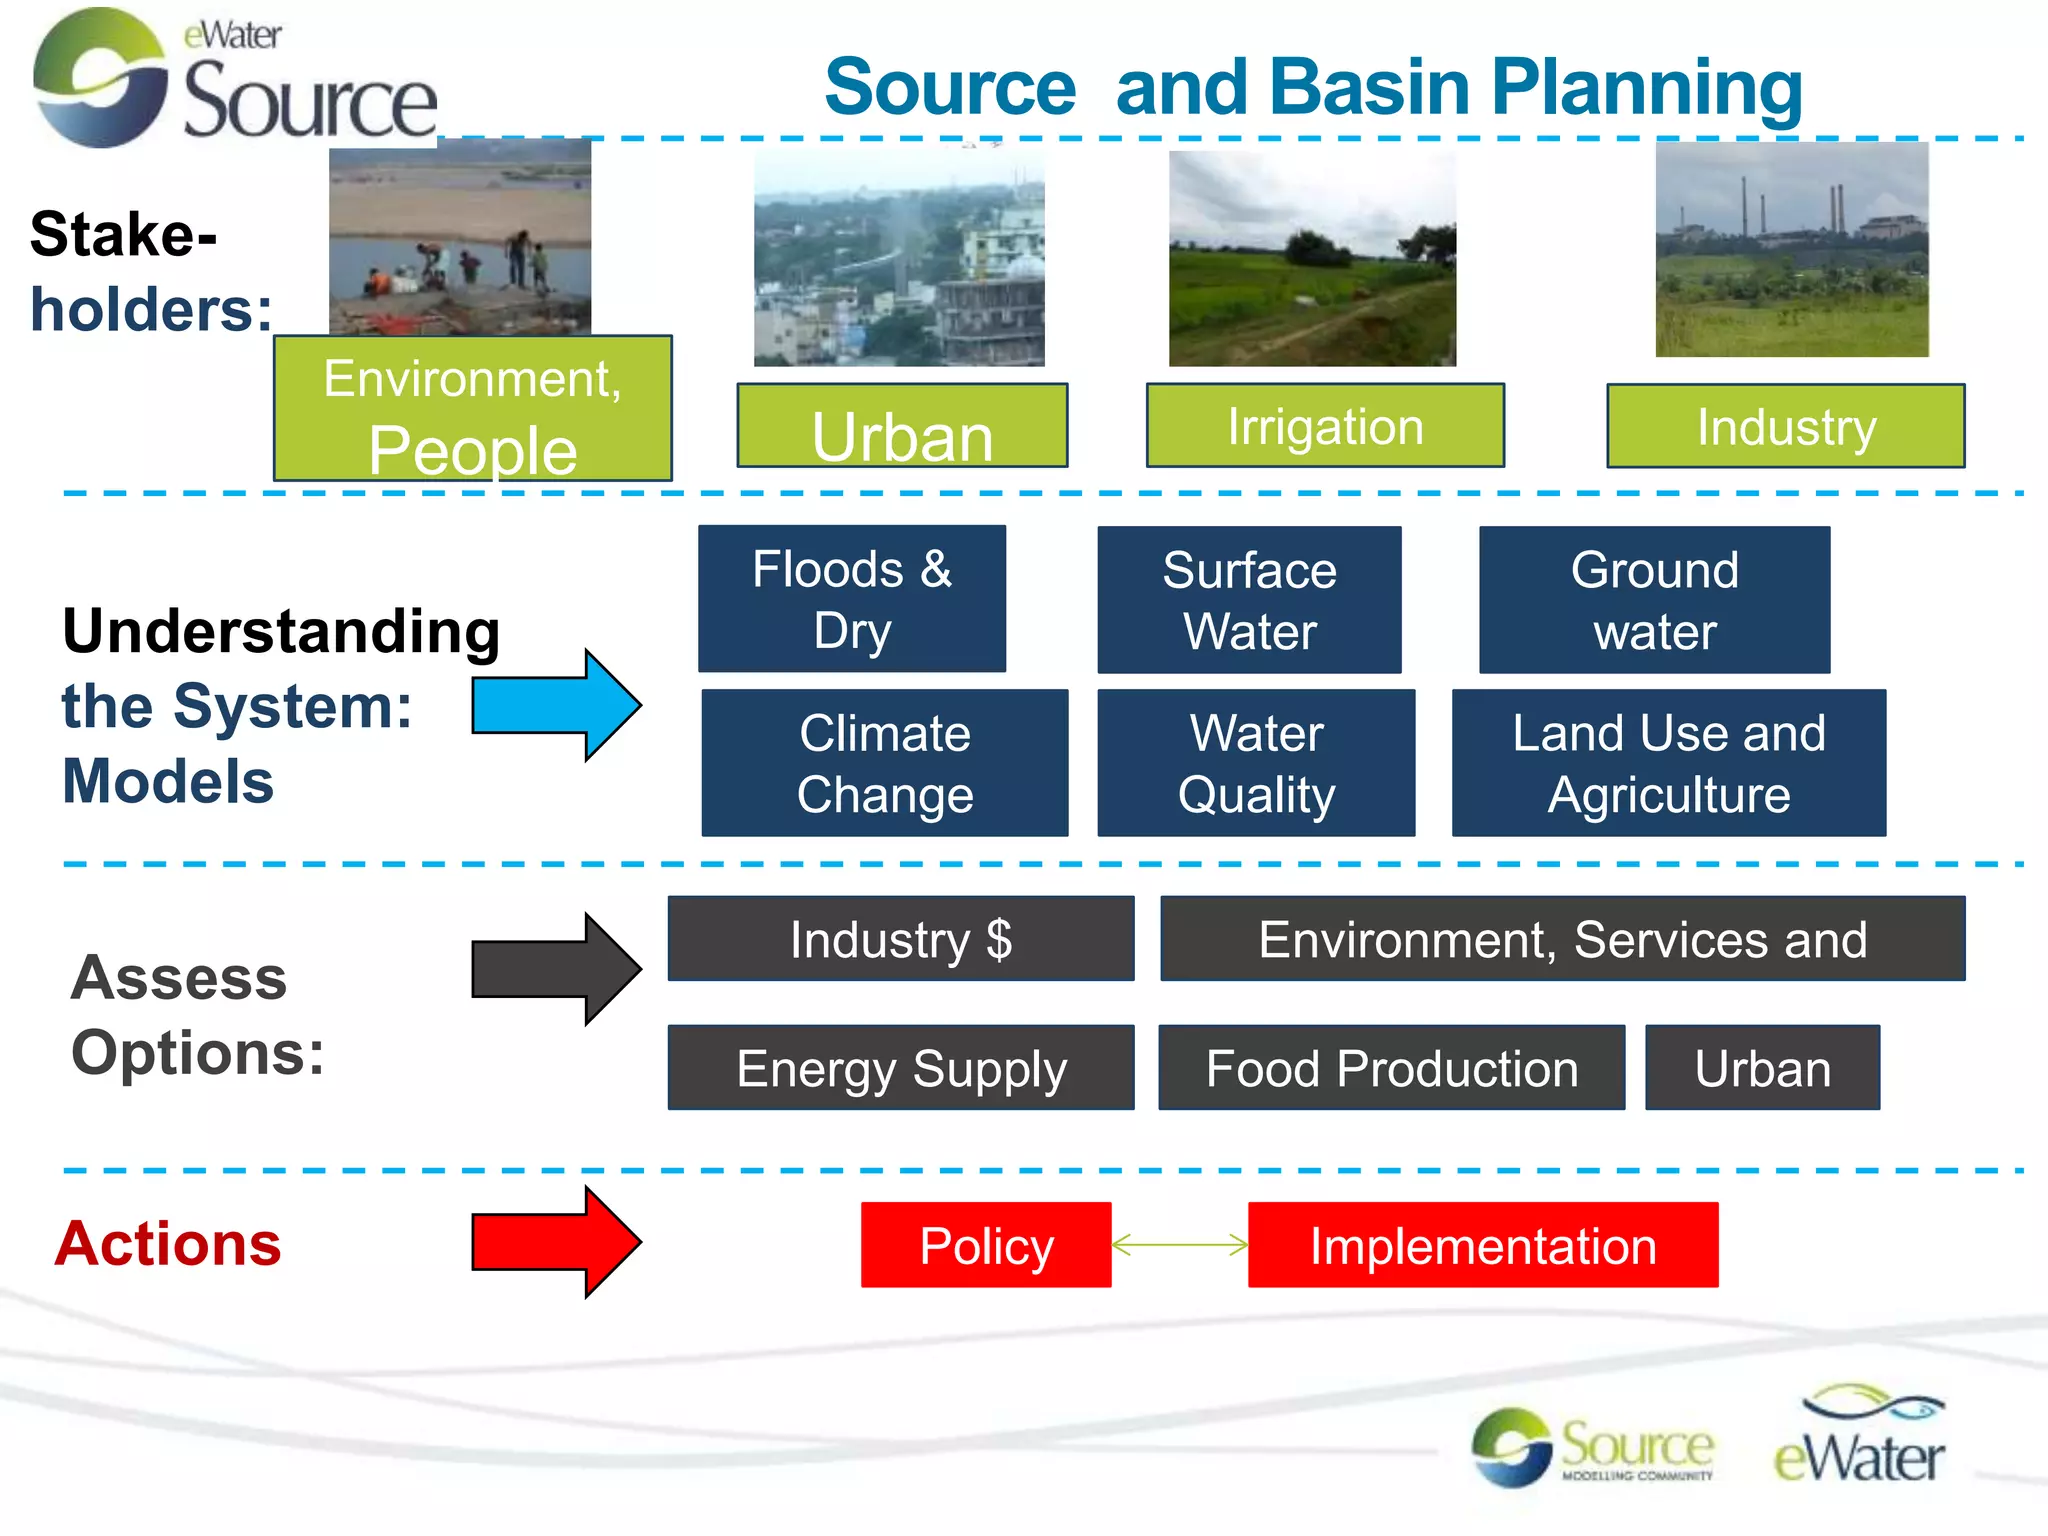
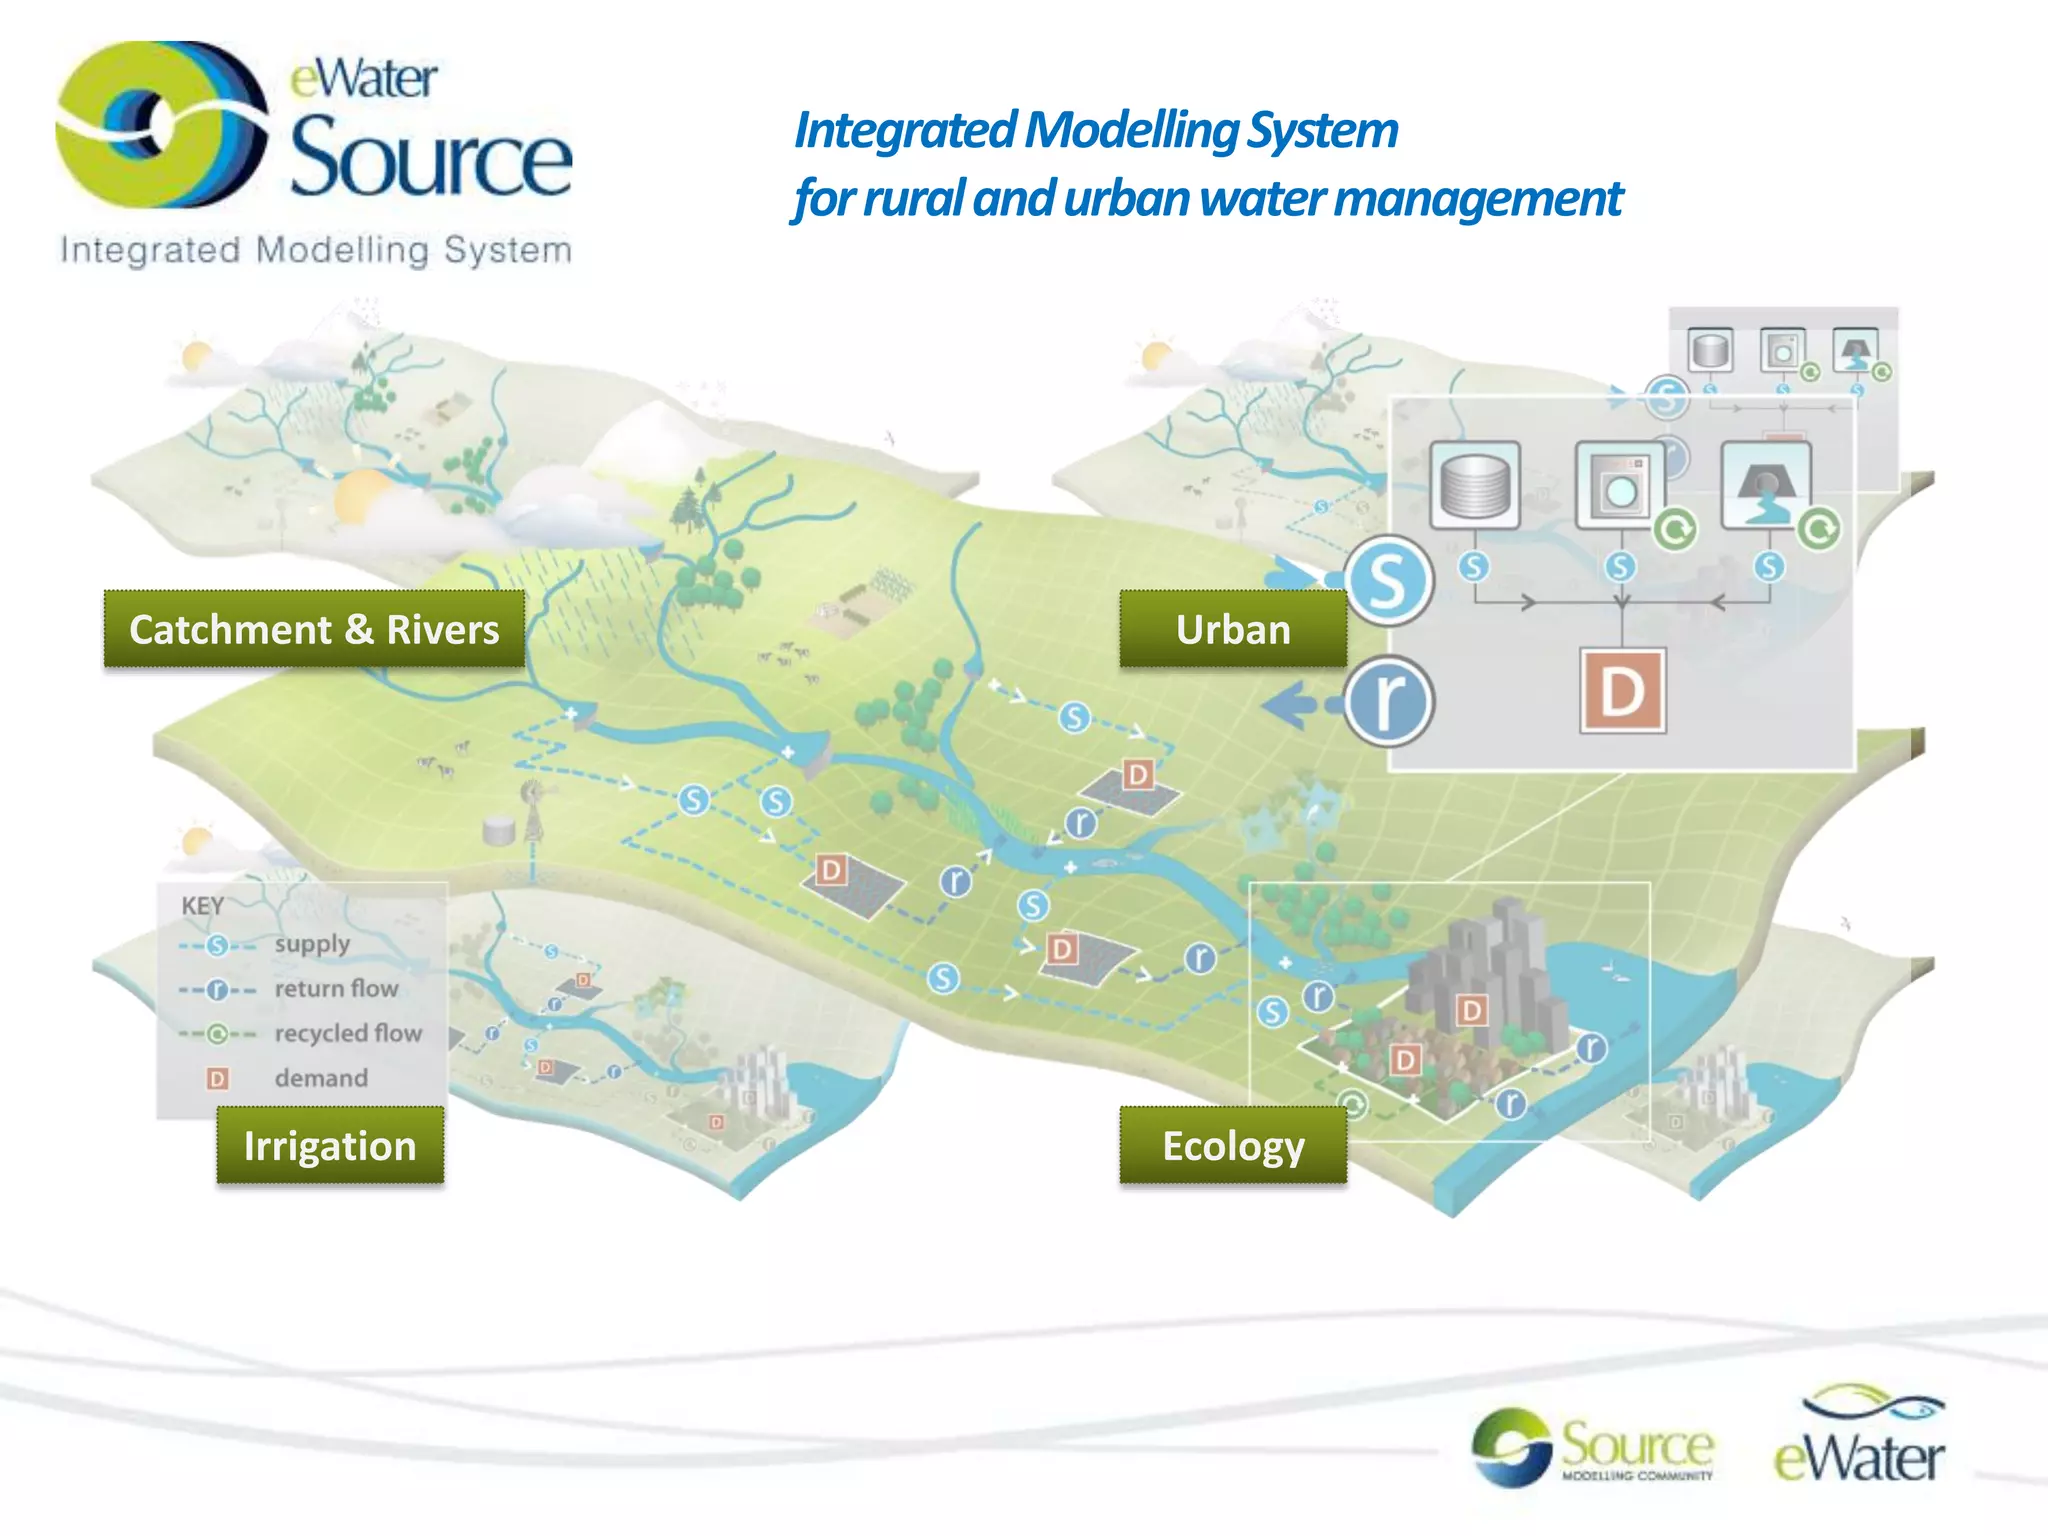
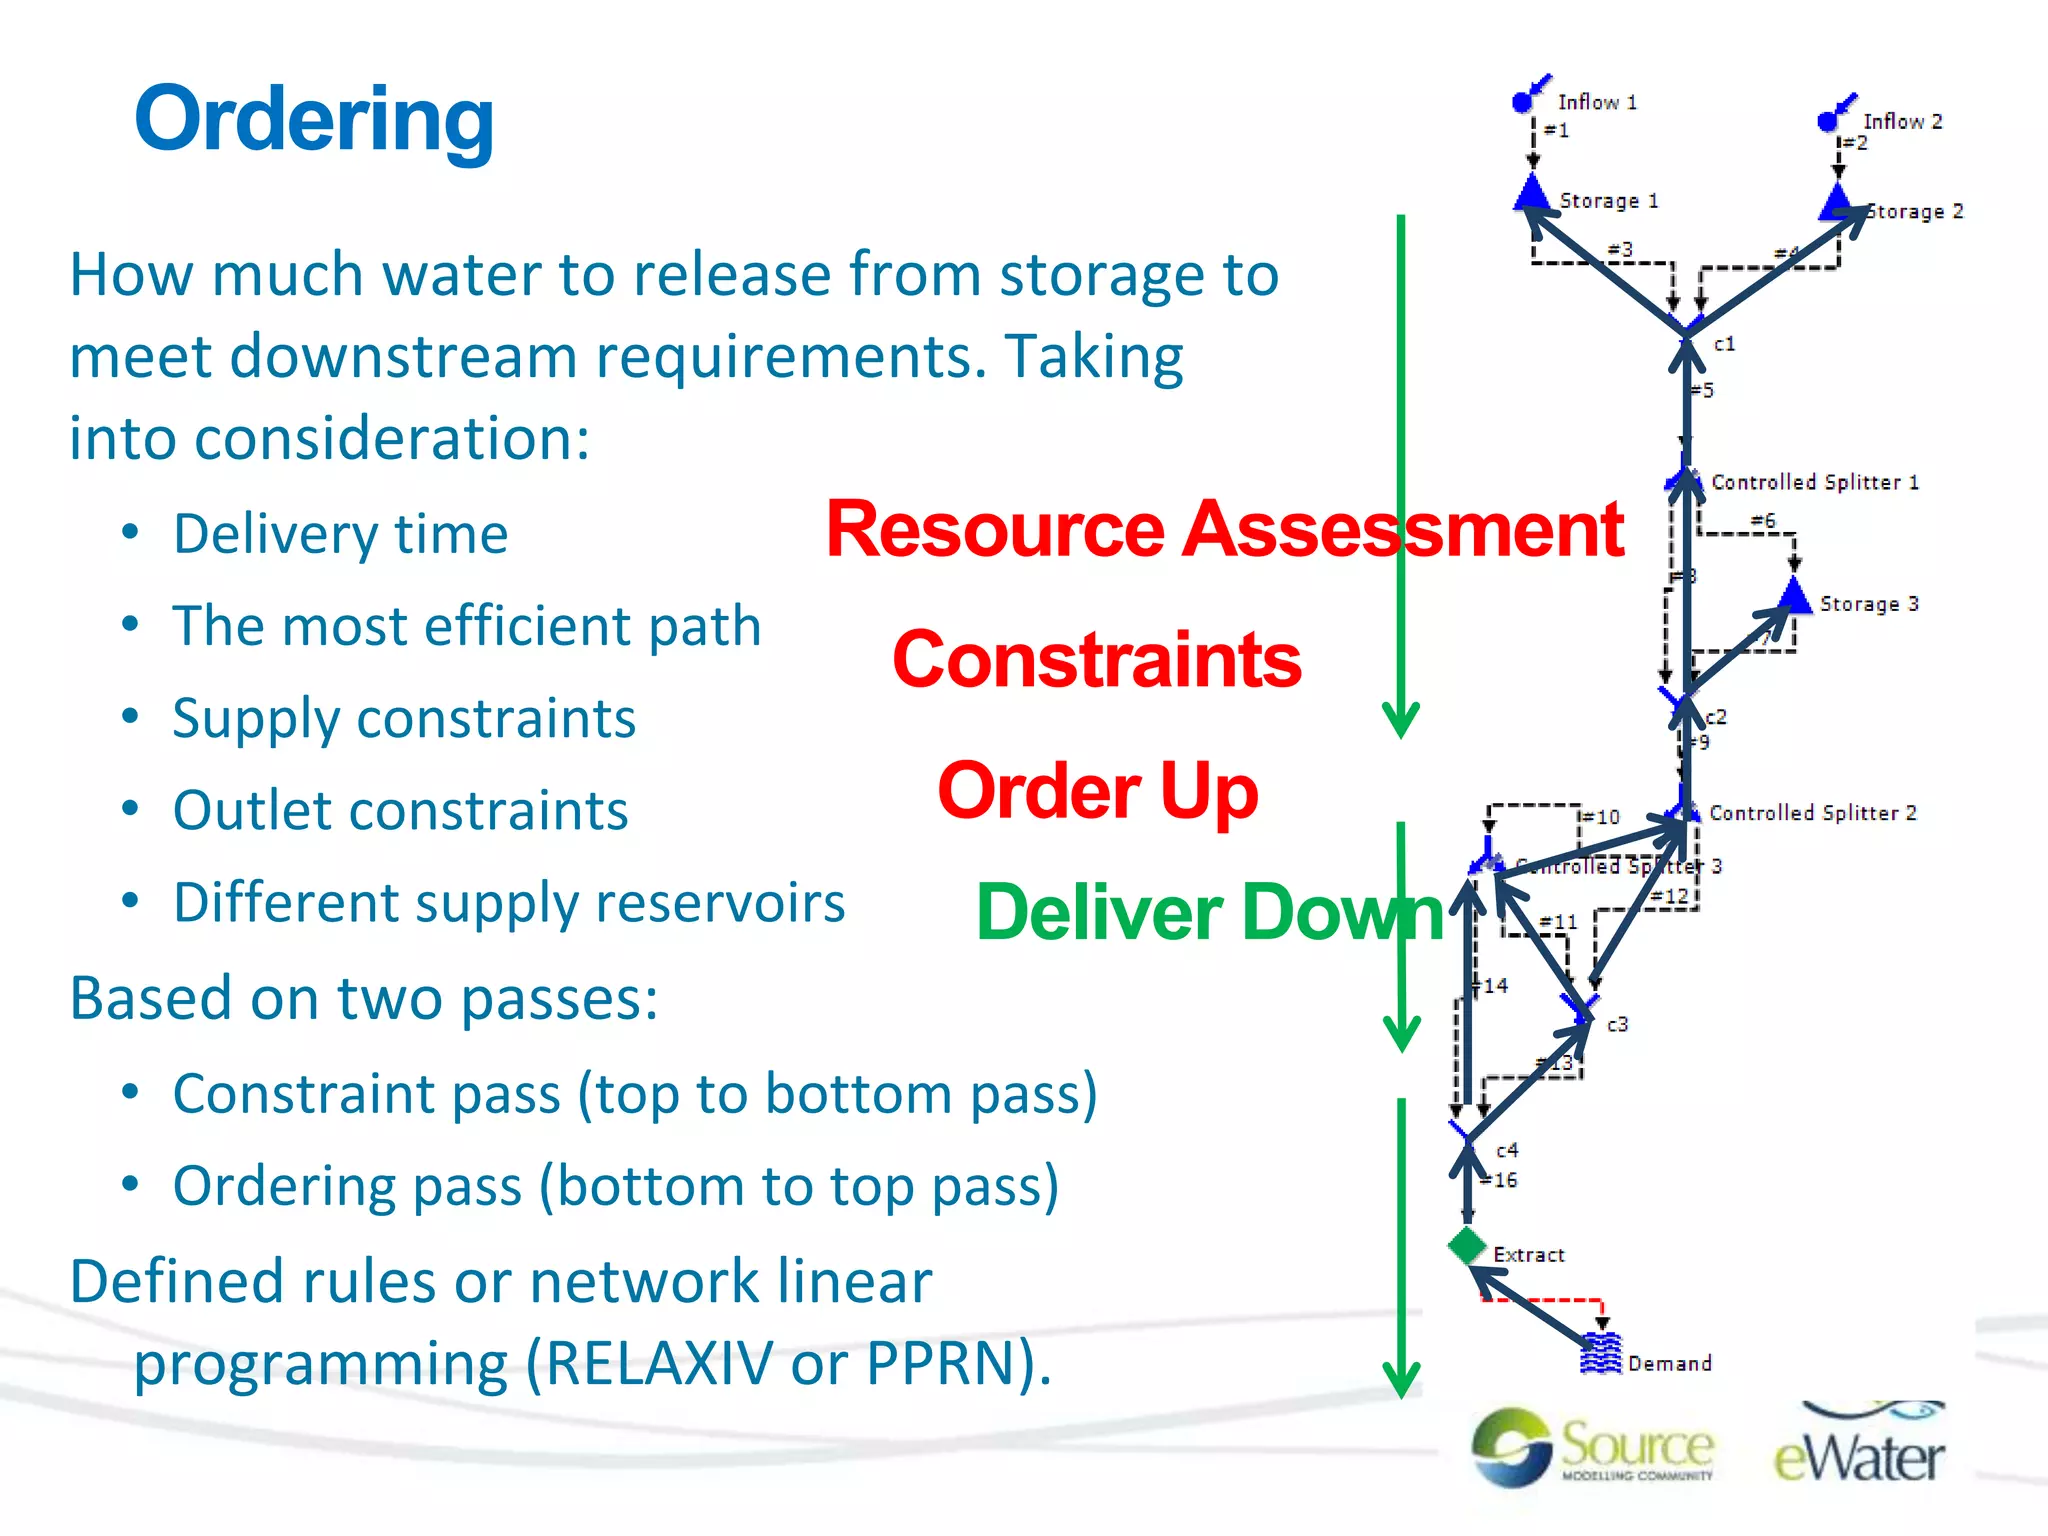
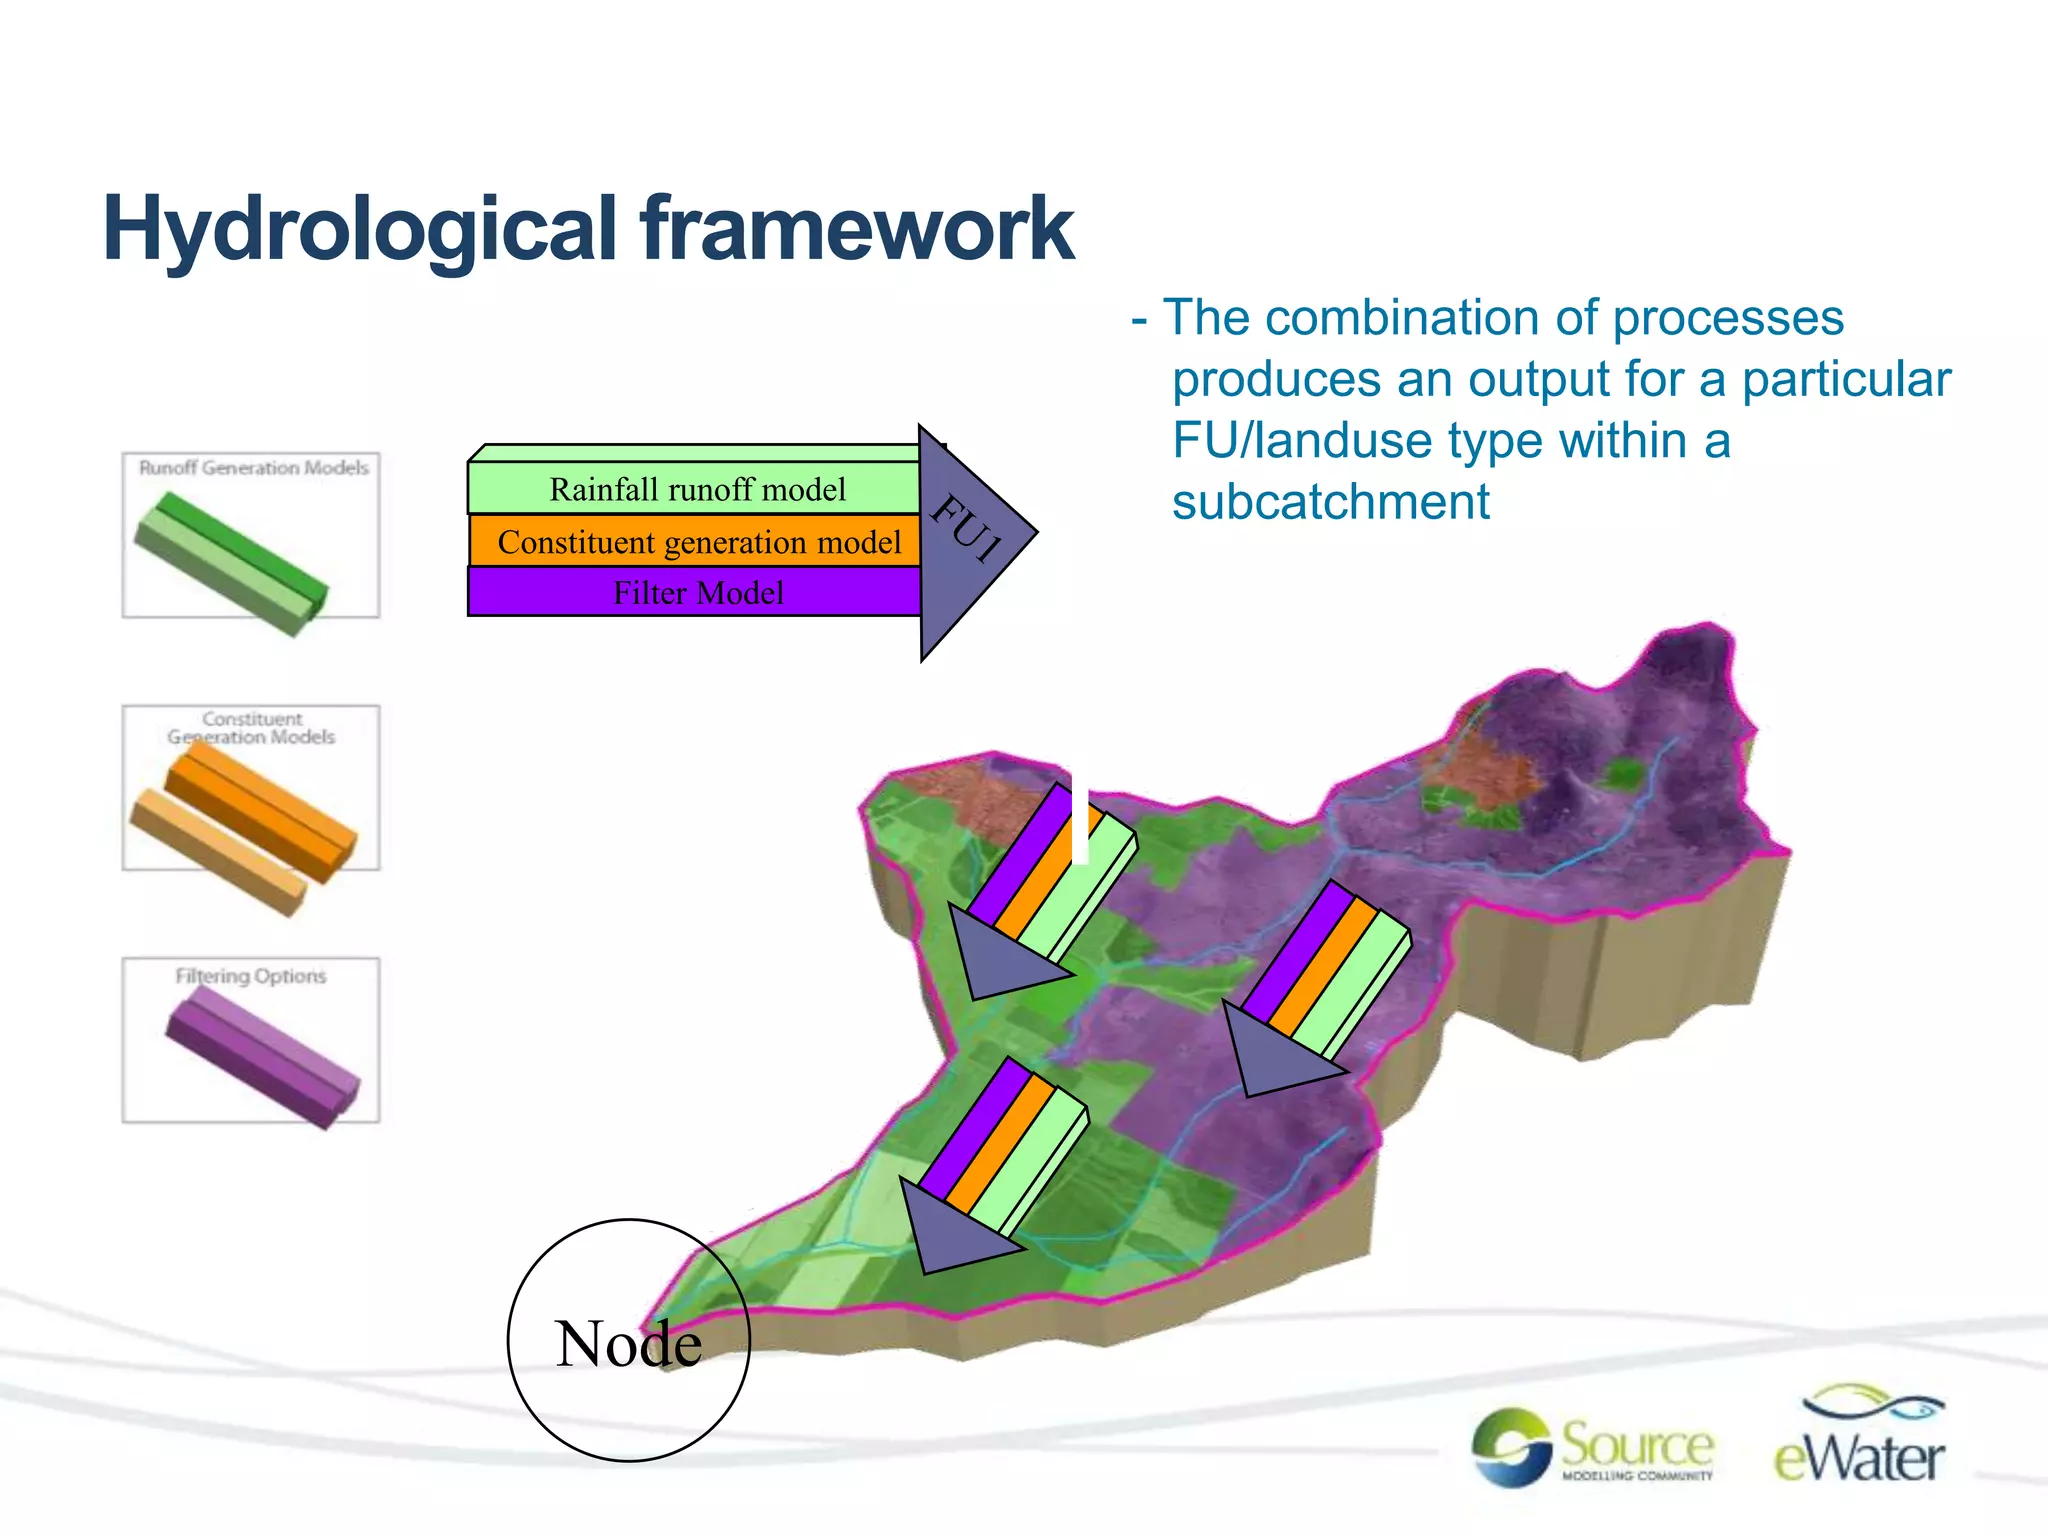
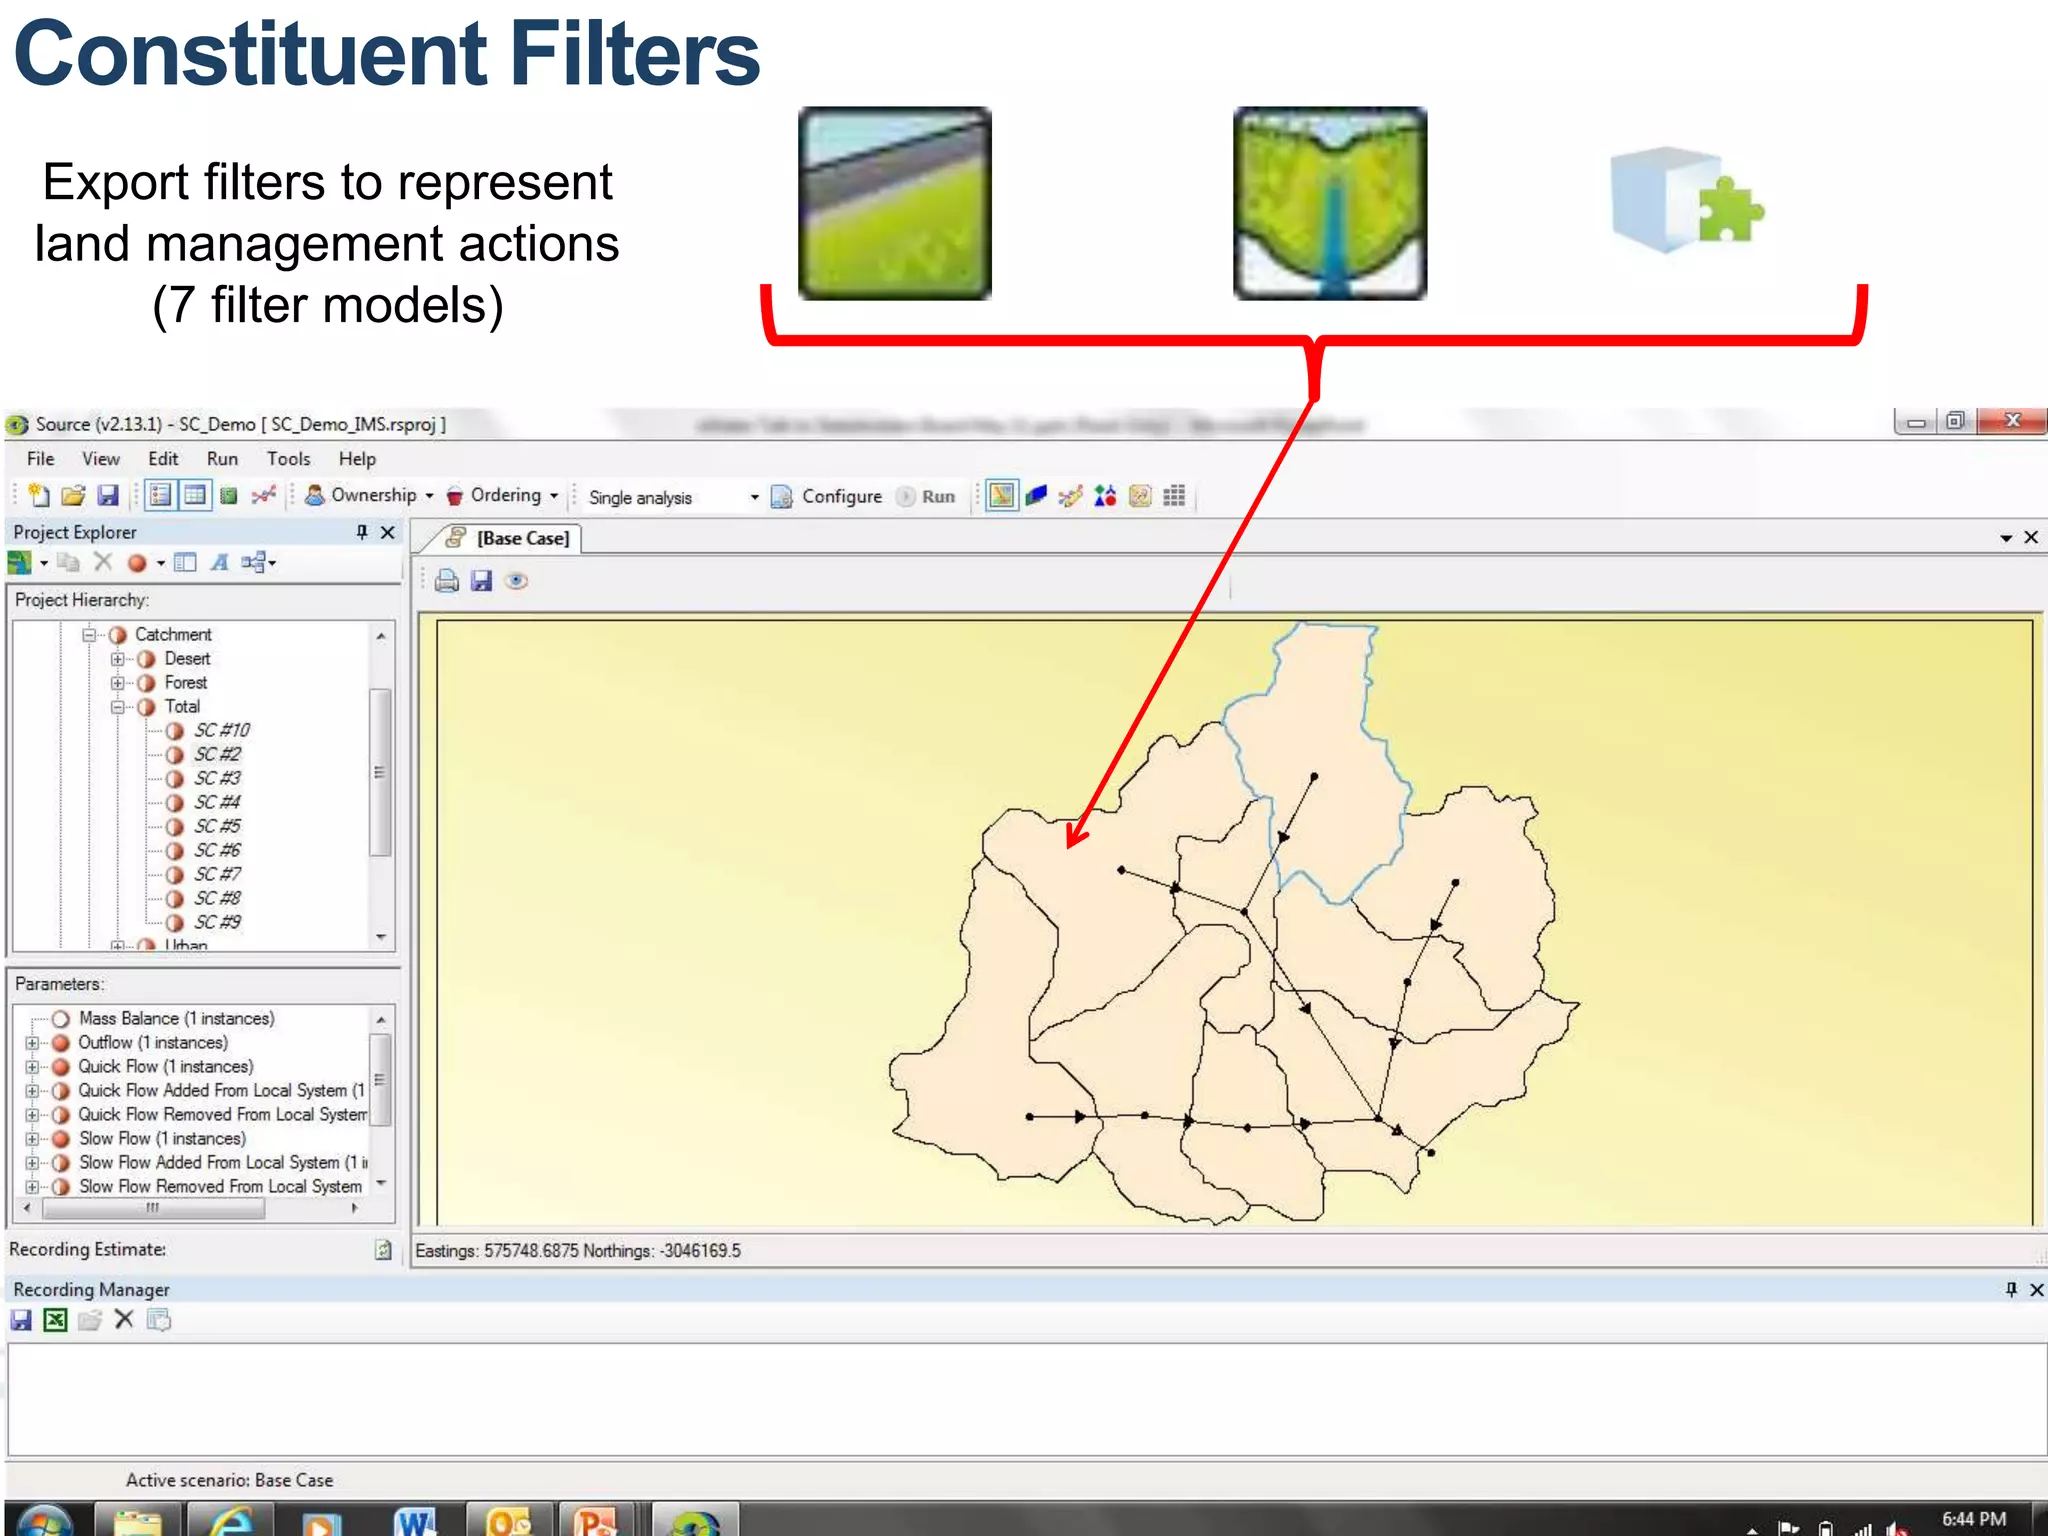
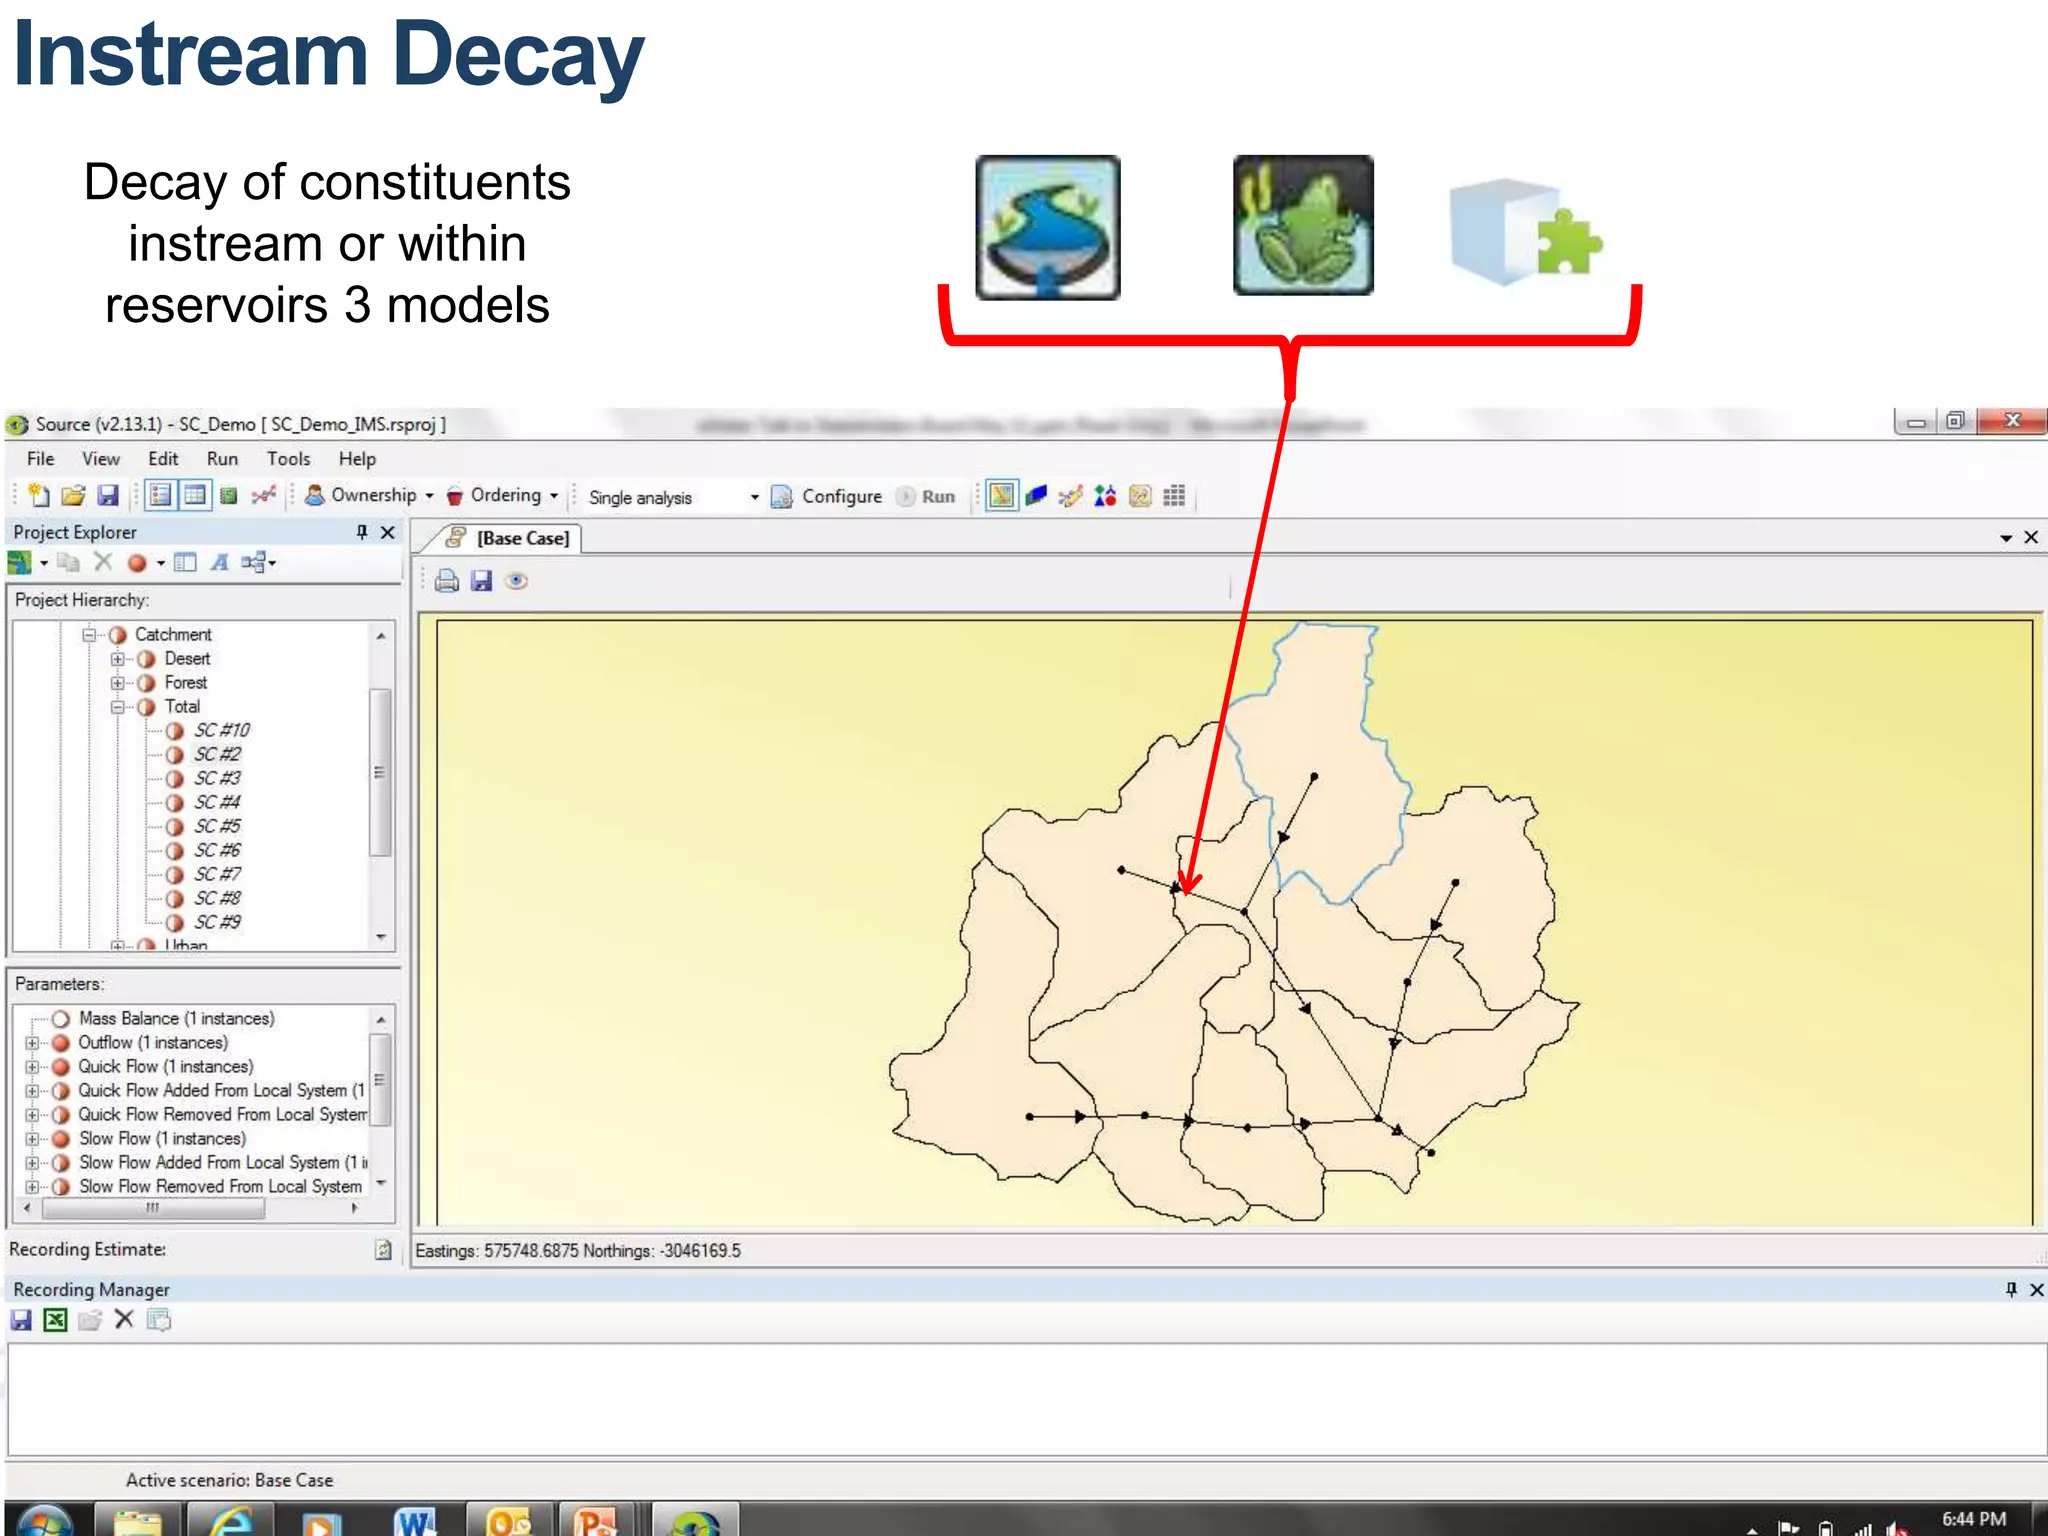
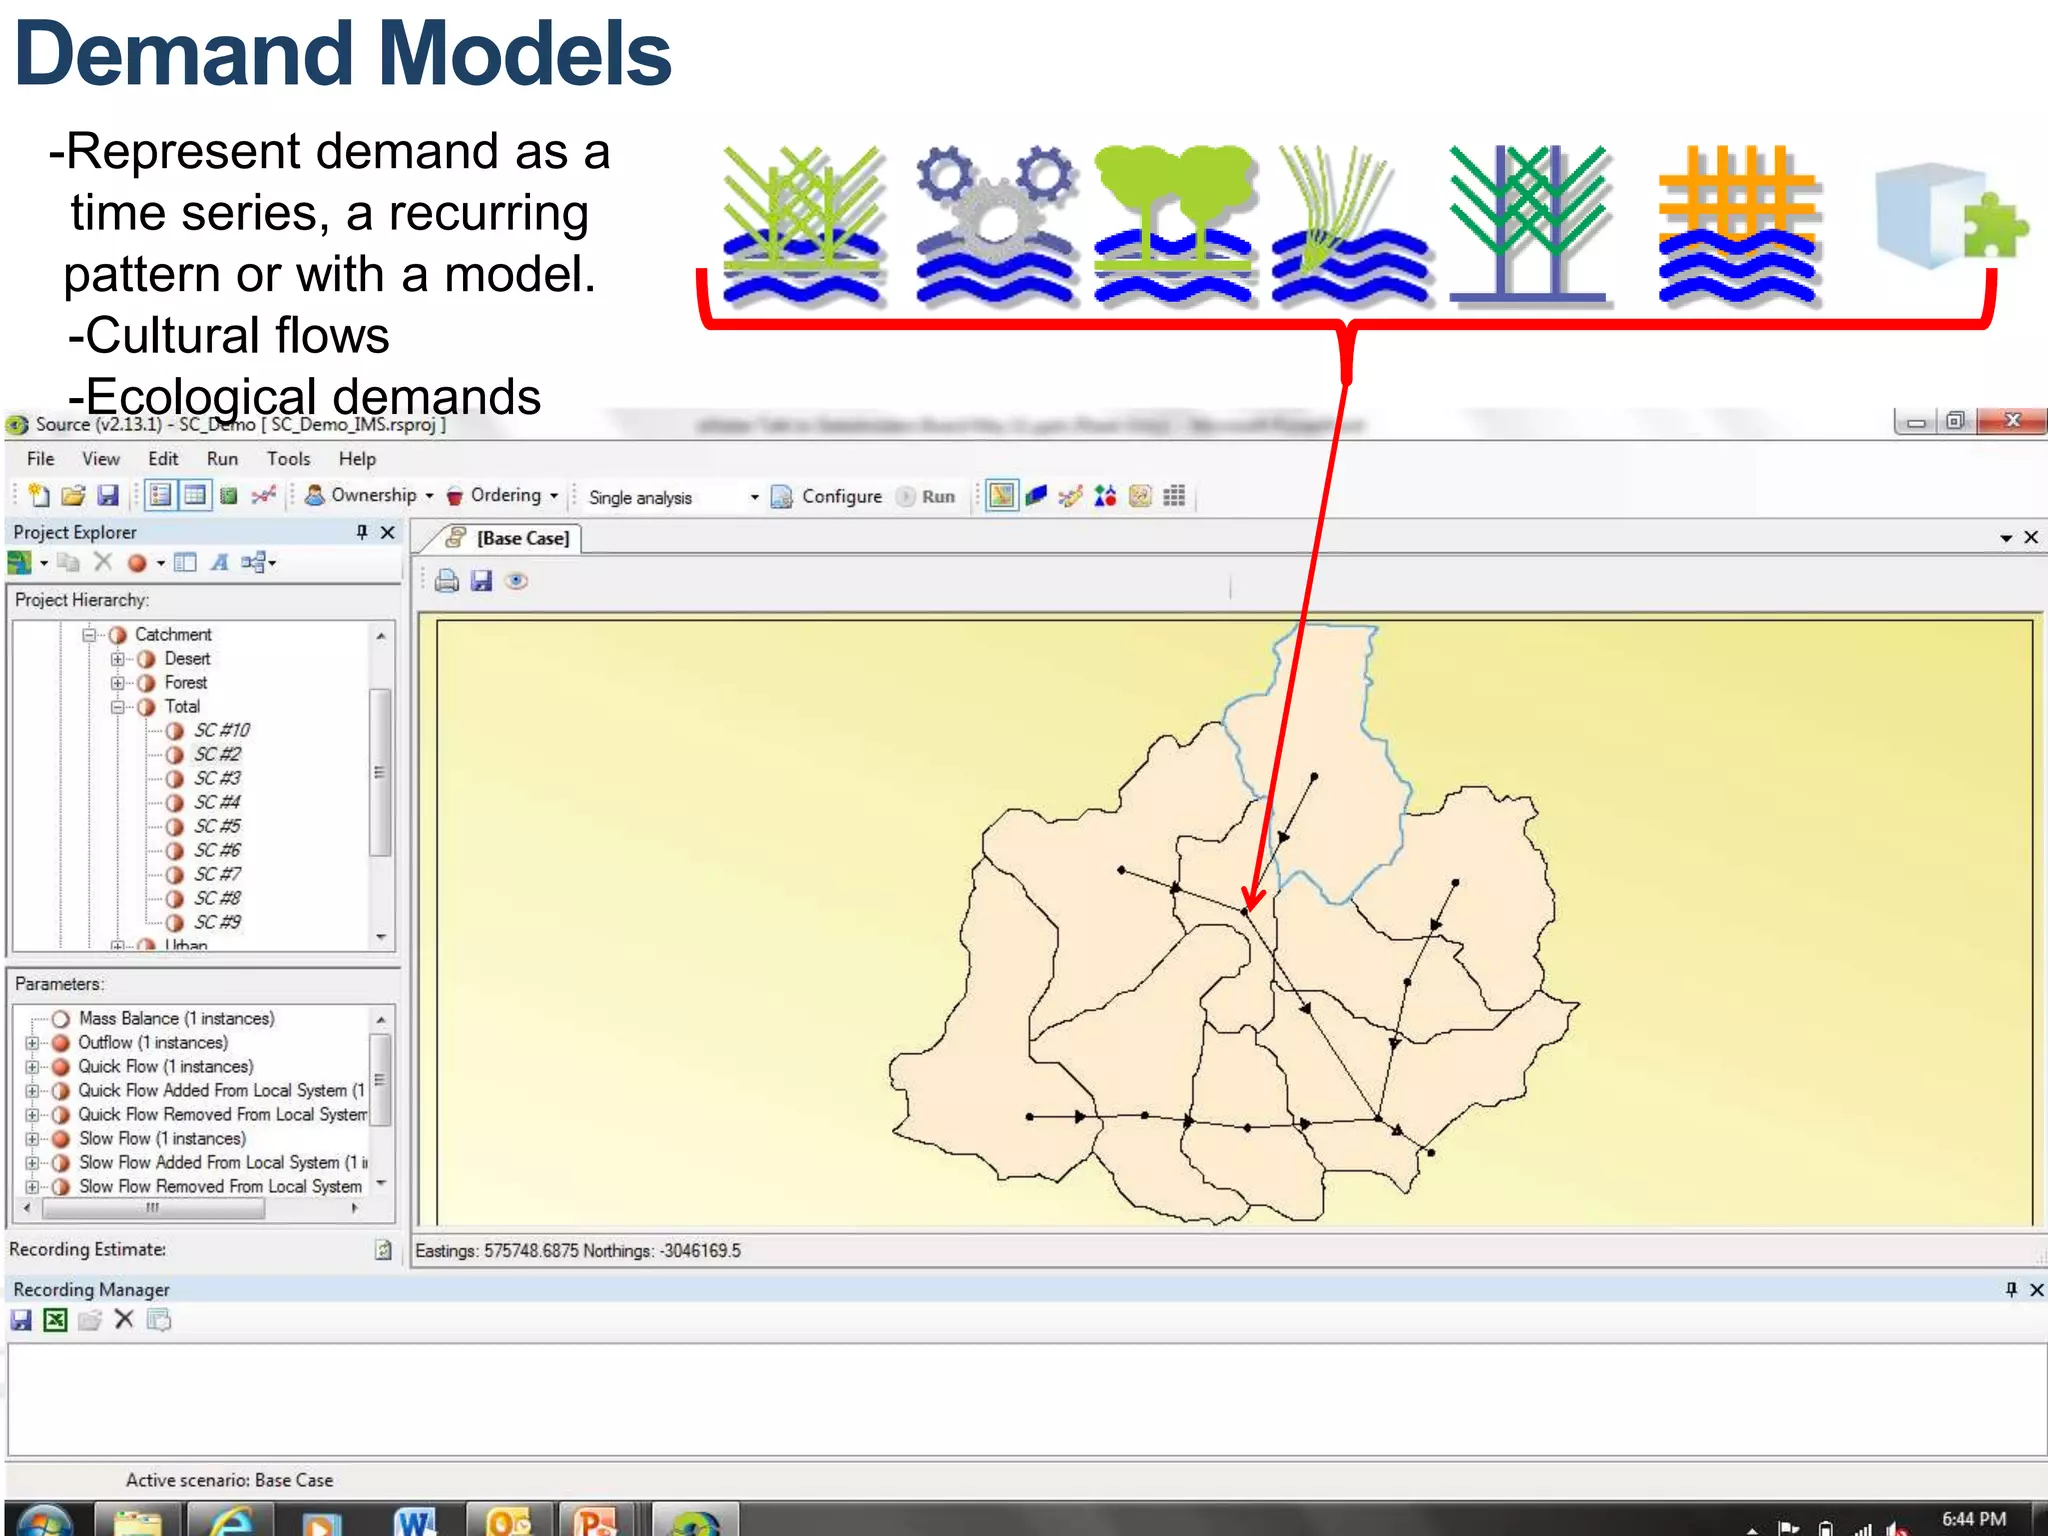
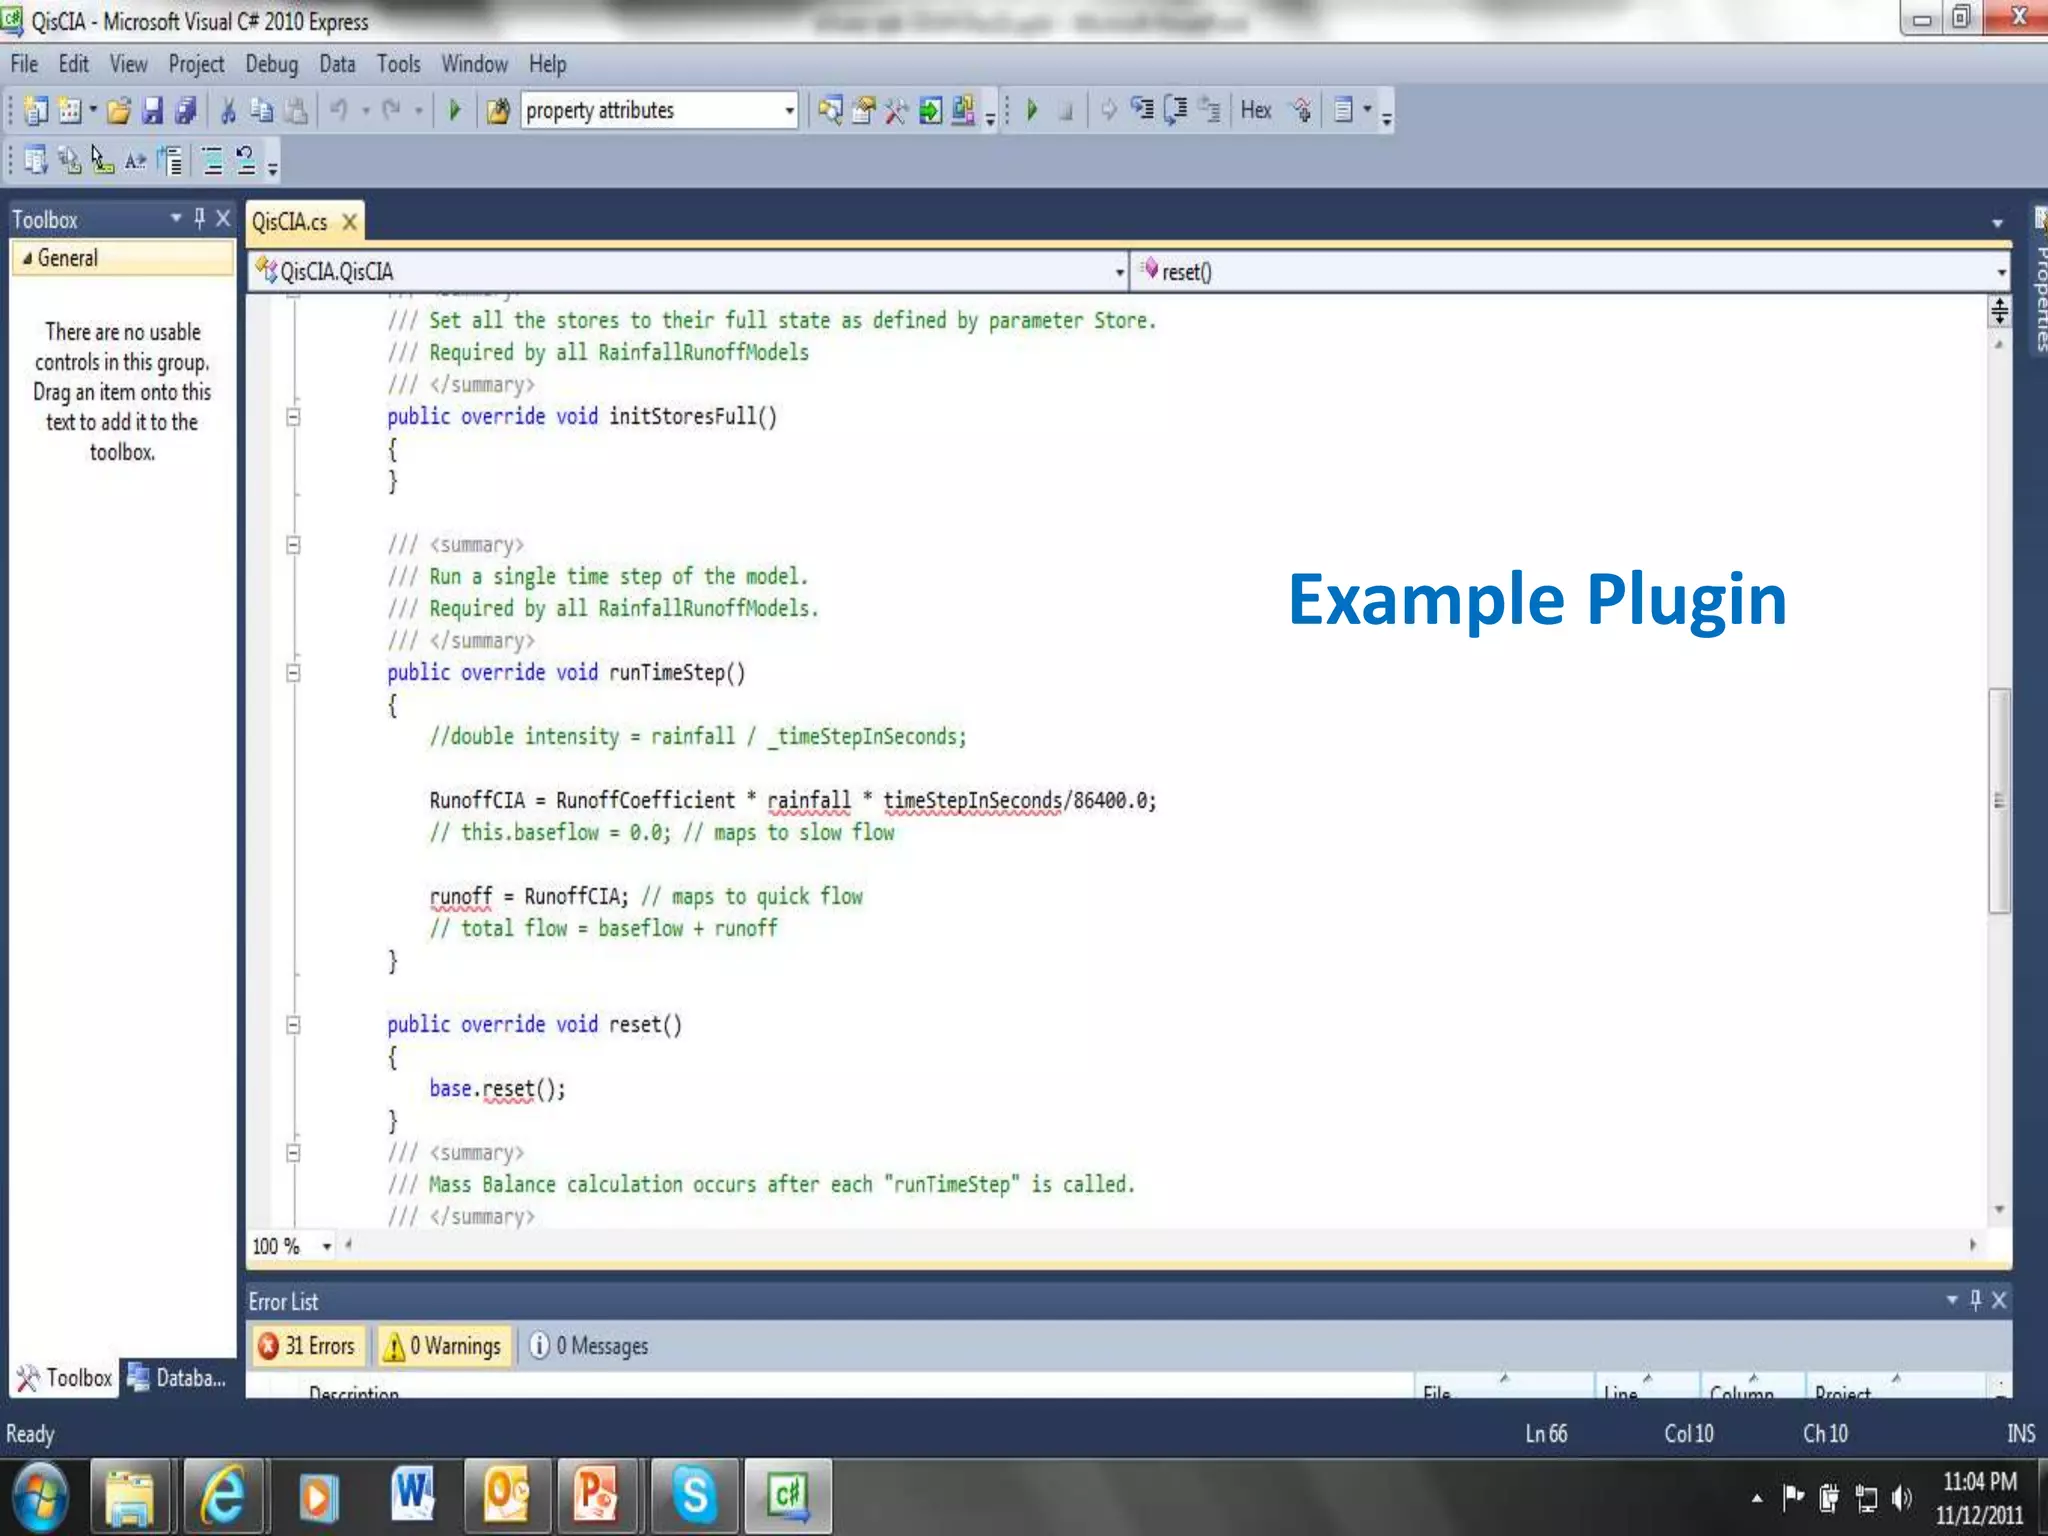
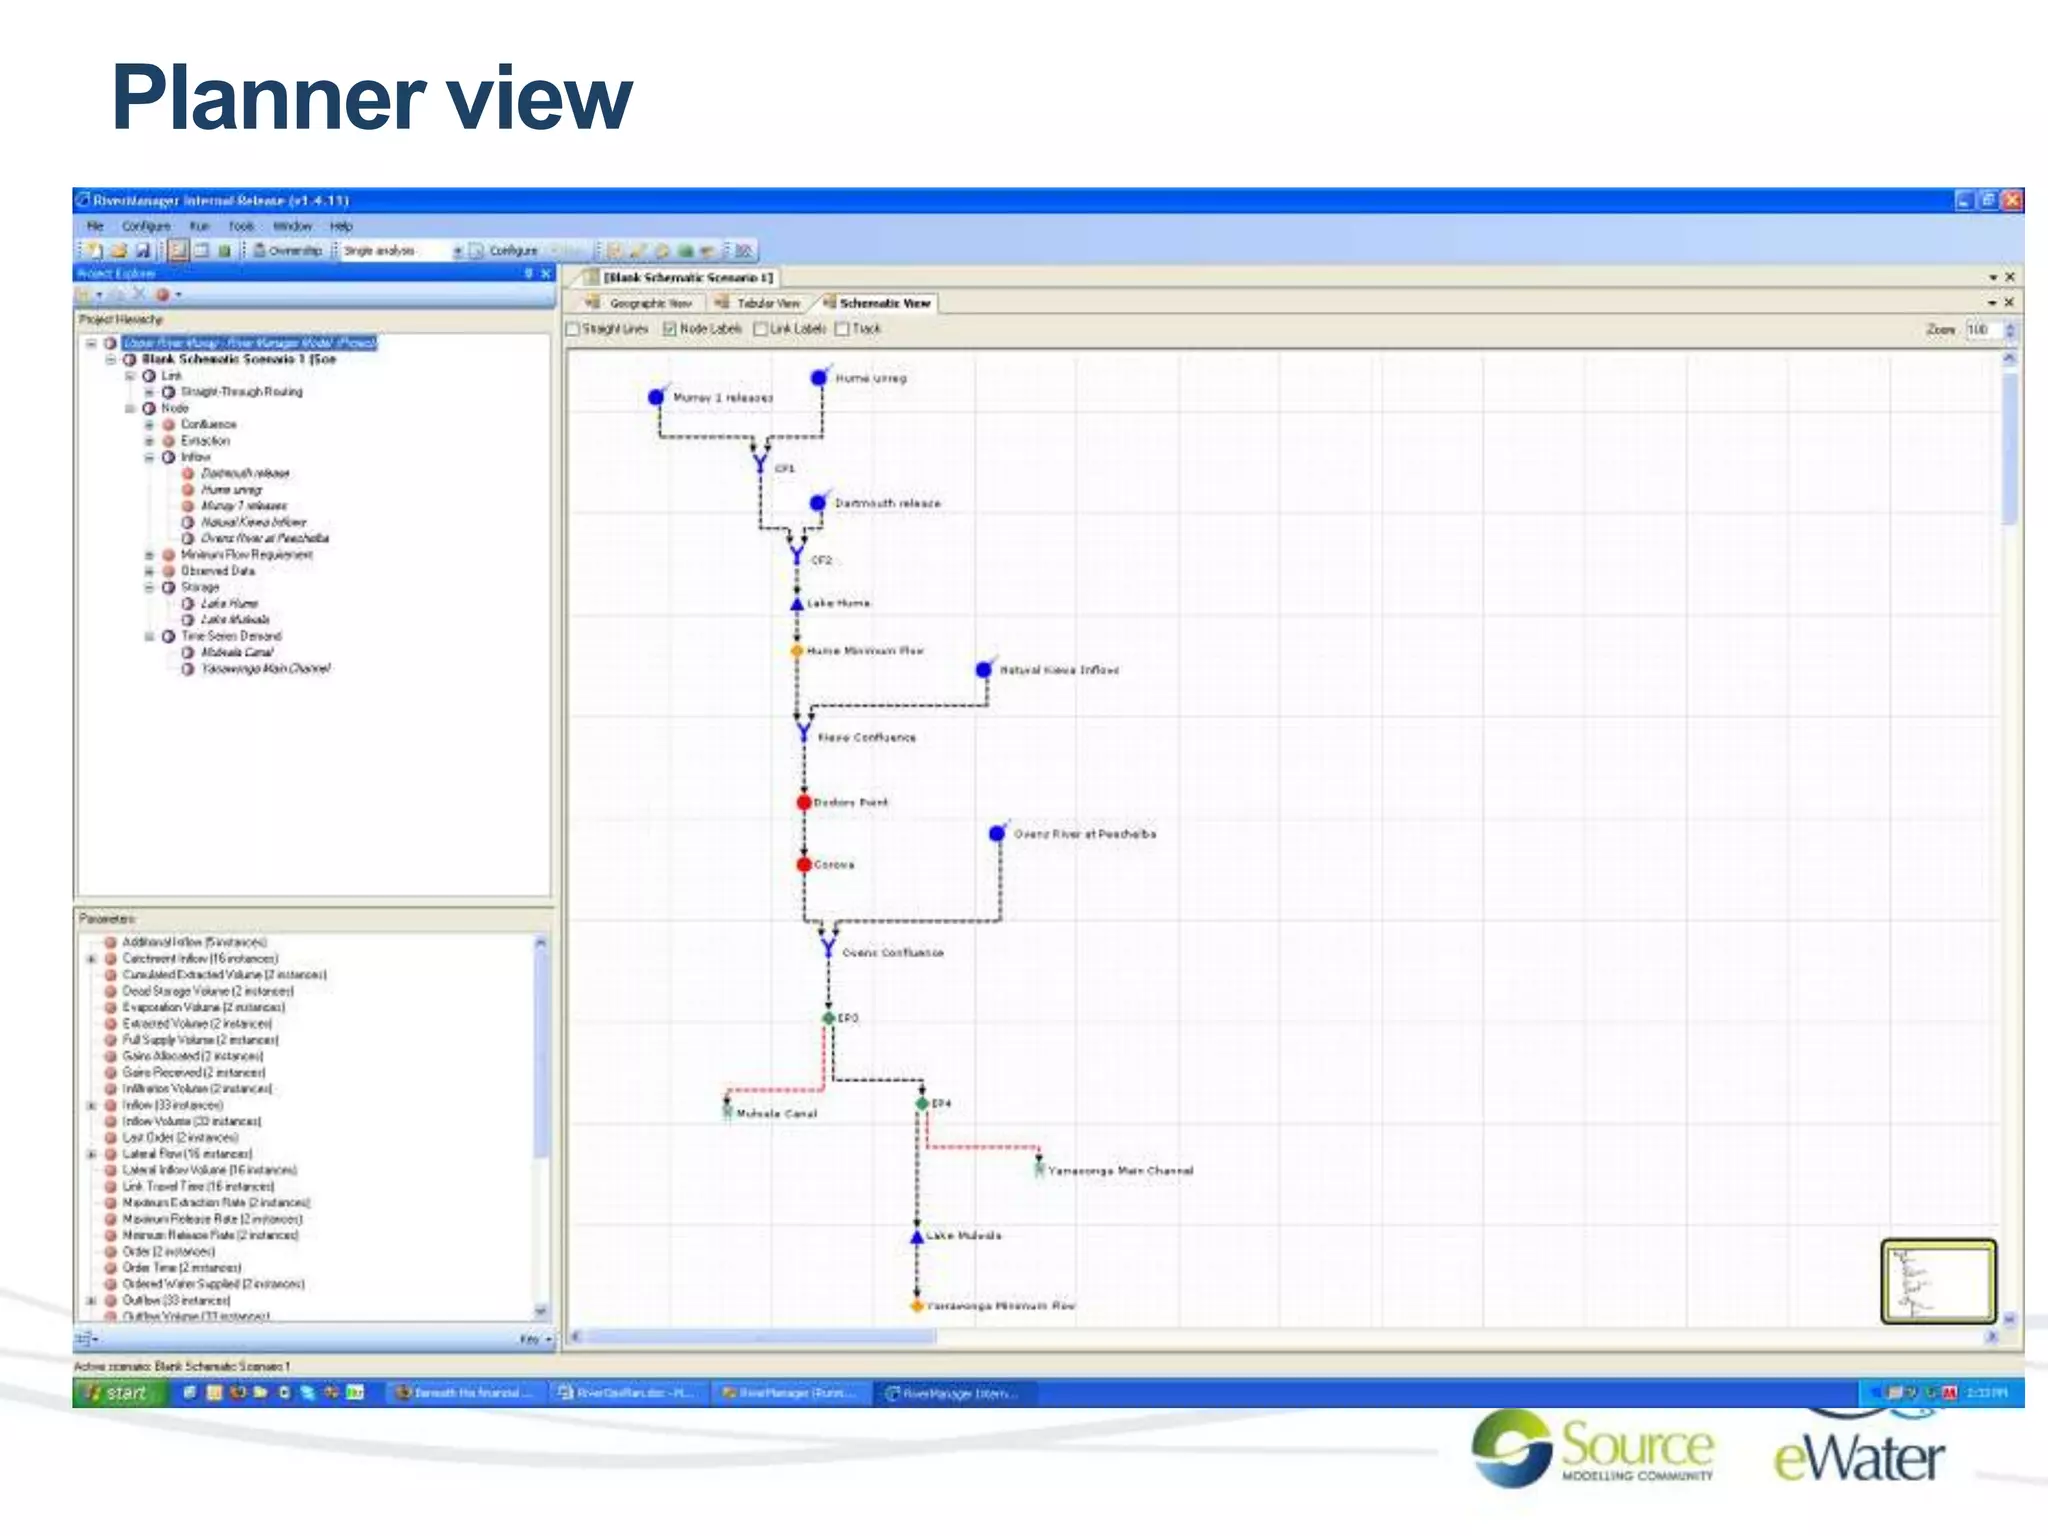
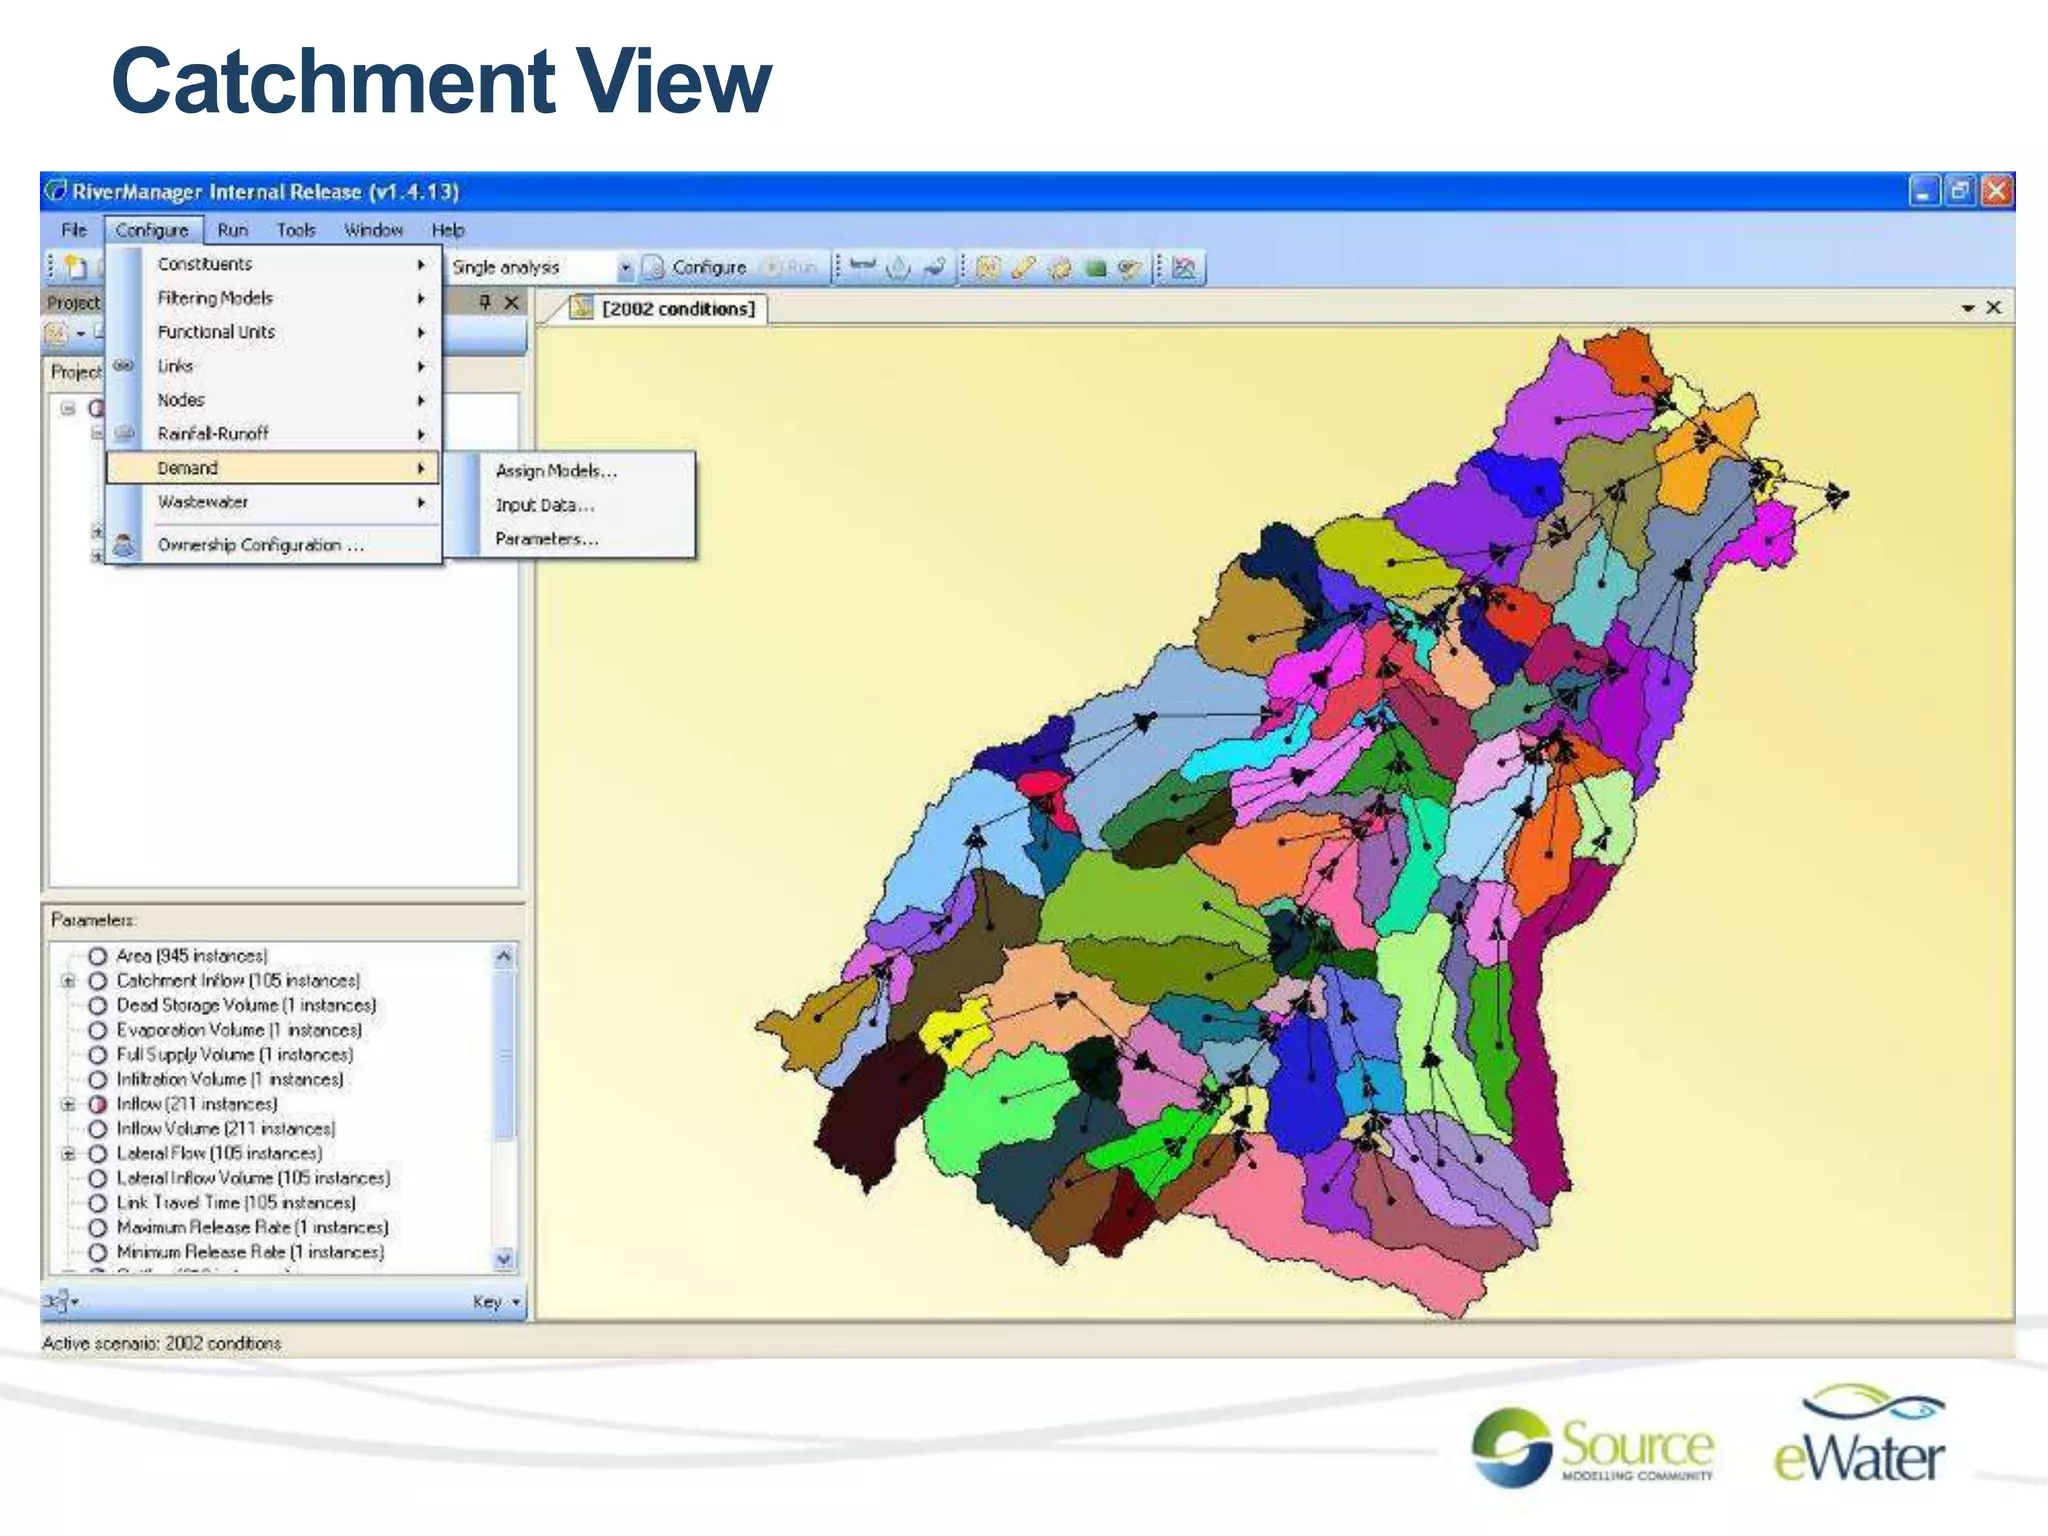
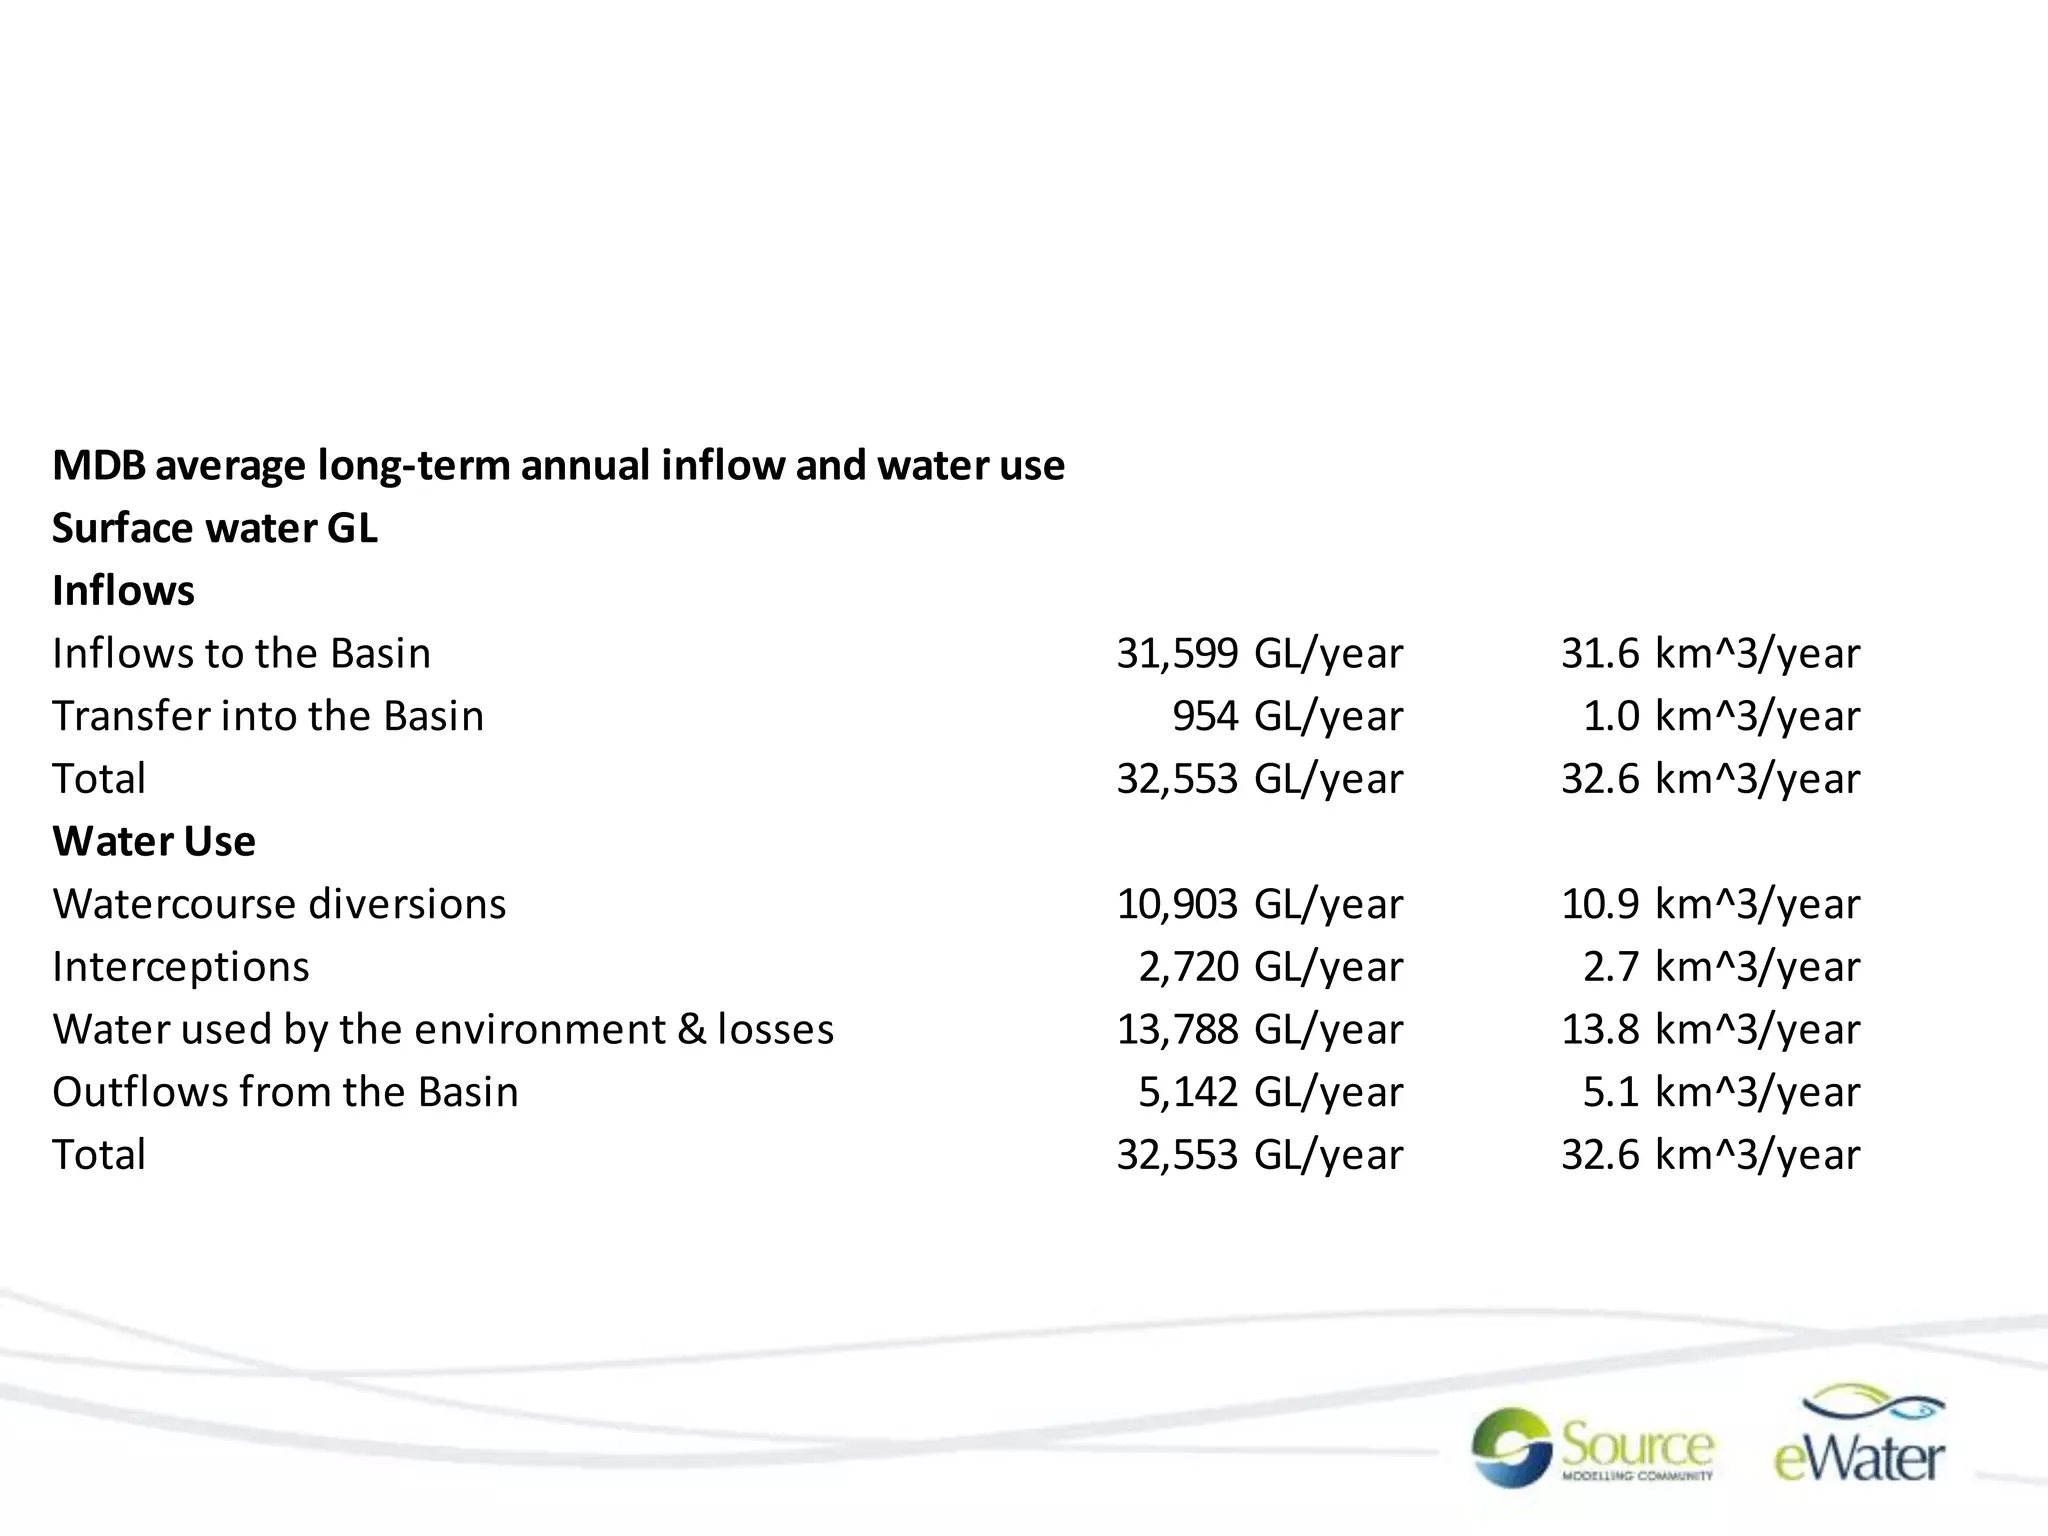
1. eWater Source
At the Workshop on Modern Tools and Techniques for
Water Resources Assessment and Management
16-17 September 2014, Imperial Hotel, New Delhi
geoff.adams@ewater.com.au www.toolkit.ewater.com.au
2. The Source IWRM Platform
‘Catchment to Estuary’ water system modelling capability
Runoff and constituent generation
Transport through regulated and unregulated systems
Urban and rural systems, including newer urban infrastructure
options, crop demand and production models
Ecological function (environmental watering demands,
response models)
Link with other models and systems, optimisation, the cloud
Resource management, ownership, water markets
Groundwater interaction
3. Models are used in developing and
monitoring water management policy
“We don’t do policy change without modeling it first
…”
4. eWater Ltd – our Current Owners
Department of Sustainability and Environment
Department of Environment and
Resource Management
5. Evolution of eWater
Hydrological Tools & Methods
13 Years, 14 Partners, $50M
River Ecology & Science
12 Years, 13 Partners, $50M
COAG Reform
Water Trading
Introduced
Frameworks to manage human
and ecological use of water
6 years, 45 Partners, $160M
National
Water
Initiative
Creation
of CEWH
Environmental
Water
Principles
1992 1994 2004 2007
2012
2007 Water Act
Empowers
MDBA
Best Available
Science Legally
Testable
eWater Source
National
Hydrological
Modeling Platform
1996
6. eWater CRC - 34 Industry & 11 Research
Partners
PUBLIC INDUSTRY CORPORATE INDUSTRY RESEARCH
Department of Sustainability and Environment
Department of Primary Industries
Environmental Protection Agency (EPA)
Victorian Catchment Management Authorities
Department of Environment and Resource Management Queensland
Primary Industries and Fisheries – Department of Employment, Economic
Development and Innovation
7. Source and Basin Planning
Environment,
People Urban Irrigation
Floods &
Dry
Water
Quality
Land Use and
Agriculture
Industry $ Environment, Services and
People
Climate
Change
Ground
water
Surface
Understanding Water
the System:
Models
Assess
Options:
Actions Policy
Implementation
Industry
Energy Supply Food Production Urban
Stake-holders:
9. Ordering
How much water to release from storage to
meet downstream requirements. Taking
into consideration:
• Delivery time
• The most efficient path
• Supply constraints
• Outlet constraints
• Different supply reservoirs
Based on two passes:
• Constraint pass (top to bottom pass)
• Ordering pass (bottom to top pass)
Defined rules or network linear
programming (RELAXIV or PPRN).
Resource Assessment
Constraints
Order Up
Deliver Down
10. Hydrological framework
Rainfall runoff model
Constituent generation model
Node
- The combination of processes
produces an output for a particular
FU/landuse type within a
subcatchment
Filter Model
17. Demand Models
-Represent demand as a
time series, a recurring
pattern or with a model.
-Cultural flows
-Ecological demands
18. Options for Customising Source
1. Functions
Powerful math and logic language built into Source (MS
Excel-style formulae)
2. Custom Functions
User defined extensions to the Function Manager
3. Plugins!
Open ended system for changing the algorithms, user
interface or operation of Source
…
19. Options for Customising Source cont.
4. External Scripting
Batch runs, calibration, uncertainty analysis, links to other
systems – models, FEWS
5. Optimisation
Multi-objective optimisation, trade-off analysis
6. Run-time Configuration Changes
Scenario analysis
20. Functions
Ability to calculate mathematical expressions within Source
using system variables
Has similar syntax to Excel
Large set of common used functions (trigonomic,
statistical, logical)
Piecewise Linear, Patterns and Time of Evaluation
Custom Functions
Extend the language of the expression editor
Reuse common logic
Written in C# and loaded as a plugin
22. Plugins
•Replacement component models (demand, runoff, routing,
etc)
•Provide a tailored user interface
•Automate repetitive tasks, such as data pre processing,
output report generation
•Written in a .NET language such as C# or Visual Basic
•Basic development tool set free of charge from Microsoft
28. We can model water access rules in different ways
Option 1 – do nothing
Option 2 – use functions to constrain supply
Option 3. Apply allocation system
Use the ‘resource assessment’ functionality to allocate available
resources to different users e.g. on a seasonal basis
29. Ways for modelling different water access rules
Option 4. Ownership.
Use the ‘ownership’ functionality to ‘lock in’ a users access to a
particular quantity or share of water
31. Impacts of groundwater pumping on rivers
Processes:
• Pumping from Unconfined Aquifer
• Pumping from Semi-Confined Aquifer
• Irrigation Recharge
• Diffuse Recharge
From: Evans R. (2007). The impact of groundwater use on Australia’s rivers ~ Exploring the
technical, management and policy challenges. Land and Water Australia, Canberra.
32. Groundwater Link Model versus MODFLOW
24/8/92 12/3/93 28/9/93 16/4/94 2/11/94 21/5/95 7/12/95
+ve = Gaining, -ve = Losing
-60
-50
-40
-30
-20
-10
0
10
20
30
40
Date
SW/GW exchange flux (ML/day)
Modflow
Link model
33. The Source IWRM Platform
• The freely available ‘Public Release’ is a fully featured
IWRM platform
• 330 downloads from 42 countries
• Pricing for the full featured release, which also covers water
markets, resource assessment etc. is targeted at
commercial use
• Under the Government to Government Agreement we can
customise Source to the Indian context
• The Australian Central and State governments are
committed to Source. Source is being used for statutory
WRM in Australia.
34. The Source IWRM Platform
• Quality software engineering
• Extensive unit tests
• Hundreds of regression tests to ensure stability
• User models are added to the regression test suite for assurance
• Readily customisable for specific users – e.g.
• Glacier, snowmelt
• Resource assessment
• Small catchment dams
• GIS
36. Irrigation Demand
Crop interception loss Fallow interception loss
Area of primary/secondary crops
Effective rainfall
Crop 1
Crop 2 Crop 3
Fallow
Soil moisture depth
Maximum irrigable area
Upper fallow depth
Irrigation
return Water
User
Infiltration to lower fallow
Lower fallow depth
Seepage
Maximum pond depth
Soil moisture target
Crop tolerance
Minimum pond depth
Rainfal
l
Kc(t)*E(t) Kc(t)*E(t)
Available water Escape return
Irrigation
On farm
loss
Irrigation
return loss
Crop
runoff
loss
Total
seepag
e
Fallow
runoff loss
Fallow
runoff
Crop
Runoff
Total
return
FAO Crop Factors
38. MDB average long-term annual inflow and water use
Surface water GL
Inflows
Inflows to the Basin 31,599 GL/year 31.6 km^3/year
Transfer into the Basin 954 GL/year 1.0 km^3/year
Total 32,553 GL/year 32.6 km^3/year
Water Use
Watercourse diversions 10,903 GL/year 10.9 km^3/year
Interceptions 2,720 GL/year 2.7 km^3/year
Water used by the environment & losses 13,788 GL/year 13.8 km^3/year
Outflows from the Basin 5,142 GL/year 5.1 km^3/year
Total 32,553 GL/year 32.6 km^3/year