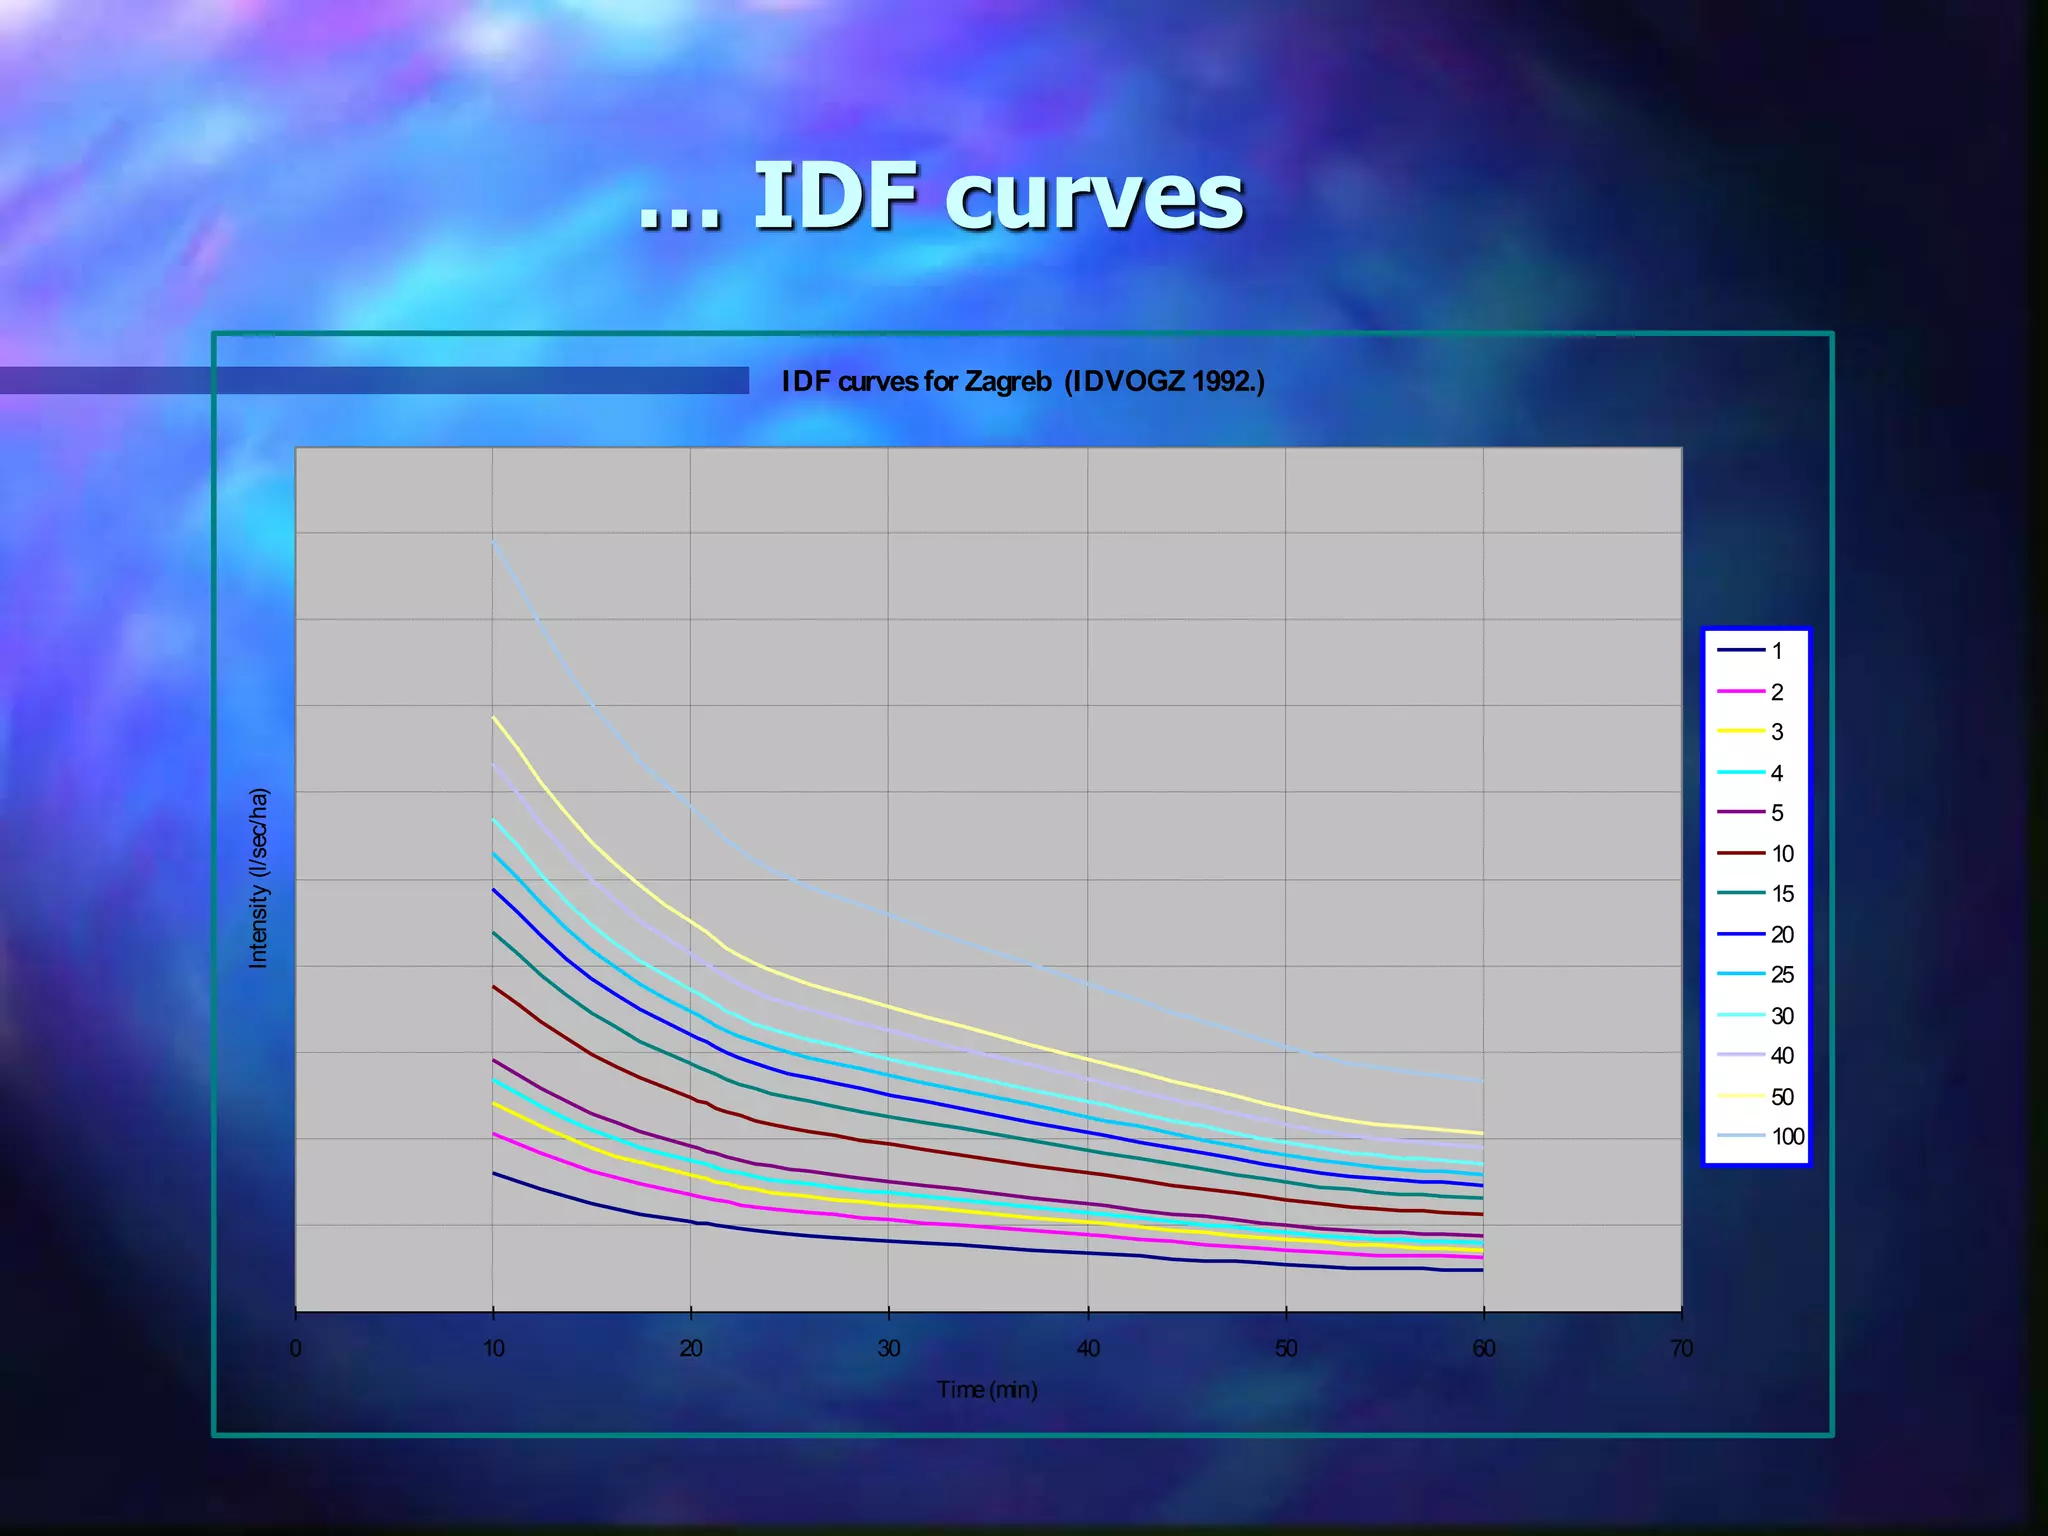
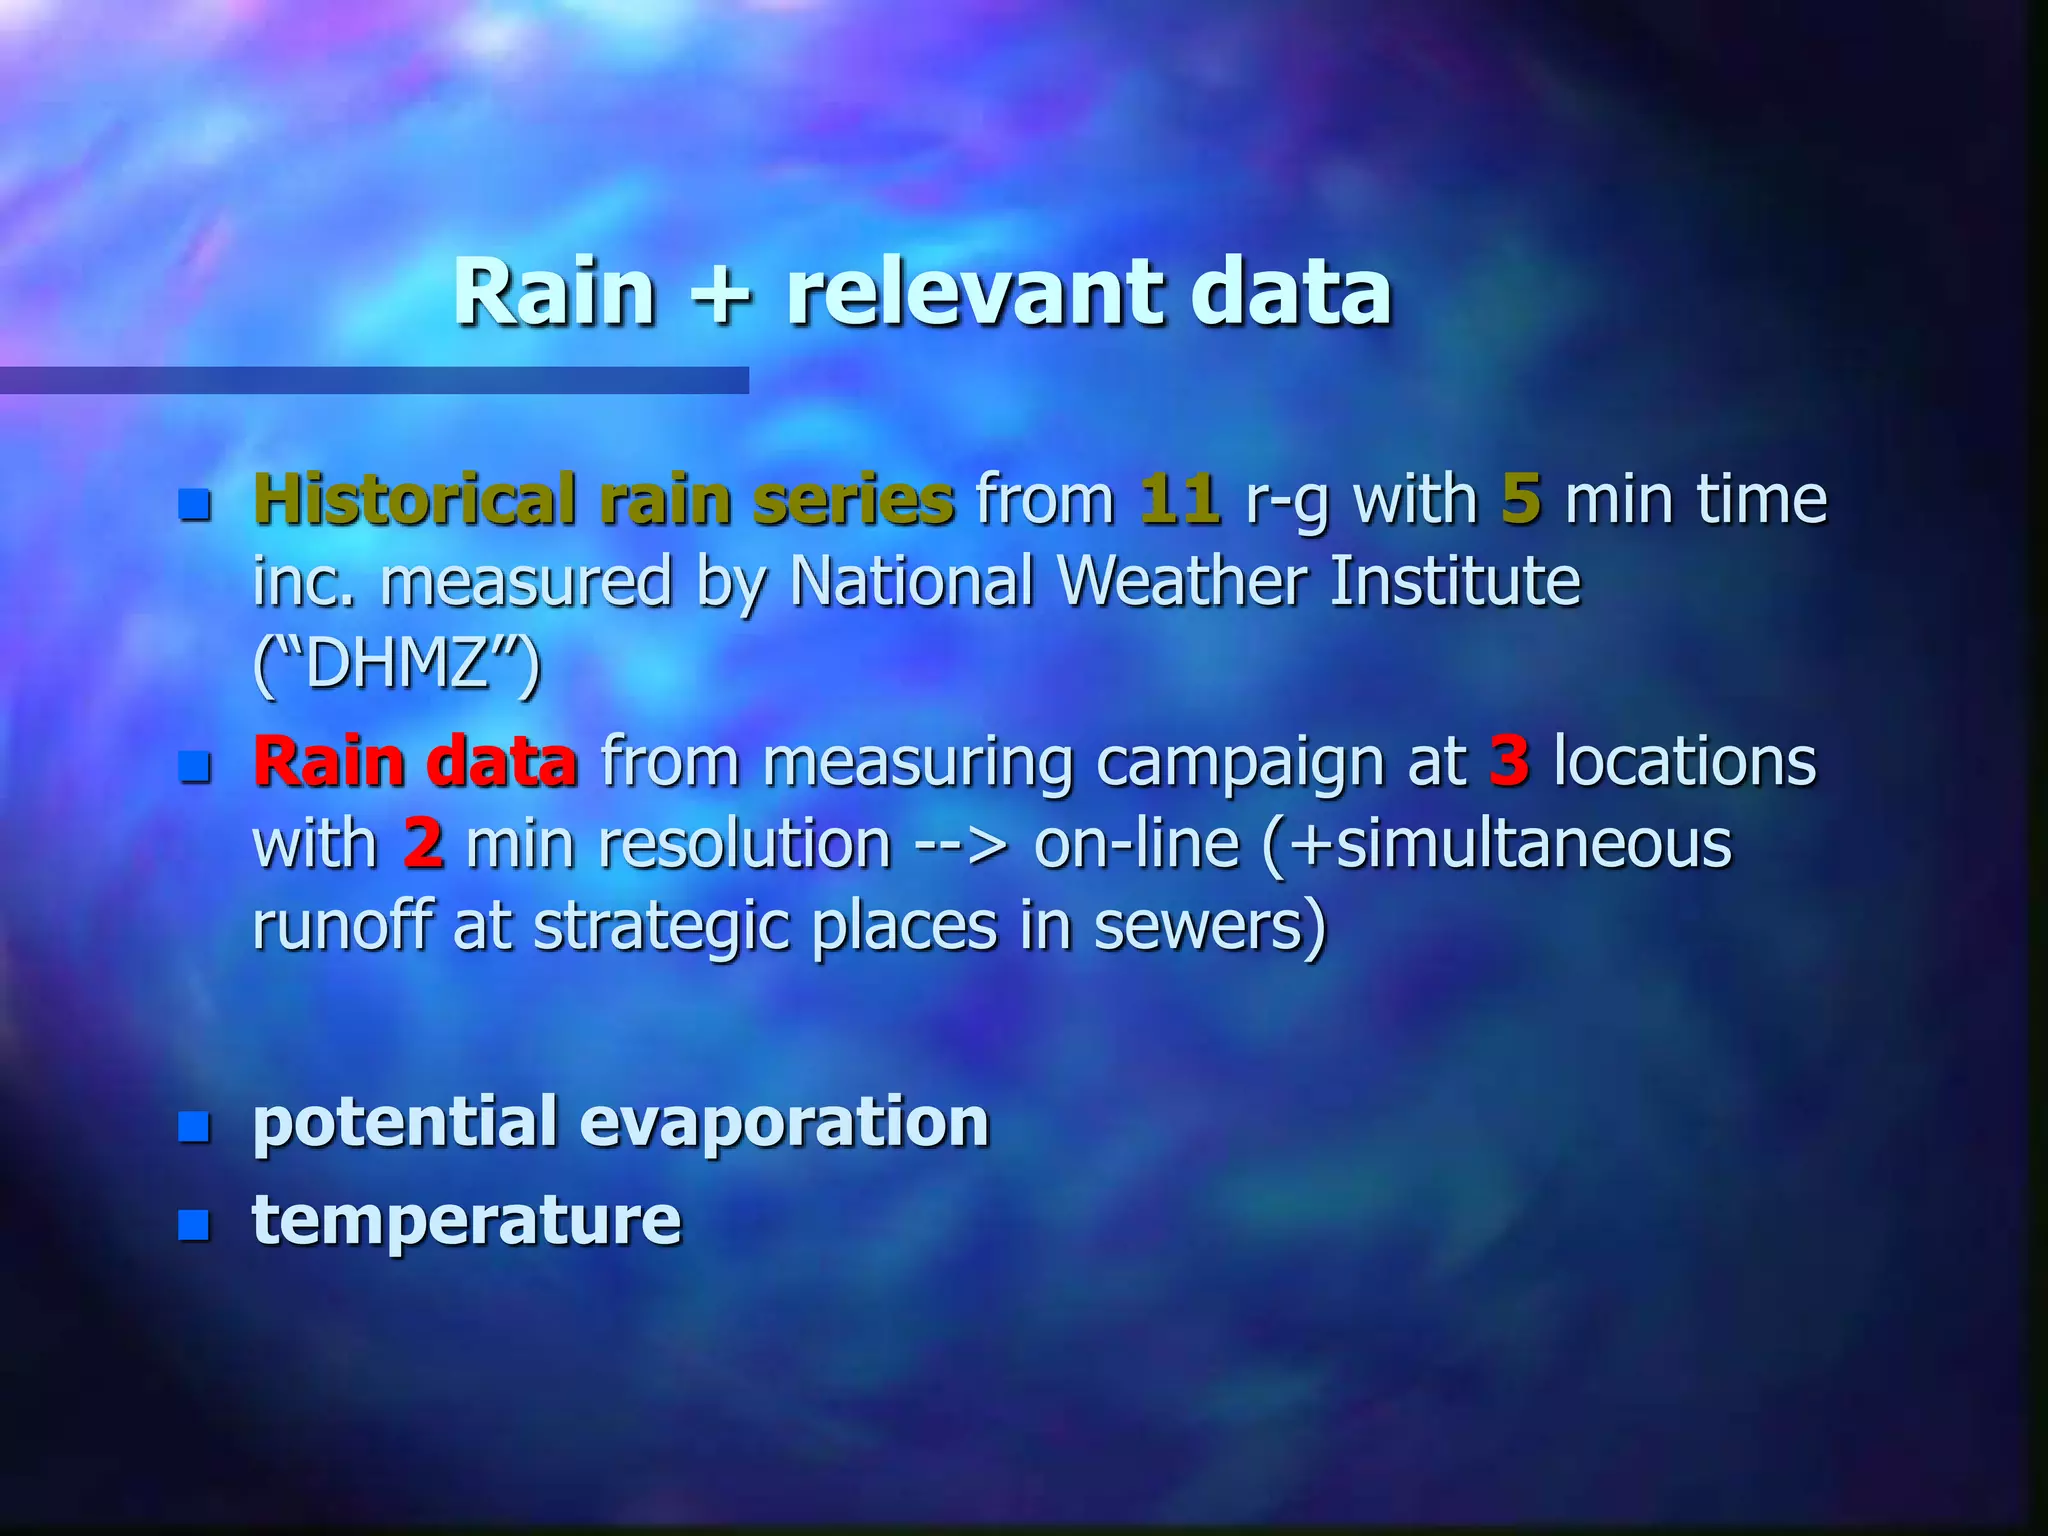
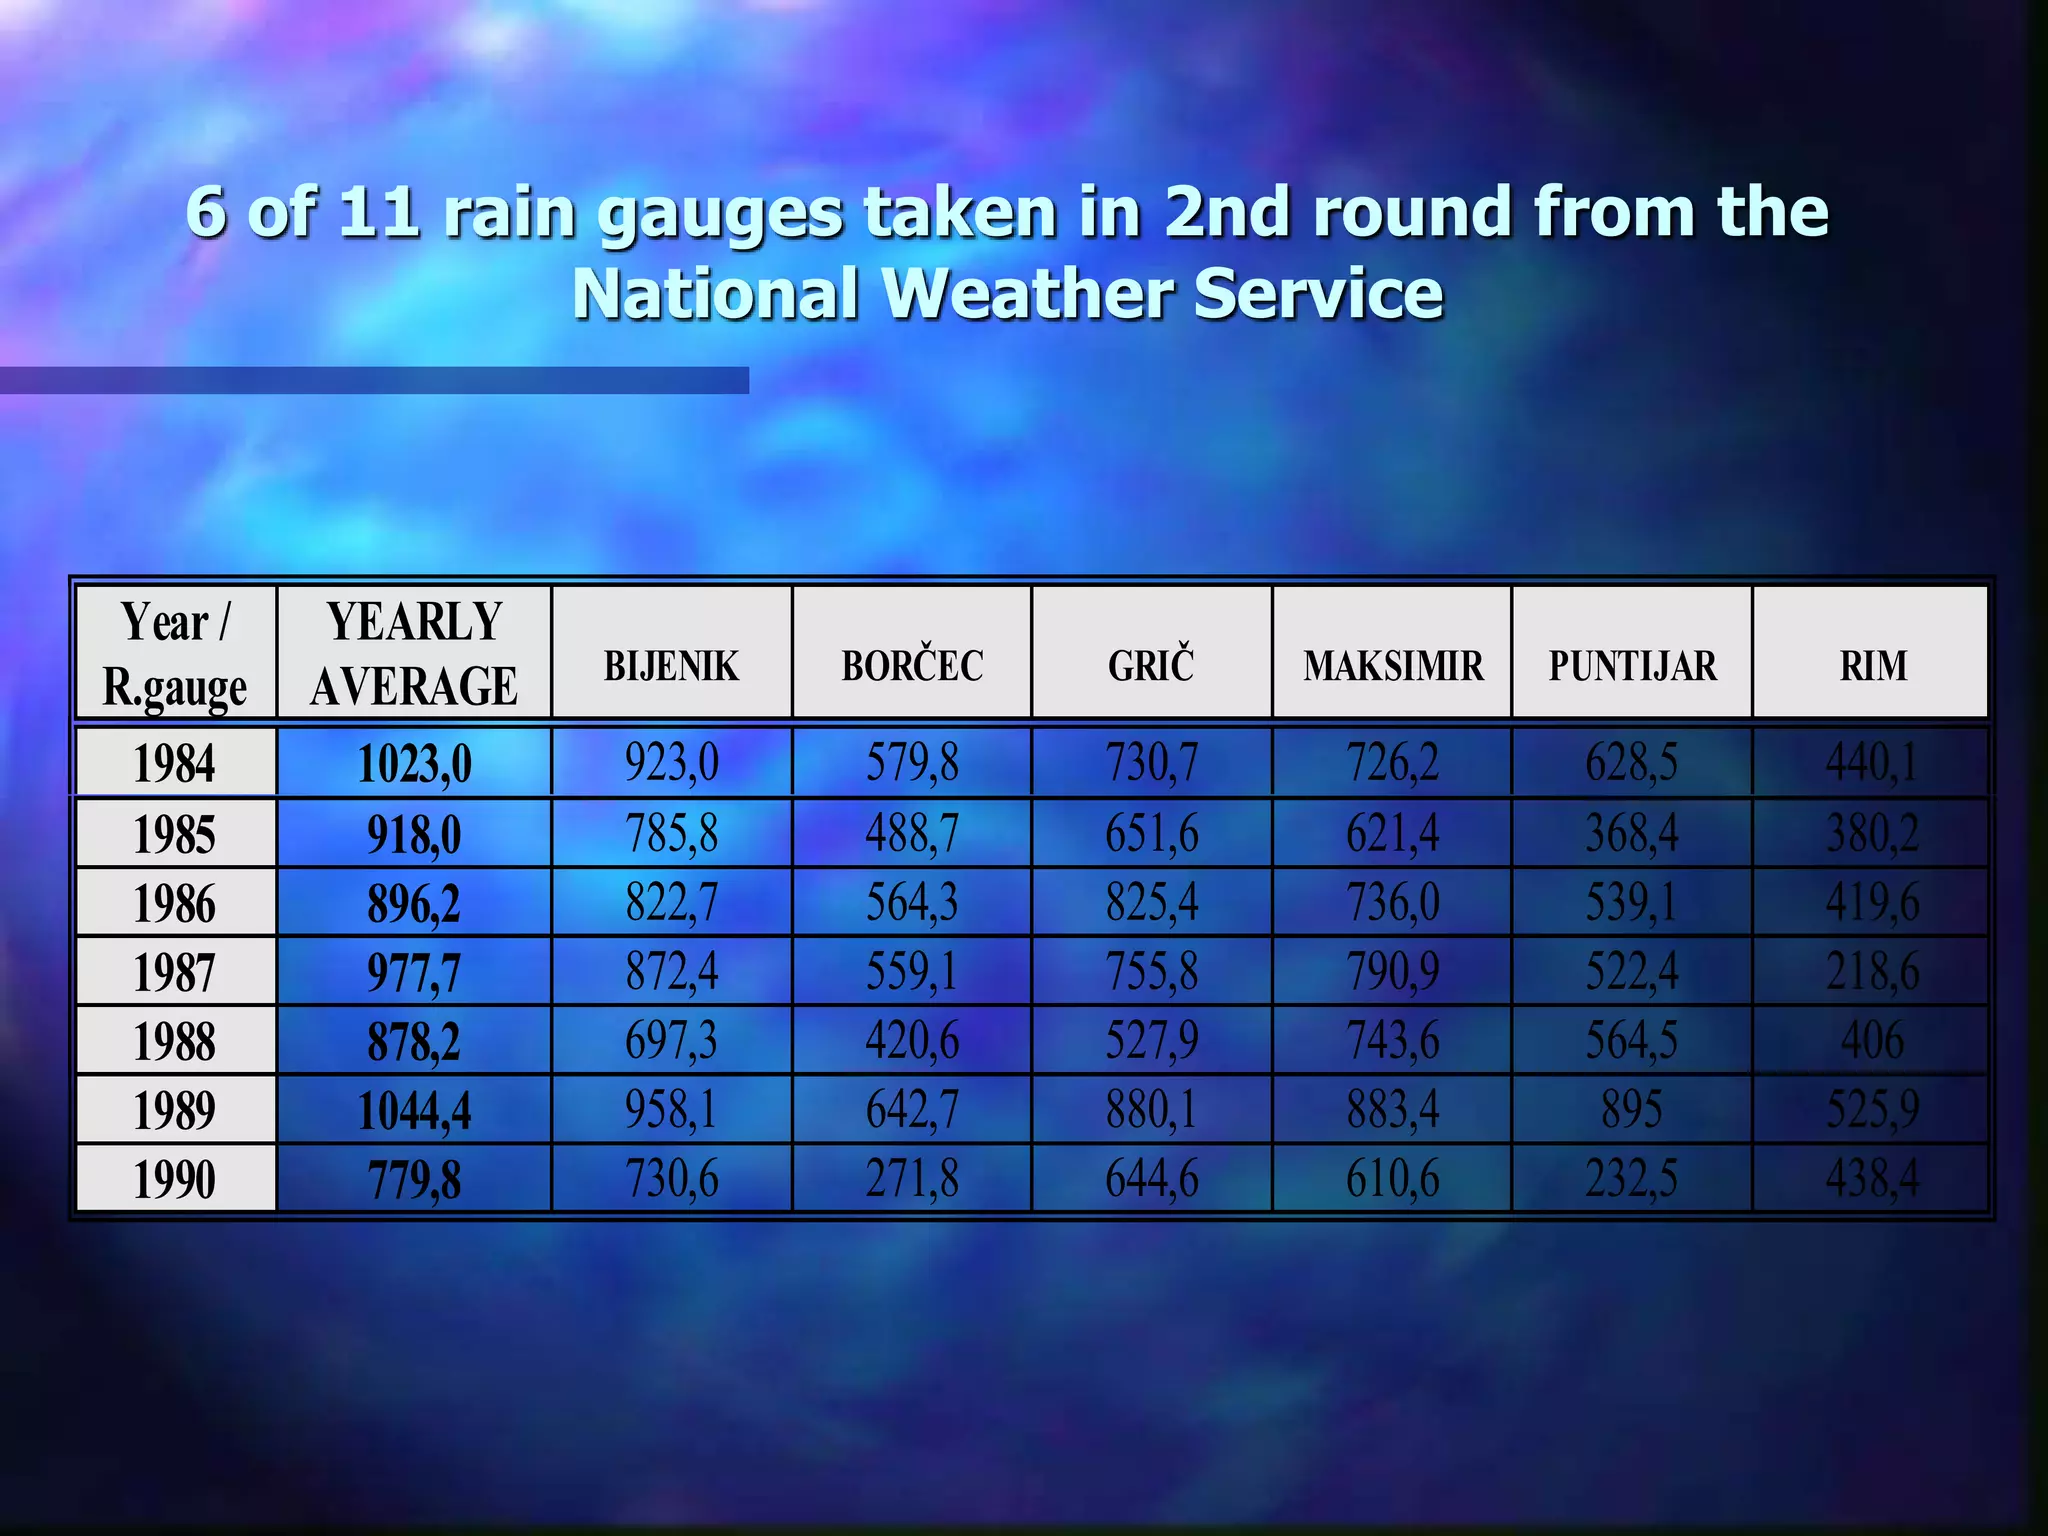
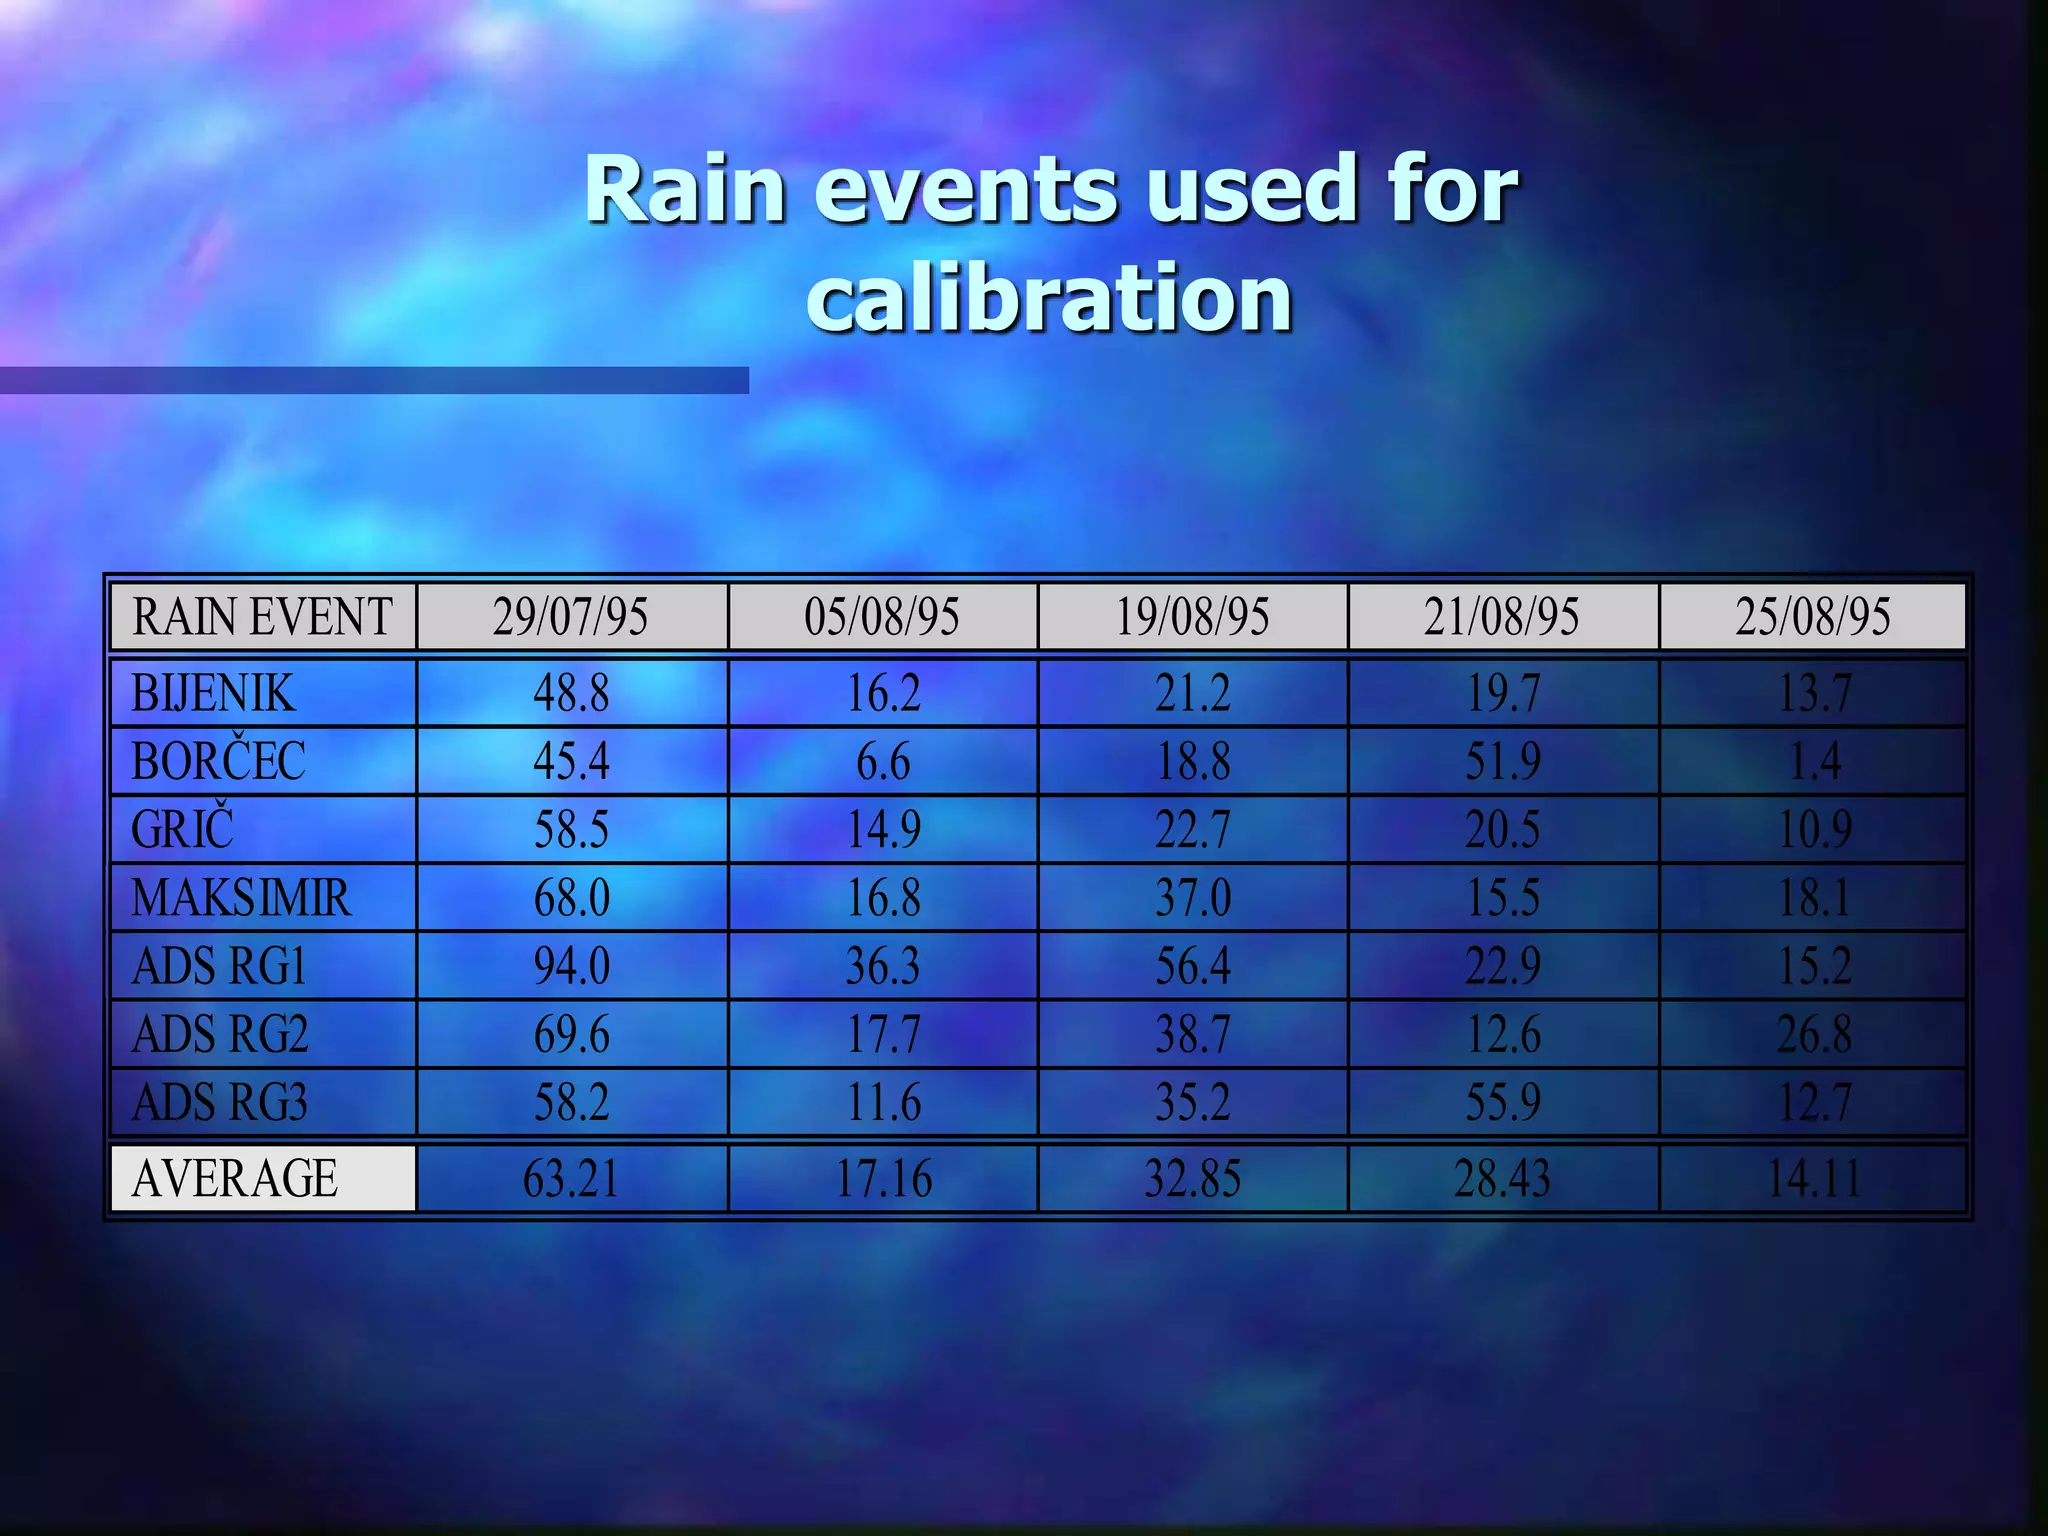
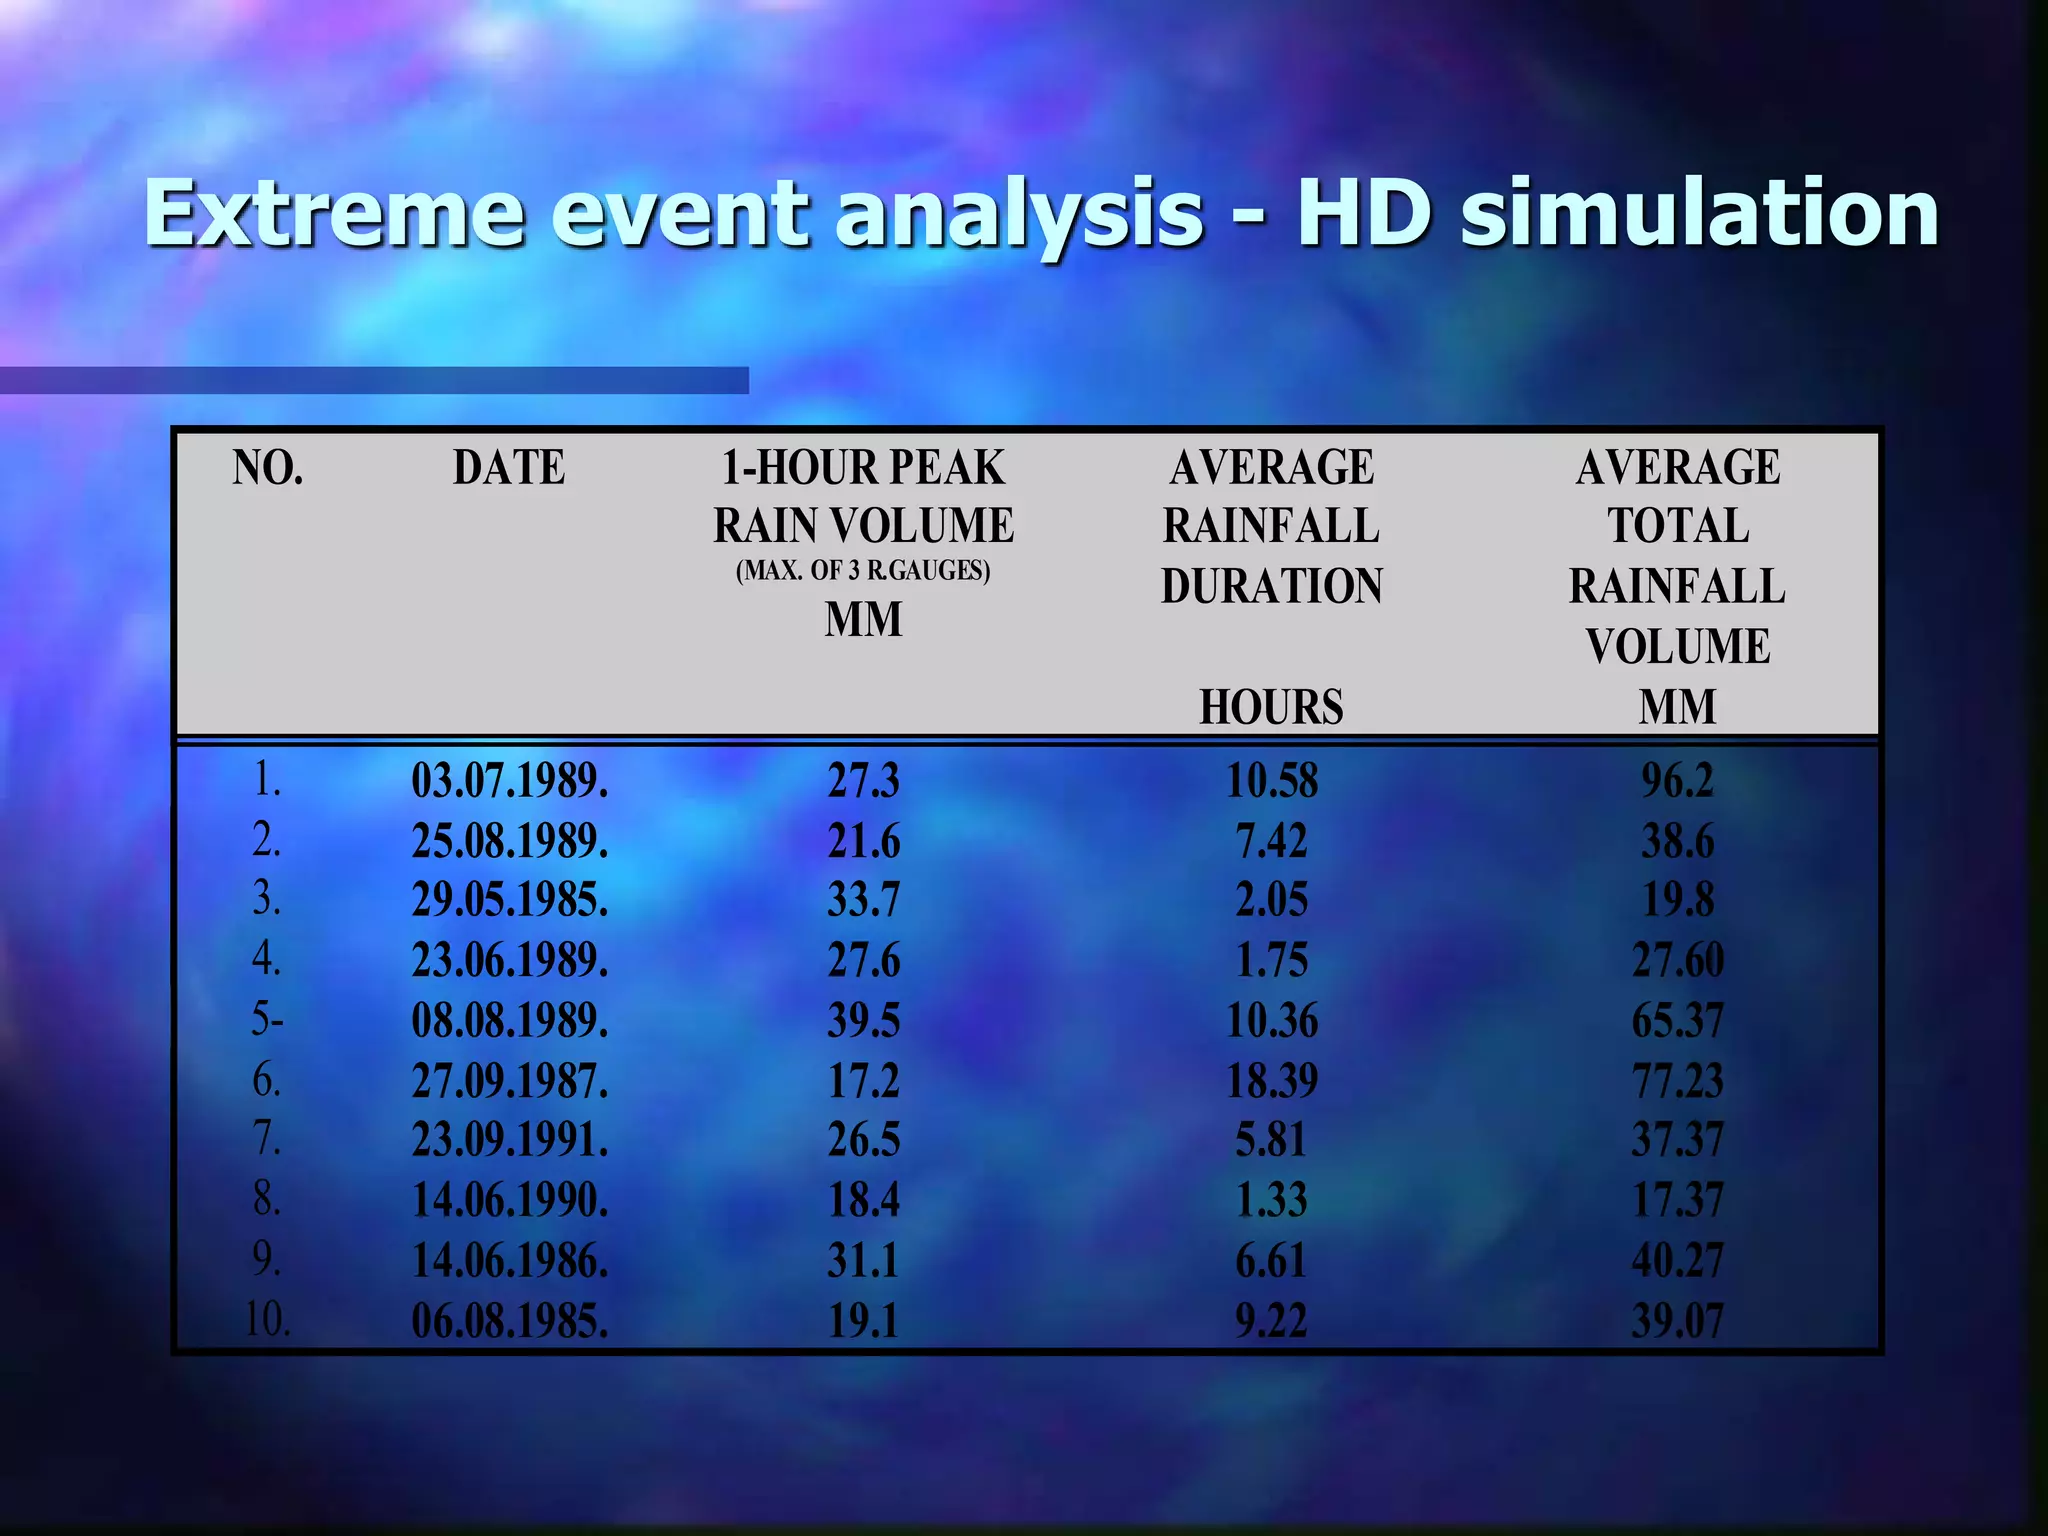
Bozidar Dedus
RAINFALL-RUNOFF
ANALYSIS FOR THE
ZAGREB SEWERAGE
OPTIMISATION PROJECT
Rainfall Workshop
04.-07. Dec. 1997. Pontresina Switzerland
General objectives of the Zagreb
project
 Phase I - create and verify model of the present state, clarify
system’s pattern of performance, clarify reasons for
missbehaviour, check system as a system
 Phase II - create Master Plan, design GIS cadasdre define
short term remedial measures, define new measurement
system, …
 Phase II a - define relevant parameters for the future
sewerage system performance w.r. to WWTP, and other
infrastructure projects
 Subsequent phases … WQ, Scada, RTC
Rainfall analysis
 Check applicability of traditional approaches based on IDF
relations and Rational formula vs. HD models and resulting
sewer’s dimensions
 Produce flooding maps based on IDF curves and relate them
to historical rain data simulations
 Check system’s performance on historical rain records
 Perform rainfall-runoff measuremnts and calirate/verify model
 Check applicability of historical rain data for design purposes
and relate to flooding frequencies
 Propose guidelines for design of the Zagreb sewer system
General data
 Zagreb sewerage serving 1 M inhabitants + Industry
 Catchment >200 km2, 30 km from W to E
 >180 M m3 average yearly volume of waste water
 ~1400 km of sewers
 2 M m3 retention capacity of sewers
 2 combined systems separted by the river Sava
 no CSO allowed by authorities so far
 6 small rivers introduced into the sewer system
 no WWTP
Traditional values
(valid for Zagreb)
 RAINFALL ANALYSIS
– IDF relationship valid for Zagreb derived as a complex
empirical formula ...
– Design IDF values i=140 l/sec/ha, D=25 min F=3 y.
 RUNOFF ANALYSIS
– all assumptions inherent to Rational formula
IDF relations developed for ZAGREB
HTP curves for Zagreb IDVOGZ 1992.
0,00
20,00
40,00
60,00
80,00
100,00
120,00
140,00
160,00
180,00
200,00
10 15 20 25 30 40 50 60 120 240 300 360 720 1080 1440
Time (min)
Rainstomrdepth(mm)
P = 1 god
P = 2 god
P = 3 god
P = 4 god
P = 5 god
P = 10 god
P = 15 god
P = 20 god
P = 25 god
P = 30 god
P = 40 god
P = 50 god
P = 100 god
P = 1000 god
P = 10000 god
… IDF curves
IDF curvesfor Zagreb (IDVOGZ 1992.)
0 10 20 30 40 50 60 70
Time(min)
Intensity(l/sec/ha)
1
2
3
4
5
10
15
20
25
30
40
50
100
Hydrological interest
 Investigate influence of FRC and SRC
 Investigate influence of hydrological memory of
the catchment
 investigate spatial and temporal rain pattern
 Define contributing factors of water balance in
yearly waste water production on the catchment
 Investigate overload duration and frequency vs.
untreated volume for hypothetical WWTP
 USE HISTORICAL RAIN SERIES RECORDS and
CONTINOUS MODELLING APPROACH !!!
Rain + relevant data
 Historical rain series from 11 r-g with 5 min time
inc. measured by National Weather Institute
(“DHMZ”)
 Rain data from measuring campaign at 3 locations
with 2 min resolution --> on-line (+simultaneous
runoff at strategic places in sewers)
 potential evaporation
 temperature
6 of 11 rain gauges taken in 2nd round from the
National Weather Service
Year /
R.gauge
YEARLY
AVERAGE BIJENIK BORČEC GRIČ MAKSIMIR PUNTIJAR RIM
1984 1023,0 923,0 579,8 730,7 726,2 628,5 440,1
1985 918,0 785,8 488,7 651,6 621,4 368,4 380,2
1986 896,2 822,7 564,3 825,4 736,0 539,1 419,6
1987 977,7 872,4 559,1 755,8 790,9 522,4 218,6
1988 878,2 697,3 420,6 527,9 743,6 564,5 406
1989 1044,4 958,1 642,7 880,1 883,4 895 525,9
1990 779,8 730,6 271,8 644,6 610,6 232,5 438,4
Permanent rain gauges / temporary flow
monitors
PER M A N EN T R A IN G A U G ES (“D H M Z”)
TEM PO R A R Y R A IN G A U G ES (“A D S”)
PER M A N EN T LEVEL/ VELO C ITY M O N ITO R
TEM PO R A R Y LEVEL / VELO C ITY / FLO W M O N ITO R S
Z A G R E B SE W E R A G E SY ST E M - M O N I T O R I N G L O CA T I O N SZ A G R E B SE W E R A G E SY ST E M - M O N I T O R I N G L O CA T I O N S
Rain events used for
calibration
RAIN EVENT 29/07/95 05/08/95 19/08/95 21/08/95 25/08/95
BIJENIK 48.8 16.2 21.2 19.7 13.7
BORČEC 45.4 6.6 18.8 51.9 1.4
GRIČ 58.5 14.9 22.7 20.5 10.9
MAKSIMIR 68.0 16.8 37.0 15.5 18.1
ADS RG1 94.0 36.3 56.4 22.9 15.2
ADS RG2 69.6 17.7 38.7 12.6 26.8
ADS RG3 58.2 11.6 35.2 55.9 12.7
AVERAGE 63.21 17.16 32.85 28.43 14.11
Rain event 1995.07.25. measured by seven rain gauges
RG3-GAJNICE BORČEC BIJENIK GRIČ RG2-FOLNEG. MAKSIMIR RG1-SESVETE
ALTITUDE
(m)
122 200 230 158 114 125 115
START 3:45 3:25 3:25 4:05 4:15 4:10 4:18
END 12:54 12:15 11:45 12:50 12:41 13:05 12:33
DURATION
(hour) 9.15 7.83 8.33 8.75 8.43 8.92 8.25
MAXIMUM
(hour)
4:30 04:21 04:31 04:46 4:51 04:51 5:37
MAXIMUM
(mm)
1.05 0.9 0.86 0.96 0.95 1.22 0.95
TOTAL
RAINDEPTH
(mm)
55.7 43.5 46.4 55.4 65.8 64.54 86.3
Rain guage no. 1: Sesvete
Rainfall event 1995.7.29.
0
0.2
0.4
0.6
0.8
1
1.2
0:52
1:37
2:22
3:07
3:52
4:37
5:22
6:07
6:52
7:37
8:22
9:07
9:52
10:37
11:22
12:07
12:52
13:37
14:22
15:07
15:52
16:37
17:22
Time
Raindepth(mm)
Rain guage no. 2: Folnegoviceva
Rainfall event 1995.7.29.
0
0.2
0.4
0.6
0.8
1
1.2
0:58
1:49
2:40
3:31
4:22
5:13
6:04
6:55
7:46
8:37
9:28
10:19
11:10
12:01
12:52
13:43
14:34
15:25
16:16
17:07
17:58
18:49
19:40
Time
Raindepth(mm)
Rain guage no. 3: Gajnice
Rainfall event 1995.7.29.
0
0.2
0.4
0.6
0.8
1
1.2
0:55
1:43
2:31
3:19
4:07
4:55
5:43
6:31
7:19
8:07
8:55
9:43
10:31
11:19
12:07
12:55
13:43
14:31
15:19
16:07
16:55
17:43
18:31
19:19
Time
Raindepth(mm)
ADS three RAINGUAGES
Rainfall event 1995.7.29.
0
0.2
0.4
0.6
0.8
1
1.2
0:58
1:49
2:40
3:31
4:22
5:13
6:04
6:55
7:46
8:37
9:28
10:19
11:10
12:01
12:52
13:43
14:34
15:25
16:16
17:07
17:58
18:49
19:40
Time
Raindepth(mm)
Rainguage BIJENIK
Rainfall event 1995.7.29.
0
0.2
0.4
0.6
0.8
1
1.2
1.4 0:25
1:19
2:13
3:07
4:01
4:55
5:49
6:43
7:37
8:31
9:25
10:19
11:13
12:07
13:01
13:55
14:49
15:43
16:37
17:31
18:25
19:19
20:13
21:07
Time
Raindepth(mm)
Rainguage BORCEC
Rainfall event 1995.7.29
0
0.2
0.4
0.6
0.8
1
1.2
1.4
0:30
1:22
2:14
3:06
3:58
4:50
5:42
6:34
7:26
8:18
9:10
10:02
10:54
11:46
12:38
13:30
14:22
15:14
16:06
16:58
17:50
18:42
19:34
20:26
21:18
Time
Raindepth(mm)
Rainguage MAKSIMIR
Rainfall event 1995.7.29.
0
0.2
0.4
0.6
0.8
1
1.2
1.4
0:45
2:01
3:17
4:33
5:49
7:05
8:21
9:37
10:53
12:09
13:25
14:41
15:57
17:13
18:29
19:45
21:01
Time
Raindepth(mm)
Raingauge GRIC
Rainfall event 1995.7.29.
0
0.2
0.4
0.6
0.8
1
1.2
1.4
0:25
1:44
3:03
4:22
5:41
7:00
8:19
9:38
10:57
12:16
13:35
14:54
16:13
17:32
18:51
20:10
21:29
Time
Raindepth(mm)
DHMZ four rainguages
Rainevent 1995.7.29
0
0.2
0.4
0.6
0.8
1
1.2
1.4
0:25
1:30
2:35
3:40
4:45
5:50
6:55
8:00
9:05
10:10
11:15
12:20
13:25
14:30
15:35
16:40
17:45
18:50
19:55
21:00
Time
Raindepth(mm)
BIJENIK
BORCEC
MAKSIMIR
GRIC
Calibration results
Extreme event analysis - HD simulation
NO. DATE 1-HOUR PEAK
RAIN VOLUME
(MAX. OF 3 R.GAUGES)
MM
AVERAGE
RAINFALL
DURATION
HOURS
AVERAGE
TOTAL
RAINFALL
VOLUME
MM
1. 03.07.1989. 27.3 10.58 96.2
2. 25.08.1989. 21.6 7.42 38.6
3. 29.05.1985. 33.7 2.05 19.8
4. 23.06.1989. 27.6 1.75 27.60
5- 08.08.1989. 39.5 10.36 65.37
6. 27.09.1987. 17.2 18.39 77.23
7. 23.09.1991. 26.5 5.81 37.37
8. 14.06.1990. 18.4 1.33 17.37
9. 14.06.1986. 31.1 6.61 40.27
10. 06.08.1985. 19.1 9.22 39.07
Flooding map
FL O O D M A P I L L U ST R A T I N G T H E FR E Q U E N CY O F FL O O D I N G R E CU R R E N CEFL O O D M A P I L L U ST R A T I N G T H E FR E Q U E N CY O F FL O O D I N G R E CU R R E N CE
FL O O D E D O N CE I N 10 Y E A R S
FL O O D E D 2 - 3 T I M E S I N 10 Y E A R S
FL O O D E D 4 O R M O R E T I M E S I N 10 Y E A R S
BA SE D O N T H E “PI L O T ” SI M U L A T I O N S (1984. - 1993.) E X PE R I E N CE D
CR I T I CA L A R E A S
A N D PO SSI BL E
FL O O D I N G Z O N E S
Conclusions
 Use IDF curves … YES when designing secondary
sewers, and as a initial step before use of historical
rain records for final solutions
 Use Rational Formula … NO
 Use Historical rain series … YES when designing
system’s performance pattern, Master Plan, detailed
insight in generation of surcharge and flooding,
structures, input to WWTP, etc.
More conclusions ...
 SRC component (rain induced infiltration) important
 Catchments sensitive to hydrological history … i.e. to
catchment’s hydrological memory
 Majority of relevant rain events come from N, problem
arrives when it comes from W --> E
 Time difference is important for rain events coming
from W --> E
 Spatial and temporal differences subject to further
investigation (current)
Contributing factors in water balance
KEY NUMBERS - FLOW COMPONENTS IN GOK
Yearlyaveragecontributions
Sanitary+ Industrial
Flow
53%
SurfaceRunoff
6%
InflowfromCreeks
36%
GroundWater
Infiltration
5%
More conclusions ...
WWTP loadings for different volume of untreated water, overload frequency
and duration
0
2
4
6
8
10
12
14
16
18
20
6 9 12 15 18
WWTP capacity m3/s
milionam3/god.
0
10
20
30
40
50
60
OverloadFrequencyandDuration
Netretirani volumen (miliona m3/god)
U~estalost preoptere}enja (doga|aj/godi{nje)
Trajanje preoptere}enja (dana/godi{nje)
KEEP IN MIND
 DON’T LOOSE TOUCH OF WHAT IS
THE PURPOSE AND OBJECTIVE OF
RAINFALL ANALYSIS
 DECISION MAKERS (MONEY
HOLDERS) WILL EASE YOUR
PROBLEMS - THEY WILL IMPLICITLY
DEFINE RELEVANT RAIN INPUT

Stmoritz

  • 1.
    Bozidar Dedus RAINFALL-RUNOFF ANALYSIS FORTHE ZAGREB SEWERAGE OPTIMISATION PROJECT Rainfall Workshop 04.-07. Dec. 1997. Pontresina Switzerland
  • 2.
    General objectives ofthe Zagreb project  Phase I - create and verify model of the present state, clarify system’s pattern of performance, clarify reasons for missbehaviour, check system as a system  Phase II - create Master Plan, design GIS cadasdre define short term remedial measures, define new measurement system, …  Phase II a - define relevant parameters for the future sewerage system performance w.r. to WWTP, and other infrastructure projects  Subsequent phases … WQ, Scada, RTC
  • 3.
    Rainfall analysis  Checkapplicability of traditional approaches based on IDF relations and Rational formula vs. HD models and resulting sewer’s dimensions  Produce flooding maps based on IDF curves and relate them to historical rain data simulations  Check system’s performance on historical rain records  Perform rainfall-runoff measuremnts and calirate/verify model  Check applicability of historical rain data for design purposes and relate to flooding frequencies  Propose guidelines for design of the Zagreb sewer system
  • 4.
    General data  Zagrebsewerage serving 1 M inhabitants + Industry  Catchment >200 km2, 30 km from W to E  >180 M m3 average yearly volume of waste water  ~1400 km of sewers  2 M m3 retention capacity of sewers  2 combined systems separted by the river Sava  no CSO allowed by authorities so far  6 small rivers introduced into the sewer system  no WWTP
  • 6.
    Traditional values (valid forZagreb)  RAINFALL ANALYSIS – IDF relationship valid for Zagreb derived as a complex empirical formula ... – Design IDF values i=140 l/sec/ha, D=25 min F=3 y.  RUNOFF ANALYSIS – all assumptions inherent to Rational formula
  • 7.
    IDF relations developedfor ZAGREB HTP curves for Zagreb IDVOGZ 1992. 0,00 20,00 40,00 60,00 80,00 100,00 120,00 140,00 160,00 180,00 200,00 10 15 20 25 30 40 50 60 120 240 300 360 720 1080 1440 Time (min) Rainstomrdepth(mm) P = 1 god P = 2 god P = 3 god P = 4 god P = 5 god P = 10 god P = 15 god P = 20 god P = 25 god P = 30 god P = 40 god P = 50 god P = 100 god P = 1000 god P = 10000 god
  • 8.
    … IDF curves IDFcurvesfor Zagreb (IDVOGZ 1992.) 0 10 20 30 40 50 60 70 Time(min) Intensity(l/sec/ha) 1 2 3 4 5 10 15 20 25 30 40 50 100
  • 9.
    Hydrological interest  Investigateinfluence of FRC and SRC  Investigate influence of hydrological memory of the catchment  investigate spatial and temporal rain pattern  Define contributing factors of water balance in yearly waste water production on the catchment  Investigate overload duration and frequency vs. untreated volume for hypothetical WWTP  USE HISTORICAL RAIN SERIES RECORDS and CONTINOUS MODELLING APPROACH !!!
  • 10.
    Rain + relevantdata  Historical rain series from 11 r-g with 5 min time inc. measured by National Weather Institute (“DHMZ”)  Rain data from measuring campaign at 3 locations with 2 min resolution --> on-line (+simultaneous runoff at strategic places in sewers)  potential evaporation  temperature
  • 11.
    6 of 11rain gauges taken in 2nd round from the National Weather Service Year / R.gauge YEARLY AVERAGE BIJENIK BORČEC GRIČ MAKSIMIR PUNTIJAR RIM 1984 1023,0 923,0 579,8 730,7 726,2 628,5 440,1 1985 918,0 785,8 488,7 651,6 621,4 368,4 380,2 1986 896,2 822,7 564,3 825,4 736,0 539,1 419,6 1987 977,7 872,4 559,1 755,8 790,9 522,4 218,6 1988 878,2 697,3 420,6 527,9 743,6 564,5 406 1989 1044,4 958,1 642,7 880,1 883,4 895 525,9 1990 779,8 730,6 271,8 644,6 610,6 232,5 438,4
  • 12.
    Permanent rain gauges/ temporary flow monitors PER M A N EN T R A IN G A U G ES (“D H M Z”) TEM PO R A R Y R A IN G A U G ES (“A D S”) PER M A N EN T LEVEL/ VELO C ITY M O N ITO R TEM PO R A R Y LEVEL / VELO C ITY / FLO W M O N ITO R S Z A G R E B SE W E R A G E SY ST E M - M O N I T O R I N G L O CA T I O N SZ A G R E B SE W E R A G E SY ST E M - M O N I T O R I N G L O CA T I O N S
  • 13.
    Rain events usedfor calibration RAIN EVENT 29/07/95 05/08/95 19/08/95 21/08/95 25/08/95 BIJENIK 48.8 16.2 21.2 19.7 13.7 BORČEC 45.4 6.6 18.8 51.9 1.4 GRIČ 58.5 14.9 22.7 20.5 10.9 MAKSIMIR 68.0 16.8 37.0 15.5 18.1 ADS RG1 94.0 36.3 56.4 22.9 15.2 ADS RG2 69.6 17.7 38.7 12.6 26.8 ADS RG3 58.2 11.6 35.2 55.9 12.7 AVERAGE 63.21 17.16 32.85 28.43 14.11
  • 14.
    Rain event 1995.07.25.measured by seven rain gauges RG3-GAJNICE BORČEC BIJENIK GRIČ RG2-FOLNEG. MAKSIMIR RG1-SESVETE ALTITUDE (m) 122 200 230 158 114 125 115 START 3:45 3:25 3:25 4:05 4:15 4:10 4:18 END 12:54 12:15 11:45 12:50 12:41 13:05 12:33 DURATION (hour) 9.15 7.83 8.33 8.75 8.43 8.92 8.25 MAXIMUM (hour) 4:30 04:21 04:31 04:46 4:51 04:51 5:37 MAXIMUM (mm) 1.05 0.9 0.86 0.96 0.95 1.22 0.95 TOTAL RAINDEPTH (mm) 55.7 43.5 46.4 55.4 65.8 64.54 86.3
  • 15.
    Rain guage no.1: Sesvete Rainfall event 1995.7.29. 0 0.2 0.4 0.6 0.8 1 1.2 0:52 1:37 2:22 3:07 3:52 4:37 5:22 6:07 6:52 7:37 8:22 9:07 9:52 10:37 11:22 12:07 12:52 13:37 14:22 15:07 15:52 16:37 17:22 Time Raindepth(mm) Rain guage no. 2: Folnegoviceva Rainfall event 1995.7.29. 0 0.2 0.4 0.6 0.8 1 1.2 0:58 1:49 2:40 3:31 4:22 5:13 6:04 6:55 7:46 8:37 9:28 10:19 11:10 12:01 12:52 13:43 14:34 15:25 16:16 17:07 17:58 18:49 19:40 Time Raindepth(mm) Rain guage no. 3: Gajnice Rainfall event 1995.7.29. 0 0.2 0.4 0.6 0.8 1 1.2 0:55 1:43 2:31 3:19 4:07 4:55 5:43 6:31 7:19 8:07 8:55 9:43 10:31 11:19 12:07 12:55 13:43 14:31 15:19 16:07 16:55 17:43 18:31 19:19 Time Raindepth(mm) ADS three RAINGUAGES Rainfall event 1995.7.29. 0 0.2 0.4 0.6 0.8 1 1.2 0:58 1:49 2:40 3:31 4:22 5:13 6:04 6:55 7:46 8:37 9:28 10:19 11:10 12:01 12:52 13:43 14:34 15:25 16:16 17:07 17:58 18:49 19:40 Time Raindepth(mm)
  • 16.
    Rainguage BIJENIK Rainfall event1995.7.29. 0 0.2 0.4 0.6 0.8 1 1.2 1.4 0:25 1:19 2:13 3:07 4:01 4:55 5:49 6:43 7:37 8:31 9:25 10:19 11:13 12:07 13:01 13:55 14:49 15:43 16:37 17:31 18:25 19:19 20:13 21:07 Time Raindepth(mm) Rainguage BORCEC Rainfall event 1995.7.29 0 0.2 0.4 0.6 0.8 1 1.2 1.4 0:30 1:22 2:14 3:06 3:58 4:50 5:42 6:34 7:26 8:18 9:10 10:02 10:54 11:46 12:38 13:30 14:22 15:14 16:06 16:58 17:50 18:42 19:34 20:26 21:18 Time Raindepth(mm) Rainguage MAKSIMIR Rainfall event 1995.7.29. 0 0.2 0.4 0.6 0.8 1 1.2 1.4 0:45 2:01 3:17 4:33 5:49 7:05 8:21 9:37 10:53 12:09 13:25 14:41 15:57 17:13 18:29 19:45 21:01 Time Raindepth(mm) Raingauge GRIC Rainfall event 1995.7.29. 0 0.2 0.4 0.6 0.8 1 1.2 1.4 0:25 1:44 3:03 4:22 5:41 7:00 8:19 9:38 10:57 12:16 13:35 14:54 16:13 17:32 18:51 20:10 21:29 Time Raindepth(mm) DHMZ four rainguages Rainevent 1995.7.29 0 0.2 0.4 0.6 0.8 1 1.2 1.4 0:25 1:30 2:35 3:40 4:45 5:50 6:55 8:00 9:05 10:10 11:15 12:20 13:25 14:30 15:35 16:40 17:45 18:50 19:55 21:00 Time Raindepth(mm) BIJENIK BORCEC MAKSIMIR GRIC
  • 17.
  • 18.
    Extreme event analysis- HD simulation NO. DATE 1-HOUR PEAK RAIN VOLUME (MAX. OF 3 R.GAUGES) MM AVERAGE RAINFALL DURATION HOURS AVERAGE TOTAL RAINFALL VOLUME MM 1. 03.07.1989. 27.3 10.58 96.2 2. 25.08.1989. 21.6 7.42 38.6 3. 29.05.1985. 33.7 2.05 19.8 4. 23.06.1989. 27.6 1.75 27.60 5- 08.08.1989. 39.5 10.36 65.37 6. 27.09.1987. 17.2 18.39 77.23 7. 23.09.1991. 26.5 5.81 37.37 8. 14.06.1990. 18.4 1.33 17.37 9. 14.06.1986. 31.1 6.61 40.27 10. 06.08.1985. 19.1 9.22 39.07
  • 19.
    Flooding map FL OO D M A P I L L U ST R A T I N G T H E FR E Q U E N CY O F FL O O D I N G R E CU R R E N CEFL O O D M A P I L L U ST R A T I N G T H E FR E Q U E N CY O F FL O O D I N G R E CU R R E N CE FL O O D E D O N CE I N 10 Y E A R S FL O O D E D 2 - 3 T I M E S I N 10 Y E A R S FL O O D E D 4 O R M O R E T I M E S I N 10 Y E A R S BA SE D O N T H E “PI L O T ” SI M U L A T I O N S (1984. - 1993.) E X PE R I E N CE D CR I T I CA L A R E A S A N D PO SSI BL E FL O O D I N G Z O N E S
  • 20.
    Conclusions  Use IDFcurves … YES when designing secondary sewers, and as a initial step before use of historical rain records for final solutions  Use Rational Formula … NO  Use Historical rain series … YES when designing system’s performance pattern, Master Plan, detailed insight in generation of surcharge and flooding, structures, input to WWTP, etc.
  • 21.
    More conclusions ... SRC component (rain induced infiltration) important  Catchments sensitive to hydrological history … i.e. to catchment’s hydrological memory  Majority of relevant rain events come from N, problem arrives when it comes from W --> E  Time difference is important for rain events coming from W --> E  Spatial and temporal differences subject to further investigation (current)
  • 22.
    Contributing factors inwater balance KEY NUMBERS - FLOW COMPONENTS IN GOK Yearlyaveragecontributions Sanitary+ Industrial Flow 53% SurfaceRunoff 6% InflowfromCreeks 36% GroundWater Infiltration 5%
  • 23.
    More conclusions ... WWTPloadings for different volume of untreated water, overload frequency and duration 0 2 4 6 8 10 12 14 16 18 20 6 9 12 15 18 WWTP capacity m3/s milionam3/god. 0 10 20 30 40 50 60 OverloadFrequencyandDuration Netretirani volumen (miliona m3/god) U~estalost preoptere}enja (doga|aj/godi{nje) Trajanje preoptere}enja (dana/godi{nje)
  • 24.
    KEEP IN MIND DON’T LOOSE TOUCH OF WHAT IS THE PURPOSE AND OBJECTIVE OF RAINFALL ANALYSIS  DECISION MAKERS (MONEY HOLDERS) WILL EASE YOUR PROBLEMS - THEY WILL IMPLICITLY DEFINE RELEVANT RAIN INPUT