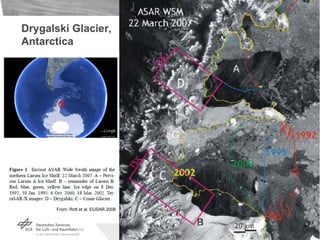
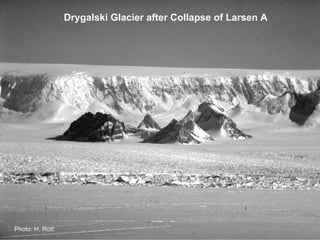
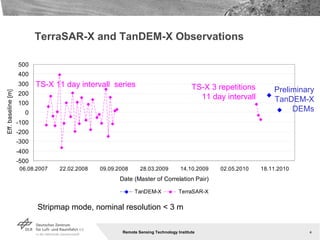
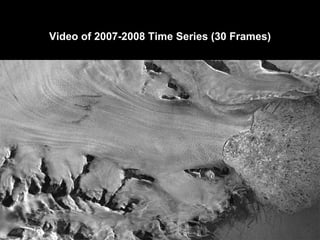
1) The document analyzes glacier flow measurements of Drygalski Glacier in Antarctica using TerraSAR-X and TanDEM-X satellite radar imagery over multiple years.
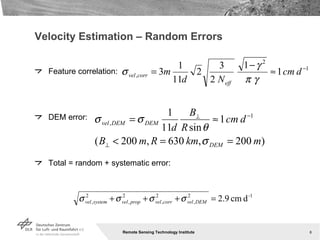
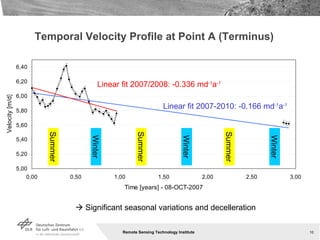
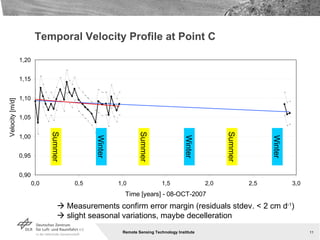
2) Velocity mapping found seasonal variations in flow at the glacier terminus, as well as a possible slight deceleration between 2007-2010.
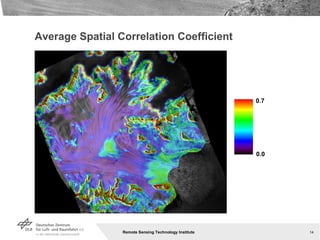
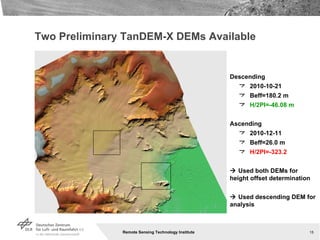
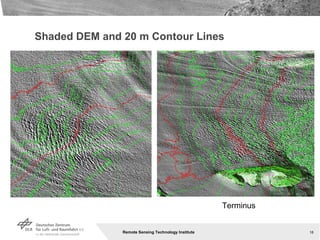
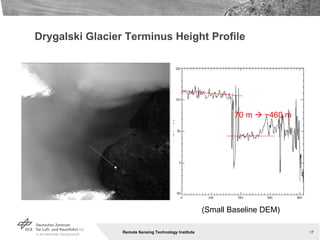
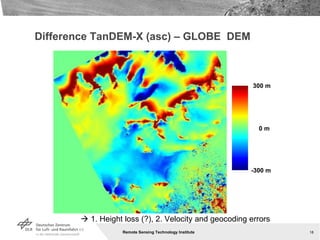
3) Preliminary TanDEM-X DEMs were produced and compared to other data, finding height errors within expectations over the glacier area. The DEMs provide useful data on glacier thickness and roughness.
![Average Three-Year Velocity Map 0.0 6.0 [m/d] 5 km A C](https://image.slidesharecdn.com/5-glacier-igarss11-eineder-110728171745-phpapp02/85/5_Glacier_IGARSS11_Eineder-ppt-9-320.jpg)
![One-Year Deceleration Map A C -0.4 0.4 [md -1 a -1 ]](https://image.slidesharecdn.com/5-glacier-igarss11-eineder-110728171745-phpapp02/85/5_Glacier_IGARSS11_Eineder-ppt-12-320.jpg)
![Three-Year Deceleration Map A C -0.4 0.4 [md -1 a -1 ]](https://image.slidesharecdn.com/5-glacier-igarss11-eineder-110728171745-phpapp02/85/5_Glacier_IGARSS11_Eineder-ppt-13-320.jpg)
![TanDEM-X DEM Roughness Map Roughnes map 0.0 3.0 σ h [m] Roughness based on 10 x 10 pixel plane residuals (50 x 50 m 2 ) Coincides with correlation map, confirms DEM quality](https://image.slidesharecdn.com/5-glacier-igarss11-eineder-110728171745-phpapp02/85/5_Glacier_IGARSS11_Eineder-ppt-19-320.jpg)