SlideShare a Scribd company logo
1 of 247
Community Ecology ,[object Object],[object Object],[object Object]
[object Object],[object Object],Figure 53.1
[object Object],[object Object],[object Object]
[object Object],[object Object],Table 53.1
Competition ,[object Object],[object Object],[object Object],[object Object]
The Competitive Exclusion Principle ,[object Object],[object Object]
Ecological Niches ,[object Object],[object Object]
[object Object],[object Object]
[object Object],[object Object],When Connell removed  Balanus  from the lower strata, the  Chthamalus  population spread into that area. The spread of  Chthamalus  when  Balanus  was   removed indicates that competitive exclusion makes the realized niche of  Chthamalus  much smaller than its fundamental niche. RESULTS CONCLUSION Ocean Ecologist Joseph Connell studied two barnacle species Balanus balanoides  and  Chthamalus stellatus  that have a stratified distribution on rocks along the coast of Scotland. EXPERIMENT In nature,  Balanus  fails to survive high on the rocks because it is unable to resist desiccation (drying out) during low tides. Its realized niche is therefore similar to its fundamental niche. In contrast,  Chthamalus  is usually concentrated on the upper strata of rocks. To determine the fundamental of niche of  Chthamalus,  Connell removed  Balanus  from the lower strata.  Low tide High tide Chthamalus fundamental niche Chthamalus realized niche Low tide High tide Chthamalus Balanus realized niche Balanus Ocean Figure 53.2
[object Object],[object Object]
Resource Partitioning ,[object Object],[object Object],A. insolitus usually perches on shady branches. A. distichus  perches on fence posts and other sunny surfaces. A. distichus A. ricordii A. insolitus A. christophei A. cybotes A. etheridgei A. alinigar Figure 53.3
Character Displacement ,[object Object],[object Object],G. fortis Beak depth (mm) G. fuliginosa Beak depth Los Hermanos Daphne Santa María, San Cristóbal Sympatric populations G. fuliginosa,  allopatric G. fortis,  allopatric Percentages of individuals in each size class 40 20 0 40 20 0 40 20 0 8 10 12 14 16 Figure 53.4
Predation ,[object Object],[object Object]
[object Object],[object Object],[object Object],[object Object]
[object Object],[object Object],Figure 53.5
[object Object],[object Object],Figure 53.6
[object Object],[object Object]
[object Object],[object Object],(a) Hawkmoth larva (b) Green parrot snake Figure 53.7a, b
[object Object],[object Object],(a) Cuckoo bee (b) Yellow jacket Figure 53.8a, b
Herbivory ,[object Object],[object Object]
Parasitism ,[object Object],[object Object]
[object Object],[object Object]
Disease ,[object Object],[object Object]
[object Object],[object Object]
Mutualism ,[object Object],[object Object],Figure 53.9
Commensalism ,[object Object],[object Object],Figure 53.10
[object Object],[object Object]
Interspecific Interactions and Adaptation ,[object Object],[object Object]
[object Object],[object Object]
[object Object],[object Object],[object Object]
Species Diversity ,[object Object],[object Object],[object Object]
[object Object],[object Object],[object Object],[object Object]
[object Object],[object Object],Community 1 A: 25% B: 25% C: 25% D: 25% Community 2 A: 80% B: 5% C: 5% D: 10% D C B A Figure 53.11
[object Object],[object Object]
Trophic Structure ,[object Object],[object Object],[object Object]
[object Object],[object Object],Quaternary consumers Tertiary consumers Secondary consumers Primary consumers Primary producers Carnivore Carnivore Carnivore Herbivore Plant Carnivore Carnivore Carnivore Zooplankton Phytoplankton A terrestrial food chain A marine food chain Figure 53.12
Food Webs ,[object Object],[object Object],Humans Baleen  whales Crab-eater seals Birds Fishes Squids Leopard seals Elephant  seals Smaller toothed  whales Sperm  whales Carnivorous  plankton Euphausids  (krill) Copepods Phyto- plankton Figure 53.13
[object Object],[object Object],Sea nettle Fish larvae Zooplankton Fish eggs Juvenile striped bass Figure 53.14
Limits on Food Chain Length ,[object Object],[object Object],[object Object],[object Object]
[object Object],[object Object]
[object Object],[object Object]
[object Object],[object Object],High (control) Medium Low Productivity No. of species No. of trophic links Number of species Number of trophic links  0 1 2 3 4 5 6 0 1 2 3 4 5 6 Figure 53.15
Species with a Large Impact ,[object Object],[object Object]
Dominant Species ,[object Object],[object Object],[object Object]
[object Object],[object Object],[object Object],[object Object]
Keystone Species ,[object Object],[object Object],[object Object]
[object Object],[object Object],Figure 53.16a,b (a)  The sea star  Pisaster ochraceous  feeds preferentially on mussels but will consume other invertebrates. With  Pisaster  (control) Without  Pisaster  (experimental) Number of species  present 0 5 10 15 20 1963 ´64 ´65 ´66 ´67 ´68 ´69 ´70 ´71 ´72 ´73 (b)  When  Pisaster  was removed from an intertidal zone, mussels eventually took over the rock face and eliminated most other invertebrates and algae. In a control area from which  Pisaster  was not removed, there was little change in species diversity.
[object Object],[object Object],Figure 53.17 Food chain before killer whale involve- ment in chain (a) Sea otter abundance (b) Sea urchin biomass (c) Total kelp density Number per 0.25 m 2 1972 1985 1989 1993 1997 0 2 4 6 8 10 0 100 200 300 400 Grams per 0.25 m 2 Otter number (% max. count) 0 40 20 60 80 100 Year Food chain after killer whales started preying on otters
Ecosystem “Engineers” (Foundation Species) ,[object Object],[object Object]
[object Object],[object Object],Figure 53.18
[object Object],[object Object],Figure 53.19 Salt marsh with  Juncus  (foreground) With  Juncus Without  Juncus Number of plant species 0 2 4 6 8 Conditions
Bottom-Up and Top-Down Controls ,[object Object],[object Object],[object Object],[object Object]
[object Object],[object Object],[object Object],[object Object]
[object Object],[object Object],Figure 53.20 0 100 200 300 400 Rainfall (mm) 0 25 50 75 100 Percentage of herbaceous plant cover
[object Object],[object Object],[object Object],[object Object],Fish Zooplankton Algae Abundant Rare Rare Abundant Abundant Rare Polluted State Restored  State
[object Object],[object Object],[object Object]
[object Object],[object Object]
What Is Disturbance? ,[object Object],[object Object],[object Object],[object Object]
[object Object],[object Object],[object Object],(a)   Before a controlled burn. A prairie that has not burned for several years has a high propor- tion of detritus (dead grass). (b)   During the burn.  The detritus  serves as fuel for fires. (c)   After the burn.  Approximately one month after the controlled burn, virtually all of the biomass in this prairie is living. Figure 53.21a–c
[object Object],[object Object]
[object Object],[object Object],Figure 53.22a, b (a)  Soon after fire.  As this photo taken soon after the fire shows, the burn left a patchy landscape. Note the unburned trees in the distance. (b)  One year after fire.  This photo of the same general area taken the following year indicates how rapidly the community began to recover. A variety of herbaceous plants, different from those in the former forest, cover the ground.
Human Disturbance ,[object Object],[object Object]
[object Object],[object Object],[object Object],[object Object]
Ecological Succession ,[object Object],[object Object]
[object Object],[object Object],[object Object],[object Object]
[object Object],[object Object],[object Object],[object Object]
[object Object],[object Object],Figure 53.23 McBride glacier retreating 0 5 10 Miles Glacier Bay Pleasant Is. Johns Hopkins Gl. Reid Gl. Grand Pacific Gl. Canada Alaska 1940 1912 1899 1879 1879 1949 1879 1935 1760 1780 1830 1860 1913 1911 1892 1900 1879 1907 1948 1931 1941 1948 Casement Gl. McBride Gl. Plateau Gl. Muir Gl. Riggs Gl.
[object Object],[object Object],Figure 53.24a–d (b)  Dryas  stage (c) Spruce stage (d) Nitrogen fixation by  Dryas  and alder  increases the soil nitrogen content.   Soil nitrogen (g/m 2 ) Successional stage Pioneer Dryas Alder Spruce 0 10 20 30 40 50 60 (a) Pioneer stage, with fireweed dominant
[object Object],[object Object],[object Object]
Equatorial-Polar Gradients ,[object Object],[object Object]
[object Object],[object Object],[object Object],[object Object]
[object Object],[object Object]
[object Object],[object Object],(b) Vertebrates 500 1,000 1,500 2,000 Potential evapotranspiration (mm/yr) 10 50 100 200 Vertebrate species richness (log scale) 1 100 300 500 700 900 1,100 180 160 140 120 100 80 60 40 20 0 Tree species richness (a) Trees Actual evapotranspiration (mm/yr) Figure 53.25a, b
Area Effects ,[object Object],[object Object]
[object Object],[object Object],Area (acres) 1 10 100 10 3 10 4 10 5 10 6 10 7 10 8 10 9 10 10 Number of species (log scale) 1 10 100 1,000 Figure 53.26
Island Equilibrium Model ,[object Object],[object Object]
[object Object],[object Object],Figure 53.27a–c Number of species on island (a) Immigration and extinction rates.  The equilibrium number of species on an island represents a balance between the immigration of new species and the extinction of species already there.  (b) Effect of island size.  Large islands may ultimately have a larger equilibrium num- ber of species than small islands because immigration rates tend to be higher and extinction rates lower on large islands. Number of species on island Number of species on island (c) Effect of distance from mainland.  Near islands tend to have larger equilibrium numbers of species than far islands because immigration rates to near islands are higher and extinction rates lower. Equilibrium number Small island Large island Far island Near island Immigration Extinction Extinction Immigration Extinction Immigration (small  island) (large  island) (large  island) (small  island) Immigration Extinction Immigration (far island) (near island) (near island) (far island) Extinction Rate of immigration or extinction Rate of immigration or extinction Rate of immigration or extinction
[object Object],[object Object],The results of the study showed that plant species richness increased with island size, supporting the species-area theory. FIELD STUDY RESULTS Ecologists Robert MacArthur and E. O. Wilson studied the number of plant species on the Galápagos Islands, which vary greatly in size, in relation to the area of each island. CONCLUSION 200 100 50 25 10 0 Area of island (mi 2 ) (log scale)  Number of plant species (log scale) 0.1 1 10 100 1,000 5 400 Figure 53.28
[object Object],[object Object],[object Object]
Integrated and Individualistic Hypotheses ,[object Object],[object Object]
[object Object],[object Object]
[object Object],[object Object],Population densities of individual species Environmental gradient (such as temperature or moisture)  (a) Integrated hypothesis.  Communities are discrete groupings of particular species that are closely interdependent and nearly always occur together. Figure 53.29a
[object Object],[object Object],Population densities of individual species  Environmental gradient (such as temperature or moisture)  (b) Individualistic hypothesis.  Species are independently distributed along gradients and a community is simply the assemblage of species that occupy the same area because of  similar abiotic needs.  Figure 53.29b
[object Object],[object Object],Number of plants per hectare Wet Moisture gradient  Dry (c) Trees in the Santa Catalina Mountains.  The   distribution of tree species at one elevation in the Santa Catalina Mountains of Arizona supports the individualistic hypothesis. Each tree species has an independent distribution along the gradient, apparently conforming to its tolerance for moisture, and the species that live together at any point along the gradient have similar physical requirements. Because the vegetation changes continuously along the gradient, it is impossible to delimit sharp boundaries for the communities. 0 200 400 600 Figure 53.29c
Rivet and Redundancy Models ,[object Object],[object Object],[object Object]
[object Object],[object Object]
[object Object],[object Object]
Chapter 54 Ecosystems
[object Object],[object Object],[object Object]
[object Object],[object Object],Figure 54.1
[object Object],[object Object],[object Object],[object Object]
[object Object],[object Object],[object Object]
Ecosystems and Physical Laws ,[object Object],[object Object],[object Object],[object Object]
Trophic Relationships ,[object Object],[object Object]
[object Object],[object Object],Figure 54.2 Microorganisms and other detritivores Detritus Primary producers Primary consumers Secondary consumers Tertiary  consumers Heat Sun Key Chemical cycling Energy flow
[object Object]
Decomposition ,[object Object],[object Object]
[object Object],[object Object],Figure 54.3
[object Object],[object Object],[object Object]
Ecosystem Energy Budgets ,[object Object],[object Object]
The Global Energy Budget ,[object Object],[object Object],[object Object],[object Object]
Gross and Net Primary Production ,[object Object],[object Object],[object Object],[object Object]
[object Object],[object Object],[object Object],[object Object]
[object Object],[object Object],(c) Lake and stream Open ocean Continental shelf Estuary Algal beds and reefs Upwelling zones Extreme desert, rock, sand, ice Desert and semidesert scrub Tropical rain forest Savanna Cultivated land Boreal forest (taiga) Temperate grassland Tundra Tropical seasonal forest Temperate deciduous forest Temperate evergreen forest Swamp and marsh Woodland and shrubland 0 10 20 30 40 50 60 0 500 1,000 1,500 2,000 2,500 0 5 10 15 20 25 Percentage of Earth’s net primary production Key Marine Freshwater (on continents) Terrestrial 5.2 0.3 0.1 0.1 4.7 3.5 3.3 2.9 2.7 2.4 1.8 1.7 1.6 1.5 1.3 1.0 0.4 0.4 125 360 1,500 2,500 500 3.0 90 2,200 900 600 800 600 700 140 1,600 1,200 1,300 2,000 250 5.6 1.2 0.9 0.1 0.04 0.9 22 7.9 9.1 9.6 5.4 3.5 0.6 7.1 4.9 3.8 2.3 0.3 65.0 24.4 Figure 54.4a–c Percentage of Earth’s surface area (a) Average net primary production (g/m 2 /yr) (b)
[object Object],[object Object],Figure 54.5 180 120W 60W 0 60E 120E 180 North Pole 60N 30N Equator 30S 60S South Pole
Primary Production in Marine and Freshwater Ecosystems ,[object Object],[object Object]
Light Limitation ,[object Object],[object Object]
Nutrient Limitation ,[object Object],[object Object]
[object Object],[object Object],[object Object],[object Object]
[object Object],[object Object],EXPERIMENT Pollution from duck farms concentrated near  Moriches Bay adds both nitrogen and phosphorus to the coastal water  off Long Island. Researchers cultured the phytoplankton Nannochloris  atomus with water collected from several bays. Figure 54.6 Coast of Long Island, New York.   The numbers on the map indicate  the data collection stations. Long Island Great South Bay Shinnecock  Bay Moriches Bay Atlantic Ocean 30 21 19 15 11 5 4 2
Figure 54.6 (a) Phytoplankton biomass and phosphorus concentration (b) Phytoplankton response to nutrient enrichment Great South Bay Moriches Bay Shinnecock Bay Starting algal density 2 4 5 11 30 15 19 21 30 24 18 12 6 0 Unenriched control Ammonium enriched Phosphate enriched Station number Phytoplankton (millions of cells per mL) 8 7 6 5 4 3 2 1 0 2 4 5 11 30 15 19 21 8 7 6 5 4 3 2 1 0 Inorganic phosphorus (g atoms/L) Phytoplankton (millions of cells/mL) Station number CONCLUSION Since adding phosphorus, which was already in rich supply, had no effect on  Nannochloris  growth, whereas adding nitrogen increased algal density dramatically, researchers  concluded that nitrogen was the nutrient limiting phytoplankton growth in this ecosystem. Phytoplankton Inorganic phosphorus RESULTS Phytoplankton abundance parallels the abundance of phosphorus in the water (a). Nitrogen, however, is immediately taken up by algae, and no free nitrogen is measured in the coastal waters. The addition of ammonium (NH 4  ) caused heavy phytoplankton growth in bay water, but the addition of phosphate (PO 4 3 ) did not induce algal growth (b).
[object Object],[object Object],Table 54.1
[object Object],[object Object]
[object Object],[object Object],Figure 54.7
Primary Production in Terrestrial and Wetland Ecosystems ,[object Object],[object Object]
[object Object],[object Object]
[object Object],[object Object],[object Object],Figure 54.8 Actual evapotranspiration (mm H 2 O/yr) Tropical forest Temperate forest Mountain coniferous forest Temperate grassland Arctic tundra Desert shrubland Net primary production (g/m 2 /yr) 1,000 2,000 3,000 0 500 1,000 1,500 0
[object Object],[object Object],Figure 54.9 EXPERIMENT Over the summer of 1980, researchers added  phosphorus to some experimental plots in the salt marsh, nitrogen to other plots, and both phosphorus and nitrogen to others. Some  plots were left unfertilized as controls.  RESULTS Experimental plots receiving just  phosphorus (P) do not outproduce  the unfertilized control plots. CONCLUSION Live, above-ground biomass (g dry wt/m 2 ) Adding nitrogen (N)  boosts net primary production. 300 250 200 150 100 50 0 June July August 1980 N  P N only Control P only These nutrient enrichment experiments  confirmed that nitrogen was the nutrient limiting plant growth in  this salt marsh.
[object Object],[object Object],[object Object]
Production Efficiency ,[object Object],[object Object],Figure 54.10 Plant material eaten by caterpillar Cellular respiration Growth (new biomass) Feces 100 J 33 J 200 J 67 J
[object Object],[object Object]
Trophic Efficiency and Ecological Pyramids ,[object Object],[object Object],[object Object]
Pyramids of Production ,[object Object],[object Object],Figure 54.11 Tertiary consumers Secondary consumers Primary consumers Primary producers 1,000,000 J of sunlight 10 J 100 J 1,000 J 10,000 J
Pyramids of Biomass ,[object Object],[object Object]
[object Object],[object Object],Figure 54.12a (a)  Most biomass pyramids show a sharp decrease in biomass at successively higher trophic levels, as illustrated by data from a bog at Silver Springs, Florida. Trophic level Dry weight (g/m 2 ) Primary producers Tertiary consumers Secondary consumers Primary consumers 1.5 11 37 809
[object Object],[object Object],Figire 54.12b Trophic level Primary producers (phytoplankton) Primary consumers (zooplankton) (b)  In some aquatic ecosystems, such as the English Channel,  a small standing crop of primary producers (phytoplankton) supports a larger standing crop of primary consumers (zooplankton). Dry weight (g/m 2 ) 21 4
Pyramids of Numbers ,[object Object],[object Object],Figure 54.13 Trophic level Number of  individual organisms Primary producers Tertiary consumers Secondary consumers Primary consumers 3 354,904 708,624 5,842,424
[object Object],[object Object],[object Object],[object Object]
[object Object],[object Object],Figure 54.14 Trophic level Secondary consumers Primary consumers Primary producers
The Green World Hypothesis ,[object Object],[object Object]
[object Object],[object Object],Figure 54.15
[object Object],[object Object],[object Object],[object Object],[object Object],[object Object]
[object Object],[object Object],[object Object],[object Object],[object Object]
A General Model of Chemical Cycling ,[object Object],[object Object],[object Object],[object Object]
[object Object],[object Object],Figure 54.16 Organic materials available as nutrients Living organisms, detritus Organic materials unavailable as nutrients Coal, oil, peat Inorganic materials available as nutrients Inorganic materials unavailable as nutrients Atmosphere, soil, water Minerals in rocks Formation of sedimentary rock  Weathering, erosion Respiration, decomposition, excretion Burning of fossil fuels Fossilization Reservoir a Reservoir b Reservoir c Reservoir d Assimilation,  photosynthesis
[object Object],[object Object]
Biogeochemical Cycles ,[object Object],Figure 54.17 Transport over land Solar energy Net movement of water vapor by wind Precipitation over ocean Evaporation from ocean Evapotranspiration from land Precipitation over land Percolation through soil Runoff and groundwater CO 2  in atmosphere Photosynthesis Cellular respiration Burning of fossil fuels and wood Higher-level consumers Primary consumers Detritus Carbon compounds in water Decomposition THE WATER CYCLE THE CARBON CYCLE
[object Object],[object Object],[object Object],[object Object]
[object Object],Figure 54.17 N 2  in atmosphere Denitrifying bacteria Nitrifying bacteria Nitrifying bacteria Nitrification Nitrogen-fixing soil bacteria Nitrogen-fixing bacteria in root nodules of legumes Decomposers Ammonification Assimilation NH 3 NH 4 + NO 3  NO 2   Rain Plants Consumption Decomposition Geologic uplift Weathering of rocks Runoff Sedimentation Plant uptake of PO 4 3 Soil Leaching THE NITROGEN CYCLE THE PHOSPHORUS CYCLE
[object Object],[object Object],[object Object],[object Object]
Decomposition and Nutrient Cycling Rates ,[object Object],[object Object],Figure 54.18 Consumers Producers Nutrients available to producers Abiotic reservoir Geologic processes Decomposers
[object Object],[object Object]
Vegetation and Nutrient Cycling: The Hubbard Brook Experimental Forest ,[object Object],[object Object]
[object Object],[object Object],[object Object],[object Object]
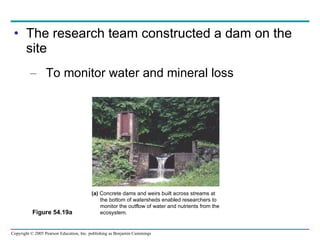
[object Object],[object Object],Figure 54.19a (a)  Concrete dams and weirs built across streams at  the bottom of watersheds enabled researchers to monitor the outflow of water and nutrients from the ecosystem.
[object Object],[object Object],Figure 54.19b (b)  One watershed was clear cut to study the effects of the loss of vegetation on drainage and nutrient cycling.
[object Object],[object Object],[object Object],[object Object],Figure 54.19c (c)  The concentration of nitrate in runoff from the deforested watershed was 60 times greater than in a control (unlogged) watershed. Nitrate concentration in runoff (mg/L) Deforested Control Completion of tree cutting 1965 1966 1967 1968 80.0 60.0 40.0 20.0 4.0 3.0 2.0 1.0 0
[object Object],[object Object],[object Object]
Nutrient Enrichment ,[object Object],[object Object]
Agriculture and Nitrogen Cycling ,[object Object],[object Object],Figure 54.20
[object Object],[object Object],[object Object],[object Object]
Contamination of Aquatic Ecosystems ,[object Object],[object Object]
[object Object],[object Object]
[object Object],[object Object]
Acid Precipitation ,[object Object],[object Object]
[object Object],[object Object],Figure 54.21 4.6 4.6 4.3 4.1 4.3 4.6 4.6 4.3 Europe North America
[object Object],[object Object],Figure 54.22 Field pH  5.3 5.2–5.3 5.1–5.2 5.0–5.1 4.9–5.0 4.8–4.9 4.7–4.8 4.6–4.7 4.5–4.6 4.4–4.5 4.3–4.4  4.3
[object Object],[object Object]
Toxins in the Environment ,[object Object],[object Object],[object Object],[object Object]
[object Object],[object Object],Figure 54.23 Concentration of PCBs Herring gull eggs 124 ppm Zooplankton  0.123 ppm Phytoplankton  0.025 ppm Lake trout  4.83 ppm Smelt  1.04 ppm
[object Object],[object Object]
Atmospheric Carbon Dioxide ,[object Object],[object Object]
Rising Atmospheric CO 2 ,[object Object],[object Object],Figure 54.24 CO 2  concentration (ppm) 390 380 370 360 350 340 330 320 310 300 1960 1965 1970 1975 1980 1985 1990 1995 2000 2005 1.05 0.90 0.75 0.60 0.45 0.30 0.15 0  0.15   0.30   0.45 Temperature variation (C) Temperature CO 2 Year
How Elevated CO 2  Affects Forest Ecology: The FACTS-I Experiment ,[object Object],[object Object],Figure 54.25
The Greenhouse Effect and Global Warming ,[object Object],[object Object]
[object Object],[object Object]
Depletion of Atmospheric Ozone ,[object Object],[object Object]
[object Object],[object Object],Figure 54.26 Ozone layer thickness (Dobson units) Year (Average for the month of October) 350 300 250 200 150 100 50 0 1955 1960 1965 1970 1975 1980 1985 1990 1995 2000 2005
[object Object],[object Object],Figure 54.27 1 2 3 Chlorine from CFCs interacts with ozone (O 3 ), forming chlorine monoxide (ClO) and  oxygen (O 2 ). Two ClO molecules  react, forming  chlorine peroxide (Cl 2 O 2 ). Sunlight causes  Cl 2 O 2  to break  down into O 2   and free  chlorine atoms.  The chlorine  atoms can begin  the cycle again. Sunlight Chlorine O 3 O 2 ClO ClO Cl 2 O 2 O 2 Chlorine atoms
[object Object],[object Object],Figure 54.28a, b (a) October 1979 (b) October 2000
Chapter 55 Conservation Biology and Restoration Ecology
[object Object],[object Object],[object Object],[object Object],[object Object],[object Object],[object Object],[object Object]
[object Object],[object Object]
[object Object],[object Object],[object Object],Figure 55.1
[object Object],[object Object]
[object Object],[object Object],[object Object],[object Object],[object Object],[object Object]
The Three Levels of Biodiversity ,[object Object],[object Object],[object Object],[object Object],Genetic diversity in a vole population Species diversity in a coastal redwood ecosystem Community and ecosystem diversity across the landscape of an entire region Figure 55.2
Genetic Diversity ,[object Object],[object Object],[object Object]
Species Diversity ,[object Object],[object Object]
[object Object],[object Object],[object Object],[object Object]
[object Object],[object Object]
[object Object],[object Object],(a) Philippine eagle (b) Chinese river    dolphin (c) Javan    rhinoceros Figure 55.3a–c
Ecosystem Diversity ,[object Object],[object Object],[object Object]
Biodiversity and Human Welfare ,[object Object],[object Object],[object Object],[object Object]
Benefits of Species and Genetic Diversity ,[object Object],[object Object],Figure 55.4
[object Object],[object Object],[object Object],[object Object]
Ecosystem Services ,[object Object],[object Object]
[object Object],[object Object],[object Object],[object Object],[object Object],[object Object]
Four Major Threats to Biodiversity ,[object Object],[object Object],[object Object],[object Object],[object Object]
Habitat Destruction ,[object Object],[object Object],[object Object],[object Object]
[object Object],[object Object],Figure 55.5
[object Object],[object Object]
Introduced Species ,[object Object],[object Object]
[object Object],[object Object],(a) Brown tree    snake, intro-   duced to Guam    in cargo (b) Introduced kudzu thriving in South Carolina Figure 55.6a, b
Overexploitation ,[object Object],[object Object]
[object Object],[object Object],Figure 55.7
Disruption of Interaction Networks ,[object Object],[object Object],Figure 55.8
[object Object],[object Object],[object Object]
Small-Population Approach ,[object Object],[object Object]
The Extinction Vortex ,[object Object],[object Object],Small population Inbreeding Genetic drift Lower  reproduction Higher  mortality Loss of genetic variability Reduction in individual fitness and population adaptability Smaller population Figure 55.9
[object Object],[object Object]
Case Study: The Greater Prairie Chicken and the Extinction Vortex ,[object Object],[object Object]
[object Object],[object Object]
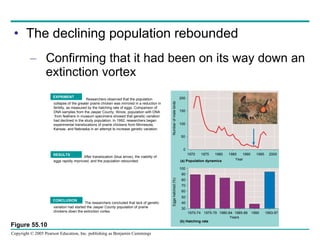
[object Object],[object Object],EXPRIMENT Researchers observed that the population  collapse of the greater prairie chicken was mirrored in a reduction in  fertility, as measured by the hatching rate of eggs. Comparison of  DNA samples from the Jasper County, Illinois, population with DNA  from feathers in museum specimens showed that genetic variation  had declined in the study population. In 1992, researchers began  experimental translocations of prairie chickens from Minnesota,  Kansas, and Nebraska in an attempt to increase genetic variation.  RESULTS After translocation (blue arrow), the viability of eggs rapidly improved, and the population rebounded. CONCLUSION The researchers concluded that lack of genetic   variation had started the Jasper County population of prairie  chickens down the extinction vortex. Number of male birds (a) Population dynamics (b) Hatching rate 200 150 100 50 0 1970 1975 1980 1985 1990 1995 2000 Year Eggs hatched (%) 100 90 80 70 60 50 40 30 1970-74 1975-79 1980-84 1985-89 1990 1993-97 Years Figure 55.10
Minimum Viable Population Size ,[object Object],[object Object]
[object Object],[object Object],[object Object]
Effective Population Size ,[object Object],[object Object]
Case Study: Analysis of Grizzly Bear Populations ,[object Object],[object Object],Figure 55.11
[object Object],[object Object],Number of individuals 150 100 50 0 1973 1982 1991 2000 Females with cubs Cubs Year Figure 55.12
Declining-Population Approach ,[object Object],[object Object],[object Object]
Steps for Analysis and Intervention ,[object Object],[object Object],[object Object]
Case Study: Decline of the Red-Cockaded Woodpecker ,[object Object],[object Object],[object Object],(a)  A red-cockaded woodpecker perches at the    entrance to its nest site in a longleaf pine. (b)  Forest that can    sustain red-cockaded    woodpeckers has    low undergrowth. (c)  Forest that cannot sustain red-cockaded    woodpeckers has high, dense undergrowth that    impacts the woodpeckers’ access to feeding grounds. Figure 55.13a–c
[object Object],[object Object],[object Object],[object Object]
Weighing Conflicting Demands ,[object Object],[object Object]
[object Object],[object Object],[object Object]
[object Object],[object Object]
Landscape Structure and Biodiversity ,[object Object],[object Object]
Fragmentation and Edges ,[object Object],[object Object],(a) Natural edges.  Grasslands give way to forest ecosystems in    Yellowstone National Park. (b) Edges created by human activity.  Pronounced edges (roads)    surround clear-cuts in this photograph of a heavily logged rain    forest in Malaysia. Figure 55.14a, b
[object Object],[object Object]
[object Object],[object Object],Figure 55.15
Corridors That Connect Habitat Fragments ,[object Object],[object Object]
[object Object],[object Object],Figure 55.16
[object Object],[object Object]
Establishing Protected Areas ,[object Object],[object Object]
[object Object],[object Object]
Finding Biodiversity Hot Spots ,[object Object],[object Object],Terrestrial  biodiversity  hot spots Equator Figure 55.17
[object Object],[object Object]
Philosophy of Nature Reserves ,[object Object],[object Object],[object Object],[object Object]
[object Object],[object Object],Biotic boundary for short-term survival; MVP is 50 individuals. Biotic boundary for long-term survival; MVP is 500 individuals. Grand Teton National Park Wyoming Idaho 43 42 41 40 0 50 100 Kilometers Snake R. Yellowstone National Park Shoshone R. Montana Wyoming Montana Idaho Madison R. Gallatin R. Yellowstone R. Figure 55.18
Zoned Reserves ,[object Object],[object Object]
[object Object],[object Object],(a)  Boundaries of the zoned reserves are indicated by black outlines. (b)  Local schoolchildren marvel at the diversity of life in one of    Costa Rica’s reserves. Nicaragua Costa Rica Panama National park land Buffer zone PACIFIC OCEAN CARIBBEAN SEA Figure 55.19a, b
[object Object],[object Object],Figure 55.20
[object Object],[object Object],[object Object]
[object Object],[object Object],Recovery time (years) (log scale) 10 4 1,000 100 10 1 10 3 10 2 10 1 1 10 100 1,000 10 4 Natural disasters Human-caused disasters Natural OR human- caused disasters Meteor strike Groundwater exploitation Industrial pollution Urbanization Salination Modern agriculture Flood Volcanic eruption Acid rain Forest fire Nuclear bomb Tsunami Oil spill Slash & burn Land- slide Tree fall Lightning strike Spatial scale (km 2 ) (log scale) Figure 55.21
[object Object],[object Object],[object Object],[object Object]
Bioremediation ,[object Object],[object Object]
Biological Augmentation ,[object Object],[object Object]
Exploring Restoration ,[object Object],[object Object]
[object Object],Truckee River, Nevada. Kissimmee River, Florida. Equator Figure 55.22
Tropical dry forest, Costa Rica. Succulent Karoo, South Africa. Rhine River, Europe. Coastal Japan. Figure 55.22
[object Object],[object Object],[object Object]
Sustainable Biosphere Initiative ,[object Object],[object Object]
Case Study: Sustainable Development in Costa Rica ,[object Object],[object Object]
[object Object],[object Object],Infant mortality (per 1,000 live births) 200 150 100 50 0 1900 1950 2000 80 70 60 50 40 30 Year Life expectancy Infant mortality Life expectancy (years) Figure 55.23
Biophilia and the Future of the Biosphere ,[object Object],[object Object],(a)  Detail of animals in a Paleolithic mural, Lascaux, France Figure 55.24a
[object Object],[object Object],(b)  Biologist Carlos Rivera Gonzales examining a tiny tree frog in    Peru Figure 55.24b
[object Object],[object Object]

More Related Content

What's hot

Community ecology
Community ecologyCommunity ecology
Community ecologyMegha Majoe
 
What, exactly, is a biotic interactions?
What, exactly, is a biotic interactions?What, exactly, is a biotic interactions?
What, exactly, is a biotic interactions?Bob O'Hara
 
factors influencing the structure of communities
factors influencing the structure of communitiesfactors influencing the structure of communities
factors influencing the structure of communitiesChristine Aubrey Brendia
 
ENVI 6 community ecology FINAL
ENVI 6  community ecology FINALENVI 6  community ecology FINAL
ENVI 6 community ecology FINALYhan Marianne
 
Community ecology
Community ecologyCommunity ecology
Community ecologyMrJewett
 
Unit2 Ecology Ic Communities
Unit2 Ecology Ic CommunitiesUnit2 Ecology Ic Communities
Unit2 Ecology Ic Communitiestnewberry
 
Biological Communities And Interaction
Biological Communities And  InteractionBiological Communities And  Interaction
Biological Communities And InteractionGeonyzl Alviola
 
Population Interaction.pdf
Population Interaction.pdfPopulation Interaction.pdf
Population Interaction.pdfRavikant10489
 
disturbance and diversity in Temperate Grassland
disturbance and diversity in Temperate Grasslanddisturbance and diversity in Temperate Grassland
disturbance and diversity in Temperate GrasslandAivy Claire Vios
 
Ecological niche
Ecological nicheEcological niche
Ecological nicheDavid Rowel
 
Species interactions
Species interactionsSpecies interactions
Species interactionsilo0lo0
 
Chapter 13: Species Interaction, Population Dynamics and Natural Selection
Chapter 13: Species Interaction, Population Dynamics and Natural SelectionChapter 13: Species Interaction, Population Dynamics and Natural Selection
Chapter 13: Species Interaction, Population Dynamics and Natural SelectionEdgie Tadena
 

What's hot (20)

Biology 205 8
Biology 205 8Biology 205 8
Biology 205 8
 
Community ecology
Community ecologyCommunity ecology
Community ecology
 
Ecology Community
Ecology  CommunityEcology  Community
Ecology Community
 
Carrying Capacity
Carrying CapacityCarrying Capacity
Carrying Capacity
 
Biology 205 11
Biology 205 11Biology 205 11
Biology 205 11
 
What, exactly, is a biotic interactions?
What, exactly, is a biotic interactions?What, exactly, is a biotic interactions?
What, exactly, is a biotic interactions?
 
factors influencing the structure of communities
factors influencing the structure of communitiesfactors influencing the structure of communities
factors influencing the structure of communities
 
Chapter 6 7 ecology
Chapter 6 7 ecologyChapter 6 7 ecology
Chapter 6 7 ecology
 
ENVI 6 community ecology FINAL
ENVI 6  community ecology FINALENVI 6  community ecology FINAL
ENVI 6 community ecology FINAL
 
Community ecology
Community ecologyCommunity ecology
Community ecology
 
Community Ecology
Community EcologyCommunity Ecology
Community Ecology
 
Community Ecology
Community EcologyCommunity Ecology
Community Ecology
 
Unit2 Ecology Ic Communities
Unit2 Ecology Ic CommunitiesUnit2 Ecology Ic Communities
Unit2 Ecology Ic Communities
 
Biological Communities And Interaction
Biological Communities And  InteractionBiological Communities And  Interaction
Biological Communities And Interaction
 
Species interaction
Species interactionSpecies interaction
Species interaction
 
Population Interaction.pdf
Population Interaction.pdfPopulation Interaction.pdf
Population Interaction.pdf
 
disturbance and diversity in Temperate Grassland
disturbance and diversity in Temperate Grasslanddisturbance and diversity in Temperate Grassland
disturbance and diversity in Temperate Grassland
 
Ecological niche
Ecological nicheEcological niche
Ecological niche
 
Species interactions
Species interactionsSpecies interactions
Species interactions
 
Chapter 13: Species Interaction, Population Dynamics and Natural Selection
Chapter 13: Species Interaction, Population Dynamics and Natural SelectionChapter 13: Species Interaction, Population Dynamics and Natural Selection
Chapter 13: Species Interaction, Population Dynamics and Natural Selection
 

Viewers also liked (20)

27 prokaryotes text
27  prokaryotes text27  prokaryotes text
27 prokaryotes text
 
Somatic.specialsenses
Somatic.specialsensesSomatic.specialsenses
Somatic.specialsenses
 
31 fungi text
31  fungi text31  fungi text
31 fungi text
 
23 evolutionofpopulations text
23  evolutionofpopulations text23  evolutionofpopulations text
23 evolutionofpopulations text
 
Hoofdstuk 20 2008 deel 2
Hoofdstuk 20 2008 deel 2Hoofdstuk 20 2008 deel 2
Hoofdstuk 20 2008 deel 2
 
22 darwin text
22  darwin text22  darwin text
22 darwin text
 
10 photosynthesis text
10  photosynthesis text10  photosynthesis text
10 photosynthesis text
 
29 plants ii text
29  plants ii text29  plants ii text
29 plants ii text
 
35 plantstructure text
35  plantstructure text35  plantstructure text
35 plantstructure text
 
51 behavior text
51 behavior text51 behavior text
51 behavior text
 
09 cellrespiration text
09  cellrespiration text09  cellrespiration text
09 cellrespiration text
 
Skeletalsystem
SkeletalsystemSkeletalsystem
Skeletalsystem
 
14 mendel text
14  mendel text14  mendel text
14 mendel text
 
12 cellcycle text
12  cellcycle text12  cellcycle text
12 cellcycle text
 
Nervoussystem
NervoussystemNervoussystem
Nervoussystem
 
Prokaryotic eukaryoticgenome
Prokaryotic eukaryoticgenomeProkaryotic eukaryoticgenome
Prokaryotic eukaryoticgenome
 
32 animaldiversity text
32  animaldiversity text32  animaldiversity text
32 animaldiversity text
 
Genomics lecture 3
Genomics lecture 3Genomics lecture 3
Genomics lecture 3
 
41 animalnutrition text
41  animalnutrition text41  animalnutrition text
41 animalnutrition text
 
Dn atechn genomics-developmemt
Dn atechn genomics-developmemtDn atechn genomics-developmemt
Dn atechn genomics-developmemt
 

Similar to 53 communities text

Chapter 55
Chapter 55Chapter 55
Chapter 55sojhk
 
Science 10 - Chapter2
Science 10 - Chapter2Science 10 - Chapter2
Science 10 - Chapter2earland
 
Community Interactions And Sucession
Community Interactions And SucessionCommunity Interactions And Sucession
Community Interactions And SucessionMaria Donohue
 
Biological interactions
Biological interactionsBiological interactions
Biological interactionsShariqaJan
 
06 ecol inter
06 ecol inter06 ecol inter
06 ecol interdompiazza
 
4.2 -- BIO
4.2 -- BIO4.2 -- BIO
4.2 -- BIOheyylo
 
34 .Community ecology A Presentation By Mr Allah Dad Khan
34 .Community ecology   A Presentation By Mr Allah Dad Khan 34 .Community ecology   A Presentation By Mr Allah Dad Khan
34 .Community ecology A Presentation By Mr Allah Dad Khan Mr.Allah Dad Khan
 
GOOD COPY individual paper, St. Andrews Field Course
GOOD COPY individual paper, St. Andrews Field CourseGOOD COPY individual paper, St. Andrews Field Course
GOOD COPY individual paper, St. Andrews Field CourseRachel Brodie
 
Topic 3.1. An introduction to Biodiversity
Topic 3.1. An introduction to Biodiversity Topic 3.1. An introduction to Biodiversity
Topic 3.1. An introduction to Biodiversity Miltiadis Kitsos
 
Chapter 2 - Ecosystems - Science 10E
Chapter 2 - Ecosystems - Science 10EChapter 2 - Ecosystems - Science 10E
Chapter 2 - Ecosystems - Science 10EReitmans
 
Chapt03 Lecture
Chapt03 LectureChapt03 Lecture
Chapt03 Lecturerpieper
 
Biotic and Abiotic Factors
Biotic and Abiotic FactorsBiotic and Abiotic Factors
Biotic and Abiotic FactorsOhMiss
 

Similar to 53 communities text (20)

Chapter 55
Chapter 55Chapter 55
Chapter 55
 
Community Ecology
Community EcologyCommunity Ecology
Community Ecology
 
Chapt04 lecture
Chapt04 lectureChapt04 lecture
Chapt04 lecture
 
38 Lecture Ppt
38 Lecture Ppt38 Lecture Ppt
38 Lecture Ppt
 
Science 10 - Chapter2
Science 10 - Chapter2Science 10 - Chapter2
Science 10 - Chapter2
 
Community Interactions And Sucession
Community Interactions And SucessionCommunity Interactions And Sucession
Community Interactions And Sucession
 
Biotic Interactions
Biotic InteractionsBiotic Interactions
Biotic Interactions
 
Biological interactions
Biological interactionsBiological interactions
Biological interactions
 
06 ecol inter
06 ecol inter06 ecol inter
06 ecol inter
 
B10vrv2042
B10vrv2042B10vrv2042
B10vrv2042
 
Community interactions
Community interactions Community interactions
Community interactions
 
4.2 -- BIO
4.2 -- BIO4.2 -- BIO
4.2 -- BIO
 
The Biosphere
The BiosphereThe Biosphere
The Biosphere
 
34 .Community ecology A Presentation By Mr Allah Dad Khan
34 .Community ecology   A Presentation By Mr Allah Dad Khan 34 .Community ecology   A Presentation By Mr Allah Dad Khan
34 .Community ecology A Presentation By Mr Allah Dad Khan
 
GOOD COPY individual paper, St. Andrews Field Course
GOOD COPY individual paper, St. Andrews Field CourseGOOD COPY individual paper, St. Andrews Field Course
GOOD COPY individual paper, St. Andrews Field Course
 
Topic 3.1. An introduction to Biodiversity
Topic 3.1. An introduction to Biodiversity Topic 3.1. An introduction to Biodiversity
Topic 3.1. An introduction to Biodiversity
 
Chapter 2 - Ecosystems - Science 10E
Chapter 2 - Ecosystems - Science 10EChapter 2 - Ecosystems - Science 10E
Chapter 2 - Ecosystems - Science 10E
 
Chapter2
Chapter2Chapter2
Chapter2
 
Chapt03 Lecture
Chapt03 LectureChapt03 Lecture
Chapt03 Lecture
 
Biotic and Abiotic Factors
Biotic and Abiotic FactorsBiotic and Abiotic Factors
Biotic and Abiotic Factors
 

More from Andrew McCaskill (13)

Human reproduction and development
Human reproduction and developmentHuman reproduction and development
Human reproduction and development
 
Digestive system
Digestive systemDigestive system
Digestive system
 
Respiratory syst
Respiratory systRespiratory syst
Respiratory syst
 
Cardiovascular system
Cardiovascular systemCardiovascular system
Cardiovascular system
 
37 plantnutrition text
37 plantnutrition text37 plantnutrition text
37 plantnutrition text
 
48 nervous text
48 nervous text48 nervous text
48 nervous text
 
46 reproduction text
46 reproduction text46 reproduction text
46 reproduction text
 
44 excretion text
44 excretion text44 excretion text
44 excretion text
 
40 animalform&function text
40 animalform&function text40 animalform&function text
40 animalform&function text
 
28 protists
28  protists28  protists
28 protists
 
24 originofspecies text
24  originofspecies text24  originofspecies text
24 originofspecies text
 
Muscle system
Muscle systemMuscle system
Muscle system
 
Dn ato protein
Dn ato proteinDn ato protein
Dn ato protein
 

53 communities text

  • 1.
  • 2.
  • 3.
  • 4.
  • 5.
  • 6.
  • 7.
  • 8.
  • 9.
  • 10.
  • 11.
  • 12.
  • 13.
  • 14.
  • 15.
  • 16.
  • 17.
  • 18.
  • 19.
  • 20.
  • 21.
  • 22.
  • 23.
  • 24.
  • 25.
  • 26.
  • 27.
  • 28.
  • 29.
  • 30.
  • 31.
  • 32.
  • 33.
  • 34.
  • 35.
  • 36.
  • 37.
  • 38.
  • 39.
  • 40.
  • 41.
  • 42.
  • 43.
  • 44.
  • 45.
  • 46.
  • 47.
  • 48.
  • 49.
  • 50.
  • 51.
  • 52.
  • 53.
  • 54.
  • 55.
  • 56.
  • 57.
  • 58.
  • 59.
  • 60.
  • 61.
  • 62.
  • 63.
  • 64.
  • 65.
  • 66.
  • 67.
  • 68.
  • 69.
  • 70.
  • 71.
  • 72.
  • 73.
  • 74.
  • 75.
  • 76.
  • 77.
  • 78.
  • 79.
  • 80.
  • 81.
  • 82.
  • 83.
  • 84.
  • 85.
  • 86.
  • 87.
  • 89.
  • 90.
  • 91.
  • 92.
  • 93.
  • 94.
  • 95.
  • 96.
  • 97.
  • 98.
  • 99.
  • 100.
  • 101.
  • 102.
  • 103.
  • 104.
  • 105.
  • 106.
  • 107.
  • 108.
  • 109.
  • 110.
  • 111. Figure 54.6 (a) Phytoplankton biomass and phosphorus concentration (b) Phytoplankton response to nutrient enrichment Great South Bay Moriches Bay Shinnecock Bay Starting algal density 2 4 5 11 30 15 19 21 30 24 18 12 6 0 Unenriched control Ammonium enriched Phosphate enriched Station number Phytoplankton (millions of cells per mL) 8 7 6 5 4 3 2 1 0 2 4 5 11 30 15 19 21 8 7 6 5 4 3 2 1 0 Inorganic phosphorus (g atoms/L) Phytoplankton (millions of cells/mL) Station number CONCLUSION Since adding phosphorus, which was already in rich supply, had no effect on Nannochloris growth, whereas adding nitrogen increased algal density dramatically, researchers concluded that nitrogen was the nutrient limiting phytoplankton growth in this ecosystem. Phytoplankton Inorganic phosphorus RESULTS Phytoplankton abundance parallels the abundance of phosphorus in the water (a). Nitrogen, however, is immediately taken up by algae, and no free nitrogen is measured in the coastal waters. The addition of ammonium (NH 4  ) caused heavy phytoplankton growth in bay water, but the addition of phosphate (PO 4 3 ) did not induce algal growth (b).
  • 112.
  • 113.
  • 114.
  • 115.
  • 116.
  • 117.
  • 118.
  • 119.
  • 120.
  • 121.
  • 122.
  • 123.
  • 124.
  • 125.
  • 126.
  • 127.
  • 128.
  • 129.
  • 130.
  • 131.
  • 132.
  • 133.
  • 134.
  • 135.
  • 136.
  • 137.
  • 138.
  • 139.
  • 140.
  • 141.
  • 142.
  • 143.
  • 144.
  • 145.
  • 146.
  • 147.
  • 148.
  • 149.
  • 150.
  • 151.
  • 152.
  • 153.
  • 154.
  • 155.
  • 156.
  • 157.
  • 158.
  • 159.
  • 160.
  • 161.
  • 162.
  • 163.
  • 164.
  • 165.
  • 166.
  • 167.
  • 168.
  • 169.
  • 170.
  • 171. Chapter 55 Conservation Biology and Restoration Ecology
  • 172.
  • 173.
  • 174.
  • 175.
  • 176.
  • 177.
  • 178.
  • 179.
  • 180.
  • 181.
  • 182.
  • 183.
  • 184.
  • 185.
  • 186.
  • 187.
  • 188.
  • 189.
  • 190.
  • 191.
  • 192.
  • 193.
  • 194.
  • 195.
  • 196.
  • 197.
  • 198.
  • 199.
  • 200.
  • 201.
  • 202.
  • 203.
  • 204.
  • 205.
  • 206.
  • 207.
  • 208.
  • 209.
  • 210.
  • 211.
  • 212.
  • 213.
  • 214.
  • 215.
  • 216.
  • 217.
  • 218.
  • 219.
  • 220.
  • 221.
  • 222.
  • 223.
  • 224.
  • 225.
  • 226.
  • 227.
  • 228.
  • 229.
  • 230.
  • 231.
  • 232.
  • 233.
  • 234.
  • 235.
  • 236.
  • 237.
  • 238.
  • 239.
  • 240. Tropical dry forest, Costa Rica. Succulent Karoo, South Africa. Rhine River, Europe. Coastal Japan. Figure 55.22
  • 241.
  • 242.
  • 243.
  • 244.
  • 245.
  • 246.
  • 247.