Downloaded 23 times

![Single-Photon Emission Computed Tomography, Positron Emission Tomography, and Hybrid Imaging 57
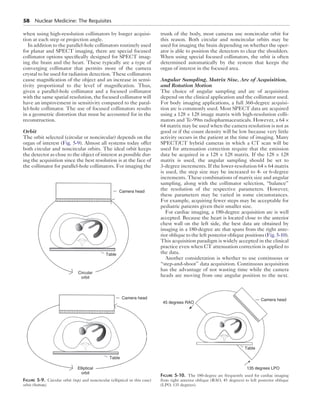
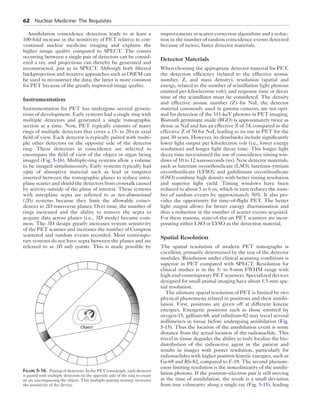
detector heads. Dual head systems that allow flexibility in
configuration between the heads are very popular. For
body imaging, the heads are typically arrayed parallel to
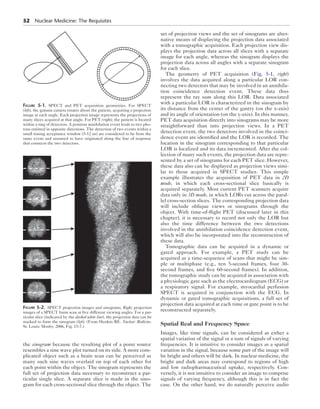
each other; for cardiac imaging they are often placed at
right angles (Fig. 5-8). Some cameras are permanently con-figured
in the 90-degree position for dedicated cardiac
imaging. Multiple heads are desirable because they allow
more data to be collected in a given period. Rotational
SPECT is photon poor compared to x-ray CT, and thus
SPECT imaging protocols commonly take 10 to 30 min-utes
for acquisition of a data set. Therefore it is desirable
to obtain as many counts as possible while completing the
imaging within a reasonable time to limit the effects of
patient motion and to minimize pharmacokinetic changes
during the imaging time. Rotational SPECT has high-lighted
the need to improve every aspect of gamma cam-era
system performance. Flood field nonuniformities are
translated as major artifacts in tomographic images because
they distort the data obtained from each view or projec-tion.
Desirable planar characteristics of a camera to be
used for SPECT are an intrinsic spatial resolution of 3.5
mm (as estimated by the full-width at half-maximum
[FWHM]), linearity distortion of 1 mm or less, and cor-rected
integral uniformity within 3%. All contemporary
rotational SPECT systems have online energy and unifor-mity
correction, as described in Chapter 4.
Dedicated Cardiac Single-Photon Emission
Computed Tomography Systems
Recently, dedicated SPECT systems have been devel-oped
for cardiac imaging only. These cameras may use
Anger logic for event positioning; however, they are dis-tinctly
different in that they are not large, single-crystal
detectors as are found in the traditional gamma camera
and many use solid-state detectors of cadmium zinc tellu-ride
(CZT) rather than NaI scintillating material. These
detectors often use a pixelated design with detector ele-ments
approximately 2 × 2 mm. Because of their multi-crystal
design, the scintillation-based systems often use
either position-sensitive photomultiplier tubes or photodi-odes
for light detection. The systems that use CZT have
higher intrinsic efficiency and enhanced energy resolution
(6% at 140 keV compared to 9%-11% compared to NaI).
This allows for the reduction of Compton scatter in the
images and may also enhance the ability to perform dual
isotope acquisitions (e.g., technetium-99m and iodine-123).
Finally, the detectors in these systems have physical design
characteristics that improve sensitivity. For instance, mul-tiple
detectors or pinhole apertures may be viewing the
heart simultaneously. These improvements in sensitivity
can be used to shorten the acquisition time or lower the
quantity of injected radioactivity and thereby lower the
patient’s radiation dose. Each system has different design
characteristics, acquisition procedures, and quality control
methods. Although these devices are promising, their use
remains quite limited; therefore the rest of this section will
focus on the rotating camera.
Image Acquisition
Box 5-1 summarizes factors that must be considered in
performing SPECT with a rotating gamma camera. In
addition to the calibrations described earlier and standard
gamma camera quality control, careful attention to each of
these factors will result in the high-quality SPECT images.
Collimator Selection
Although collimator selection is generally limited to those
supplied by the manufacturer, the specific choice depends
on the clinical imaging task at hand. For a given septal
thickness and hole diameter, collimators with longer chan-nels
provide better resolution but at a cost of lower sensi-tivity.
However, even though SPECT is relatively photon
poor, collimator selection should favor high resolution over
high sensitivity when possible because high-resolution
collimators provide improved image quality compared to
high-sensitivity or general-purpose collimators, even with
fewer counts. The use of multihead SPECT systems
allows the operator to gain back some of the counts lost
Two camera heads
180 degrees apart
(parallel)
Gantry
Two camera
heads
90 degrees apart
(perpendicular)
Figure 5-8. Two configurations for a dual-detector SPECT system.
Box 5-1. Image Acquisition Issues for Single-Photon
Emission Computed Tomography
Collimator selection
Orbit
Matrix size
Angular increment: number of views
180- vs. 360-degree rotation
Time per view
Total examination time](https://image.slidesharecdn.com/5spectpethybridimaging-141117030124-conversion-gate02/85/5-spect-pet-hybrid-imaging-7-320.jpg)
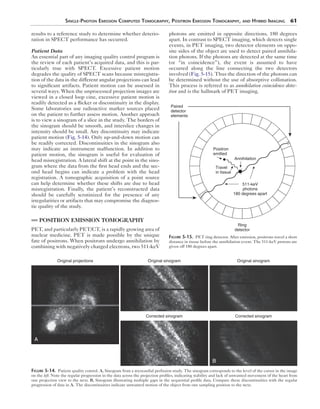


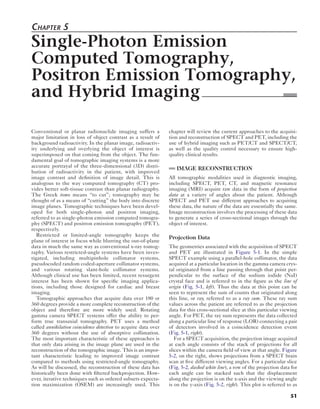
This document discusses tomographic imaging techniques used in nuclear medicine, specifically single-photon emission computed tomography (SPECT) and positron emission tomography (PET). It describes how these modalities acquire projection data at different angles around the patient, which is then reconstructed into cross-sectional images. Filtered backprojection is the most common reconstruction method, though iterative techniques are increasingly used due to producing images with less noise and artifacts. The document focuses on the geometry of data acquisition, representation of projection data as sinograms, and image reconstruction methods.


![Pet appilcation[1]](https://cdn.slidesharecdn.com/ss_thumbnails/petappilcation1-191002015502-thumbnail.jpg?width=640&height=640&fit=bounds)


![[2] Computed Tomography (CT) Imaging v2.pdf](https://cdn.slidesharecdn.com/ss_thumbnails/2computedtomographyctimagingv2-230209025240-a90f9bac-thumbnail.jpg?width=640&height=640&fit=bounds)


![Hypothalamus short ppt by Dr. Neha [PT].pptx](https://cdn.slidesharecdn.com/ss_thumbnails/hypothalamusbydr-260124145759-b9f94a93-thumbnail.jpg?width=640&height=640&fit=bounds)


