Toll Brothers reported record results for the third quarter of 2001, with net income growing 60% over the prior year quarter to $59.4 million. Revenues increased 26% to $584.1 million. Contracts rose 2% to a record $542.8 million, extending their streak of year-over-year quarterly records to 42 quarters. Backlog increased 8% to $1.58 billion. The company entered its 21st state of Colorado this quarter. Despite delays opening some new communities, Toll Brothers expects to have approximately 160 communities open by the end of fiscal year 2002, up from 142 currently. With over 38,000 lots in its pipeline, Toll Brothers is well positioned to benefit from ongoing demand
Toll Brothers, Inc. reported record financial results for the second quarter and first six months of fiscal year 2001, with significant increases in net income, revenues, contracts, and backlog compared to the same periods last year. The company noted continued strong demand for luxury homes driven by favorable demographics and limited housing supply. Toll Brothers expressed cautious optimism about achieving further record results in 2001 and 2002 based on current demand trends, its large backlog, and plans to increase its number of selling communities.
Toll Brothers had a record first quarter in fiscal year 2000, with earnings of $22.4 million, up 28% from the previous year. Revenues were $344.6 million, a 26% increase, driven by delivering 799 homes generating $334.2 million in revenues. New contracts signed were $391.6 million, up 27% from the previous year, and backlog reached a record high of $1.122 billion, up 31% from the previous year. Toll Brothers attributes the strong results to favorable demographics of move-up buyers and empty nesters, price increases implemented in 1999, and strategic expansion into new markets and product lines such as active adult communities.
Toll Brothers reported record third quarter earnings and revenues. Earnings were up 24% over the previous year's third quarter and revenues were up 15%. The company has a backlog of $1.47 billion, which is 34% higher than the previous year. Toll Brothers operates over 140 communities across 20 states and is expanding further in New England.
Toll Brothers had another record quarter, with earnings up 27% to $28.0 million. Revenues increased 14% to $390.5 million. Signed contracts reached a record $649.9 million, up 26%, and backlog set a new high of $1.39 billion, up 29%. For the first six months, earnings grew 27% to a record $50.3 million on a 19% revenue increase to $735.0 million, with signed contracts at a record $1.04 billion. Toll Brothers continues to expand geographically and through strategic investments in land and telecommunications ventures to capitalize on growth opportunities.
Toll Brothers had a very successful first quarter of 2002, with record earnings, revenues, and contracts. Net income increased 11% to $44.5 million, revenues grew 4% to $492.2 million, and signed contracts rose 8% to $485.2 million. The large backlog of $1.41 billion positions Toll Brothers for strong deliveries and growth. Demand remains healthy across their luxury home markets. Toll Brothers expects full year 2003 to be a record year with over $2.5 billion in revenues and $6 per share or more in earnings, driven by their expanding community count and favorable demographics of their customer base.
This document is Lincoln National Corporation's Form 10-Q filing for the quarterly period ended March 31, 2008. It provides an overview of the company's financial position, including its assets, liabilities, revenues, and stockholders' equity. Some key details are that the company had total assets of $185.3 billion, total liabilities of $174.3 billion, and total stockholders' equity of $11.1 billion. For the three month period ended March 31, 2008, the company reported total revenues of $2.4 billion.
The annual report summarizes Perini Corporation's financial performance and operations in 2004. Some key points:
- Revenues increased 34% to $1.84 billion, with strong growth in building and management services revenues. Income from construction operations rose 65% to $50.3 million.
- Perini was named one of Forbes' Best Managed Companies in America and ranked #1 in the construction sector. It also acquired Cherry Hill Construction to expand its civil construction business.
- Perini's management services division continued work on critical overseas projects in Iraq and Afghanistan, including completing the first new power plant in Iraq since 1976.
- Looking ahead, Perini expects continued growth from its core building
- Amerada Hess Corporation reported record net income of $1.2 billion in 2005, up from $970 million in 2004.
- Exploration and Production had significant progress in major field developments and grew proved reserves to 1.1 billion barrels of oil equivalent.
- Marketing and Refining benefited from strong refining margins and retail marketing experienced solid growth, with average gasoline volumes per station increasing 7% and convenience store revenue rising 4%.
First Financial Bankshares reported higher first quarter earnings compared to the same period last year. Net interest income increased 7% and the net interest margin rose to 4.76% from 4.58% a year ago. Noninterest income declined due to lower trust and service charge fees, partly offset by higher gains on the sale of student loans. Nonperforming assets increased to 95 basis points of loans and foreclosed assets but remain below peer banks.
- DTE Energy is an energy company headquartered in Detroit, Michigan. It owns Detroit Edison, an electric utility, and MichCon, a natural gas utility.
- In 2007, DTE Energy reported total assets of $23.9 billion, total debt of $6.6 billion, and total shareholders' equity of $5.9 billion.
- For Detroit Edison, electric sales increased 1% in 2007 compared to 2006, while revenues increased 4%. Residential sales and revenues increased the most at 2% and 4% respectively.
- Price Group Inc. filed its quarterly report for the period ending March 31, 2009.
- Total revenues for Q1 2009 were $385.7 million, down from $560.4 million in Q1 2008, due to lower investment advisory fees from lower assets under management.
- Net income for Q1 2009 was $48.2 million, down from $151.5 million in Q1 2008, as a result of lower revenues and non-operating investment losses of $36 million.
- Assets under management totaled $268.8 billion on March 31, 2009, down from $378.9 billion on March 31, 2008, contributing to lower investment advisory fees.
Form 1041-N U.S. Income Tax Return for Electing Alaska Native Settlement Tru...taxman taxman
This document is an IRS Form 1041-N for an Electing Alaska Native Settlement Trust. It provides general information about the trust, including the name and address of the trustee. It also includes sections to report the trust's income, deductions, tax computation, capital gains and losses, and distributions made to beneficiaries.
This document is Lincoln National Corporation's quarterly report filed with the SEC for the quarter ended September 30, 2008. It includes Lincoln National's consolidated balance sheets, statements of income, statements of stockholders' equity, and statements of cash flows for the periods ended September 30, 2008 and 2007. The highlights are that Lincoln National reported net income of $148 million for the quarter and $562 million for the nine months ended September 30, 2008, with total assets of $173.3 billion and total stockholders' equity of $9.5 billion as of September 30, 2008.
Expeditors International of Washington, 4th99qerfinance39
Expeditors International of Washington announced record quarterly and annual financial results for 1999. Key highlights include:
- Quarterly net earnings increased 33% to $18.6 million compared to $13.9 million in the prior year. Diluted EPS increased 31% to $0.34.
- For the full year, net earnings increased 25% to $59.2 million and diluted EPS increased 24% to $1.10.
- Revenues increased across all business segments for the quarter and full year, with total revenues up 37% and 36% respectively.
- The company's CEO attributed the strong results to fundamentals and dedication to providing world-class customer service.
- Caterpillar Financial Services Corporation filed a Form 10-Q for the quarterly period ended September 30, 2012 with the SEC.
- For the quarter, Caterpillar Financial Services reported a profit of $109 million on total revenues of $678 million.
- For the first nine months of the year, Caterpillar Financial Services reported a profit of $333 million on total revenues of $2.014 billion.
STATE FARM INSURANCE 2007 State Farm® Annual Reportfinance4
State Farm Mutual Automobile Insurance Company reduced auto insurance rates for the fourth straight year in 2007 despite higher vehicle operating costs. While underwriting profits dropped, improved investment income partly offset this. The company was also able to hold down operating expenses even while paying out $1.4 billion more in claims. Policies in force grew over 900,000 to nearly 42 million, and the company maintained its top financial strength rating from A.M. Best of A++.
- The document provides financial information for DTE Energy Company and its subsidiaries Detroit Edison and MichCon for the third quarter of 2007, including statements of financial position, cash flows, and operations.
- Key details include total assets of $23.8 billion, total debt of $6.8 billion or 53% of total capitalization, and operating revenues of $1.2 billion for Detroit Edison and $1.3 billion for MichCon.
- Electric sales decreased 1% while gas sales increased for Detroit Edison and MichCon respectively, compared to the same quarter in 2006.
constellation energy 2007 First Quarter Form 10-Q finance12
This document is a Form 10-Q quarterly report filed by Constellation Energy Group Inc. with the SEC for the quarter ending March 31, 2007. It includes unaudited financial statements for Constellation Energy and its subsidiary Baltimore Gas and Electric. It discusses revenues, expenses, assets, liabilities, regulatory developments, legal proceedings, and risks for the company in the quarter. The report is signed by the company's CEO and CFO and includes certifications by them regarding the financial statements and internal controls.
This document is Lincoln National Corporation's Form 10-Q quarterly report filed with the SEC for the quarter ended June 30, 2008. It includes Lincoln National's consolidated balance sheets, statements of income, statements of stockholders' equity, and statements of cash flows for the periods ended June 30, 2008 and 2007. The report provides key financial information on Lincoln National's revenues, expenses, assets, liabilities, and stockholders' equity. It also includes notes to the consolidated financial statements.
Expeditors International of Washington, 3rd01qerfinance39
- Expeditors International of Washington reported a 7% increase in net earnings for Q3 2001 compared to Q3 2000, reaching a record quarterly net of $27.4 million.
- Net revenues increased 4% for Q3 2001 while total revenues decreased 10% and operating income increased 6% compared to the same period last year.
- For the first nine months of 2001, net earnings increased 23% year-over-year, with net revenues up 14% and operating income rising 19%.
United Stationers Inc. reconciles non-GAAP financial measures for adjusted cash flow for the first quarter of 2008 and 2007. Net cash used in operating activities was $17.8 million in 2008 but excludes $63 million for accounts receivable sold, bringing the adjusted figure to $45.2 million in net cash provided. For financing activities, net cash provided was $24.8 million but includes the $63 million change in receivables sold, making the adjusted amount $38.2 million in net cash used. The note explains that changes in receivables sold are considered financing activities internally rather than operating cash flows.
- Third quarter 2004 was the best quarter in Toll Brothers' history for key financial metrics like net income, earnings per share, revenues, contracts, and backlog. Net income rose 56% and earnings per share rose 46% compared to the prior year quarter.
- Demand for luxury homes remained strong throughout 2004 and Toll Brothers expects continued growth, projecting approximately 30% net income growth in FY2005 and 20% revenue and net income growth in FY2006.
- Studies project continued strong demand for new homes over the next 10 years, ranging from 1.85 to 2.17 million units annually, while constraints on land supply are expected to result in shortages, particularly in affluent markets. Toll Brothers
United Stationers Inc. provided financial data for Q3 2007 and 2006 to reconcile non-GAAP measures of operating income and earnings per share with GAAP measures. For Q3 2007, adjusted operating income was $52.4 million (4.4% of sales) compared to $47.4 million (4.04% of sales) in 2006, a 20% increase in adjusted earnings per diluted share. For the first nine months of 2007, adjusted operating income was $151.8 million (4.31% of sales) compared to $125.6 million (3.65% of sales) in 2006, and adjusted earnings per diluted share grew 27%.
Toll Brothers reported record first quarter results for net income, revenues, contracts, and backlog. Revenues increased to $597.9 million, up 5% from the prior year. Net income grew to $50.1 million, up 10% compared to the previous year. Contracts signed increased 54% to $904.4 million and backlog reached a record high of $2.95 billion, up over 20% in each of Toll Brothers' six regions. Traffic and reservations also increased over 50% and 35% respectively, indicating strong future demand. Toll Brothers expects continued growth over the next two fiscal years due to its large land position and diversity across luxury housing niches.
United Stationers Inc. provides a reconciliation of its non-GAAP financial measures for December 31, 2002 and March 31, 2003. At these dates, the company had total available financing between $451 million and $595 million, consisting of funded debt, accounts receivable sold through securitization programs, and available credit facilities. However, restrictive covenants in the company's debt agreements limited the total available financing to between $150 million and $175 million. The pro forma adjustments assume completion of a debt refinancing and redemption of senior subordinated notes.
Our Chief Executive Officer is required to annually certify to the New York Stock Exchange that the company is in compliance with NYSE corporate governance listing standards or note any violations. On June 6, 2007, our Chief Executive Officer submitted this unqualified certification, indicating the company was in full compliance with NYSE standards as of that date.
Toll Brothers, Inc. reported record financial results for the second quarter of fiscal year 2001, with net income up 64% to $45.8 million, revenues increasing 32% to $514.5 million, and new home contracts and backlog reaching their highest levels. The company noted continued strong demand for luxury homes driven by favorable demographics, and outlined plans to capitalize on growth opportunities through land acquisitions and expanding its operations.
Toll Brothers is the leading luxury home builder in the US, with record earnings of $102 million on $1.46 billion in revenues in fiscal 1999. It operates 145 communities across 19 states, building single-family homes and attached homes on developed land. In addition to residential construction, Toll Brothers operates businesses including mortgage, title, land sales, and home product manufacturing. The document provides condensed financial statements for the quarter ended January 31, 2000, showing revenues of $344.5 million, income before taxes of $35.3 million, and net income of $22.4 million.
Toll Brothers reported record third quarter earnings and revenues. Earnings were up 24% over the previous year's third quarter and revenues were up 15%. The company has continued raising home prices as demand remains strong. Toll Brothers expanded into New Hampshire, its 20th state, and sees continued growth opportunities in master planned communities with amenities like golf courses. The strong housing market and Toll Brothers' $1.47 billion backlog position the company for another record year in fiscal 2001.
Toll Brothers had another record quarter, with earnings up 27% to $28.0 million. Revenues increased 14% to $390.5 million. Signed contracts reached a record $649.9 million, up 26%, and backlog set a new high of $1.39 billion, up 29%. For the first six months, earnings grew 27% to a record $50.3 million on a 19% revenue increase to $735.0 million, with signed contracts at a record $1.04 billion. Toll Brothers continues to expand geographically and through strategic investments in land and telecommunications ventures to capitalize on growth opportunities.
Toll Brothers is the leading luxury home builder in the US, generating $2.2 billion in revenues and $214 million in earnings in fiscal 2001. It operates in 21 states, building single-family homes, attached homes, and master-planned golf course communities. Toll Brothers also has various subsidiary operations related to construction services. For the quarter ending January 31, 2002, Toll Brothers reported revenues of $492.2 million, income before taxes of $69.9 million, and net income of $44.4 million. Total assets as of January 31, 2002 were $2.72 billion, with total liabilities of $1.745 billion.
Toll Brothers reported record third quarter results for 2003, with earnings per share increasing 29% year-over-year to $0.90. Net income rose 27% to a record $68.2 million, while revenues increased 19% to a record $693.7 million. Contracts and backlog both reached all-time highs, with contracts up 35% to $952.7 million and backlog growing 31% to $2.49 billion. For the nine-month period, earnings per share increased 12% to a record $2.23, and net income rose 11% to a record $166.4 million. Toll Brothers expects continued strong growth in fiscal 2004 and beyond, supported by expanding land
Toll Brothers reported record third quarter results for 2003, with earnings per share increasing 29% year-over-year. Revenues grew 19% to a record $693.7 million. Contracts and backlog also reached all-time highs, with contracts increasing 35% to $952.7 million and backlog growing 31% to $2.49 billion. Toll Brothers expects continued strong growth in 2004 by expanding its land supply and number of communities. It raised additional capital through an equity offering and bond issuance to fund further expansion opportunities. Toll Brothers believes demand will remain robust given an improving economy and strength in the luxury housing market.
This document is Toll Brothers Inc.'s quarterly report filed with the SEC for the quarter ended July 31, 2001. It summarizes Toll Brothers' financial position, including an increase in total assets to $2.4 billion from $2 billion the prior year. It also reports the company's operating results for the quarter, with housing revenues of $573 million and net income of $59 million. Finally, it provides additional details on Toll Brothers' inventory, subordinated notes issued, stock repurchase program, and cash flows for the period.
This document is Toll Brothers Inc.'s quarterly report filed with the SEC for the quarter ended July 31, 2001. It summarizes Toll Brothers' financial position, including an increase in total assets to $2.4 billion from $2 billion the prior year. Revenues increased to $1.5 billion from $1.2 billion the prior year. Net income increased to $145 million from $88 million the prior year. The report provides condensed financial statements, notes to the financial statements, and management's discussion of financial results.
This document is Toll Brothers Inc.'s Form 10-Q filing for the quarterly period ended July 31, 2000. It provides condensed financial statements and notes for the periods ended July 31, 2000 and 1999 including the balance sheet, income statement, and cash flow statement. Key details include revenues of $1.2 billion for the nine months ended July 31, 2000 compared to $1 billion for the same period in 1999. Net income was $87.6 million for the nine months of 2000 compared to $68.1 million in 1999.
USG Corporation had a very successful year in 1999. Net sales increased 15% to $3.6 billion, operating profit rose 25% to $730 million, net earnings increased 27% to $421 million, and diluted earnings per share were $8.39 compared to $6.61 in 1998. To continue this growth, USG is investing in new state-of-the-art manufacturing facilities to increase production capacity and replace older, higher-cost plants. They are also focusing on innovation, expanding distribution through L&W Supply, strengthening customer relationships, and building their brands.
This document is Toll Brothers' quarterly report filed with the SEC, reporting financial results for the quarter ended January 31, 2002. It includes condensed consolidated balance sheets, statements of income, and cash flows. Revenues increased from the prior year due to higher housing sales, while costs and expenses also rose. Net income increased from the previous year's quarter, with earnings per share of $44.5 million compared to $39.9 million a year earlier.
This document is Toll Brothers' quarterly report filed with the SEC for the period ending January 31, 2002. It includes condensed consolidated financial statements such as the balance sheet, income statement, and cash flow statement. Revenues increased from the prior year due to higher housing sales. Net income increased to $44.5 million from $39.9 million a year ago. Earnings per share increased to $1.27 from $1.10 in the prior year period. The company issued $150 million in senior subordinated notes in November 2001 to fund general corporate purposes including land acquisition.
Toll Brothers, Inc. is the leading luxury home builder in the US. It has grown revenues and earnings at a compound annual growth rate of over 20% for the past 1, 3, 5, 7, and 10 years. For the third quarter of 2002, Toll Brothers reported contracts of $704 million, up 30% from the prior year. Backlog reached a record $1.9 billion, up 21% from the prior year. However, earnings per share of $0.70 were down 9% due to the impact of a slowdown in demand in late 2001 and after 9/11 on home deliveries. For the first nine months of 2002, contracts were $2.09 billion, up 24%,
Toll Brothers, Inc. is the leading luxury home builder in the US. It has grown revenues and earnings at a compound annual growth rate of over 20% for the past 1, 3, 5, 7, and 10 years. While Q3 2002 earnings of $0.70 per share were down 9% from 2001 due to impacts from late 2001 and 9/11, nine month earnings of $1.99 per share were up 8% and revenues reached a record $1.62 billion, up 3% from 2001. Toll Brothers' backlog also reached a record high of $1.9 billion for any quarter end in the company's history, presaging strong results over the next nine months.
This document is Toll Brothers' quarterly report filed with the SEC for the quarter ending January 31, 2001. It includes condensed financial statements showing increased revenues and net income compared to the prior year. Assets totaled $2.2 billion as of January 31, 2001, with inventory comprising most of the assets. Total liabilities were $1.4 billion, leaving stockholders' equity of $801.8 million. For the quarter, housing and land sales increased compared to the prior year, resulting in net income of $39.9 million, up significantly from $22.4 million in the previous year.
The document is Toll Brothers Inc.'s quarterly report filed with the SEC for the period ended January 31, 2001. It includes condensed consolidated financial statements and notes. The financial statements show that for the quarter ended January 31, 2001, Toll Brothers' housing sales revenues increased to $458.4 million compared to $334.2 million for the same period the previous year. Toll Brothers' net income for the quarter increased to $39.9 million compared to $22.4 million for the same quarter the previous year. The cash flow statement shows that Toll Brothers issued $200 million in senior subordinated notes in January 2001 to fund general corporate purposes including land acquisitions.
Expeditors International of Washington, 4th02qerfinance39
Expeditors International of Washington, Inc. announced quarterly earnings of $35,996,000 for Q4 2002, a 33% increase over Q4 2001. Net revenues increased 30% to $201,602,000. For the full year 2002, net earnings increased 16% to $112,529,000 and net revenues grew 12% to $682,213,000. The company's CEO attributed the strong results to the tremendous efforts of employees in serving customers during an unprecedented period with many disruptions.
- PPG Industries reported net sales of $2.87 billion for the quarter and $11.2 billion for the year, up compared to the same periods in 2006. Net income was $200 million for the quarter and $834 million for the year.
- By business segment, Performance Coatings and Industrial Coatings experienced the largest sales increases both for the quarter and full year.
- Total current assets at the end of 2007 were $7.14 billion, up from $4.86 billion at the end of 2006, mainly due to increases in cash, short-term investments, and receivables.
The interim report summarizes the company's financial performance in the first half of 2008. Key points include record profitability with an operating margin of 16.6% and net margin of 12.1%. Vehicle and service sales grew 15% and 30% respectively. Earnings per share increased 36% to SEK 12.52. The outlook predicts earnings in 2008 will be higher than 2007 due to continued strong demand outside of Europe.
1) Scania reported record earnings in the first half of 2008, with operating margin reaching 16.6% and net margin at 12.1%.
2) Scania is pursuing profitable growth through increasing vehicle and service sales. Revenue grew 15% while EBIT grew 30% in the first half of 2008.
3) Scania's vision is to reach annual production of 150,000 vehicles while maintaining a flexible cost structure and focus on customer productivity and uptime.
The interim report summarizes the company's performance in the first three quarters of 2008. Key highlights include operating margins reaching an all-time high of 15.8% and EBIT growth of 25%. Revenue and profitability increased due to higher vehicle and service volumes, price increases, and favorable product mix. However, order bookings for trucks have declined 51% in Western Europe and 34% in Central and Eastern Europe. While flexible production has helped, earnings forecasts for 2009 are not provided due to economic uncertainty. The service business continues growing with increased traffic and workshop utilization.
HQ Bank has experienced volume driven growth in its credit portfolio over the past 9 months of 2008. While the portfolio increased 8% in local currencies, bad debt provisions increased in several markets. The bank has a well balanced portfolio that is diversified across exposure levels, geographic areas, and products. It maintains a conservative refinancing policy and manages risks through matched funding and credit risk management.
1) Scania reported all-time high earnings in 2008 with operating income of SEK 12,512 million. However, deliveries declined 18% in Q4 as the company adjusted production rates due to decreased demand in Europe.
2) While the trucks and services segment grew profits through price increases, this was partially offset by negative impacts from lower deliveries, used vehicles, raw materials, and R&D spending.
3) Scania's flexible production system and focus on reducing inventory and postponing investments helped cash flow, but tied up capital increased with capacity investments. Outlook remains uncertain given rapid demand fall in Q4 2008 and high industry inventory levels.
The interim report summarizes the company's performance in the first three quarters of 2008. Key highlights include operating margins reaching an all-time high of 15.8% and EBIT growth of 25%. Vehicle deliveries increased 4% while service revenue grew due to the large installed base of vehicles. The outlook acknowledges earnings will be higher in 2008 than 2007 but provides no forecast for 2009 due to uncertainty.
- Scania's operating margin and net margin increased in the first nine months of 2008 compared to the same period in 2007. Net sales rose 11% while order bookings declined 29% due to lower demand in Europe.
- Earnings per share increased and the forecast for higher full-year 2008 earnings remains unchanged. However, due to lower order bookings and higher inventories, Scania will adjust production rates.
- Service revenue continued to show strong growth of 8%, while trucks deliveries increased 4% and various restructuring efforts are expected to generate annual cost savings of SEK 300 million from 2009.
1) Scania reported all-time high earnings in 2008 with operating income of SEK 12,512 million. However, deliveries declined 18% in Q4 as the company adjusted production rates due to decreased demand in Europe.
2) While the trucks and services segment grew profits through price increases, this was partially offset by negative impacts from lower deliveries, used vehicles, raw materials, and R&D spending.
3) Scania's flexible production system and focus on reducing inventory and postponing investments helped cash flow, but tied up capital increased with capacity investments. Outlook for 2009 is uncertain due to rapid demand fall in Q4 and high industry inventory levels.
This document is Scania's annual report for 2008. It discusses Scania's vision to be a leading company in its industry by creating value for customers, employees, shareholders, and society. The report outlines Scania's mission to supply high-quality vehicles and services for transporting goods and passengers in a sustainable way. It provides an overview of Scania's operations in trucks, buses, coaches, engines, and financial services. The financial reports indicate that Scania delivered 66,516 trucks, 7,277 buses and coaches, and 6,671 engines in 2008.
Our Chief Executive Officer is required to annually certify to the New York Stock Exchange that the company is in compliance with NYSE corporate governance listing standards, though he may qualify the certification if needed. On June 6, 2007, our Chief Executive Officer submitted the certification with no qualification, indicating full compliance with NYSE standards as of that date.
The document outlines the corporate governance guidelines of Perini Corporation. It discusses (1) the composition and responsibilities of the Board of Directors, including director qualifications and independence, (2) the roles and responsibilities of Board committees, and (3) policies regarding Board performance evaluation, director orientation, management succession planning, and the company's code of business conduct. The guidelines are intended to assist the Board in exercising its duties to stakeholders.
The Perini Corporation Code of Business Conduct and Ethics outlines guidelines for ethical behavior. It applies to all directors, officers, and employees. The code establishes rules regarding conflicts of interest, procurement ethics, accounting practices, use of company property, environmental compliance, and insider trading. Any violations of the code are taken seriously and can result in disciplinary action up to dismissal.
The document outlines the Corporate Governance and Nominating Committee Charter for Perini Corporation. The purpose of the committee is to identify and evaluate potential board candidates and lead corporate governance efforts. The committee must consist of at least two independent directors appointed by the board. It has authority to retain outside advisors and meet at least twice per year. Regarding nominations, the committee evaluates candidates, recommends nominees, and assesses board independence. For corporate governance, the committee develops guidelines, reviews committee performance, and recommends criteria for director tenure.
The document is the Compensation Committee Charter for Perini Corporation. It outlines the committee's purpose of ensuring compensation programs attract and retain employees while representing fair value for shareholders. It details the committee's composition, duties, and responsibilities which include annually reviewing executive compensation programs, recommending director and CEO compensation, overseeing incentive plans, and preparing required compensation disclosures.
STREETONOMICS: Exploring the Uncharted Territories of Informal Markets throug...sameer shah
Delve into the world of STREETONOMICS, where a team of 7 enthusiasts embarks on a journey to understand unorganized markets. By engaging with a coffee street vendor and crafting questionnaires, this project uncovers valuable insights into consumer behavior and market dynamics in informal settings."
Economic Risk Factor Update: June 2024 [SlideShare]Commonwealth
May’s reports showed signs of continued economic growth, said Sam Millette, director, fixed income, in his latest Economic Risk Factor Update.
For more market updates, subscribe to The Independent Market Observer at https://blog.commonwealth.com/independent-market-observer.
In a tight labour market, job-seekers gain bargaining power and leverage it into greater job quality—at least, that’s the conventional wisdom.
Michael, LMIC Economist, presented findings that reveal a weakened relationship between labour market tightness and job quality indicators following the pandemic. Labour market tightness coincided with growth in real wages for only a portion of workers: those in low-wage jobs requiring little education. Several factors—including labour market composition, worker and employer behaviour, and labour market practices—have contributed to the absence of worker benefits. These will be investigated further in future work.
Fabular Frames and the Four Ratio ProblemMajid Iqbal
Digital, interactive art showing the struggle of a society in providing for its present population while also saving planetary resources for future generations. Spread across several frames, the art is actually the rendering of real and speculative data. The stereographic projections change shape in response to prompts and provocations. Visitors interact with the model through speculative statements about how to increase savings across communities, regions, ecosystems and environments. Their fabulations combined with random noise, i.e. factors beyond control, have a dramatic effect on the societal transition. Things get better. Things get worse. The aim is to give visitors a new grasp and feel of the ongoing struggles in democracies around the world.
Stunning art in the small multiples format brings out the spatiotemporal nature of societal transitions, against backdrop issues such as energy, housing, waste, farmland and forest. In each frame we see hopeful and frightful interplays between spending and saving. Problems emerge when one of the two parts of the existential anaglyph rapidly shrinks like Arctic ice, as factors cross thresholds. Ecological wealth and intergenerational equity areFour at stake. Not enough spending could mean economic stress, social unrest and political conflict. Not enough saving and there will be climate breakdown and ‘bankruptcy’. So where does speculative design start and the gambling and betting end? Behind each fabular frame is a four ratio problem. Each ratio reflects the level of sacrifice and self-restraint a society is willing to accept, against promises of prosperity and freedom. Some values seem to stabilise a frame while others cause collapse. Get the ratios right and we can have it all. Get them wrong and things get more desperate.
Vicinity Jobs’ data includes more than three million 2023 OJPs and thousands of skills. Most skills appear in less than 0.02% of job postings, so most postings rely on a small subset of commonly used terms, like teamwork.
Laura Adkins-Hackett, Economist, LMIC, and Sukriti Trehan, Data Scientist, LMIC, presented their research exploring trends in the skills listed in OJPs to develop a deeper understanding of in-demand skills. This research project uses pointwise mutual information and other methods to extract more information about common skills from the relationships between skills, occupations and regions.
Enhancing Asset Quality: Strategies for Financial Institutionsshruti1menon2
Ensuring robust asset quality is not just a mere aspect but a critical cornerstone for the stability and success of financial institutions worldwide. It serves as the bedrock upon which profitability is built and investor confidence is sustained. Therefore, in this presentation, we delve into a comprehensive exploration of strategies that can aid financial institutions in achieving and maintaining superior asset quality.
The Universal Account Number (UAN) by EPFO centralizes multiple PF accounts, simplifying management for Indian employees. It streamlines PF transfers, withdrawals, and KYC updates, providing transparency and reducing employer dependency. Despite challenges like digital literacy and internet access, UAN is vital for financial empowerment and efficient provident fund management in today's digital age.
OJP data from firms like Vicinity Jobs have emerged as a complement to traditional sources of labour demand data, such as the Job Vacancy and Wages Survey (JVWS). Ibrahim Abuallail, PhD Candidate, University of Ottawa, presented research relating to bias in OJPs and a proposed approach to effectively adjust OJP data to complement existing official data (such as from the JVWS) and improve the measurement of labour demand.
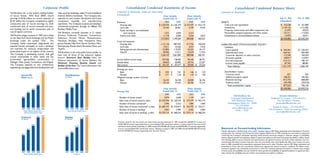
1. Corporate Profile Consolidated Condensed Statements of Income Consolidated Condensed Balance Sheets
(Amounts in thousands, except per share data) (Amounts in thousands)
Toll Brothers, Inc. is the nation’s leading builder sales, security, landscape, cable T.V. and broadband
(Unaudited)
of luxury homes. With fiscal 2000’s record Internet delivery businesses. The Company also Nine Months Three Months
July 31, 2001 Oct. 31, 2000
earnings of $146 million on record revenues of operates its own lumber distribution, and house Ended July 31 Ended July 31
(Unaudited)
$1.81 billion, the Company completed its eighth component assembly and manufacturing 2001 2000 2001 2000 ASSETS
Revenues:
consecutive year of record earnings, its ninth operations. The Company acquires and develops Cash and cash equivalents $ 125,528 $ 161,860
Housing sales $ 1,529,394 $1,160,379 $ 573,479 $ 452,174
consecutive year of record revenues and year- commercial properties through its affiliate, Toll Inventories 2,129,122 1,712,383
Land sales 25,166 30,061 2,749 9,544
end backlog, and its tenth consecutive year of Brothers Realty Trust. Property, construction and office equipment, net 31,972 24,075
Equity earnings in unconsolidated
record signed contracts. Toll Brothers currently operates in 21 states: Receivables, prepaid expenses and other assets 127,211 113,025
joint ventures 7,575 3,069 2,314
Toll Brothers began business in 1967 and is listed Arizona, California, Colorado, Connecticut, Investments in unconsolidated entities 14,973 18,911
Interest and other 11,718 6,060 5,526 2,814
on the New York Stock Exchange and the Pacific Delaware, Florida, Illinois, Massachusetts, $2,428,806 $2,030,254
1,573,853 1,199,569 584,068 464,532
Exchange under the symbol “TOL”. The Maryland, Michigan, New Hampshire, New Costs and expenses:
Company builds customized single-family and Jersey, Nevada, New York, North Carolina, Ohio, Housing sales 1,131,136 887,303 417,756 342,030 LIABILITIES AND STOCKHOLDERS’ EQUITY
attached homes, principally on land it develops Pennsylvania, Rhode Island,Tennessee,Texas, and Land sales 19,611 23,266 2,073 7,618 Liabilities:
and improves, for move-up, empty-nester and Virginia. Selling, general and administrative 152,894 119,307 54,555 44,177 Loans payable $ 364,261 $ 326,537
active-adult buyers in six regions of the country. Interest 40,506 31,211 15,524 11,916
Toll Brothers is the only public home builder to Subordinated notes 669,561 469,499
The Company is developing country club, golf have won all three of the industry’s highest 1,344,147 1,061,087 489,908 405,741 Customer deposits on sales contracts 115,240 104,924
course communities in seven states and has honors: America’s Best Builder from the Accounts payable 100,817 110,927
active-adult, age-qualified communities in Income before income taxes 229,706 138,482 94,160 58,791
National Association of Home Builders, the Accrued expenses 214,131 185,141
Michigan, New Jersey, Connecticut, and Virginia. Income taxes 84,559 50,905 34,716 21,557
National Housing Quality Award and Income taxes payable 87,763 88,081
The Company operates its own architectural, Net income $ 145,147 $ 87,577 $ 59,444 $ 37,234
Builder of the Year. For more information visit Total liabilities 1,551,773 1,285,109
engineering,mortgage,title,land development and www.tollbrothers.com. Earnings per share
Stockholders’ equity:
Basic $ 4.02 $ 2.41 $ 1.66 $ 1.03
$1.54 $584
Common stock 357 359
Diluted $ 3.71 $ 2.36 $ 1.54 $ 1.00
Income Per Total Revenues
Additional paid-in capital 108,351 105,454
Weighted average number of shares
(in millions)
Share (Diluted)
Retained earnings 813,755 668,608
$465 Basic 36,143 36,338 35,838 36,146
Treasury stock (45,430) (29,276)
Diluted 39,134 37,055 38,706 37,219
$406
$1.00
Total stockholders’ equity 877,033 745,145
$342
$2,428,806 $2,030,254
Nine Months Three Months
$.80
Ended July 31 Ended July 31
Housing Data
$.67
$242
2001 2000 2001 2000
Toll Brothers, Inc. Investor Relations
$.45
Number of homes closed 3,079 2,668 1,129 1,011 Corporate Headquarters Frederick N. Cooper – 215-938-8312
Sales value of homes closed (in 000’s) $1,529,394 $1,160,379 $ 573,479 $ 452,174 3103 Philmont Avenue Vice President - Finance
Huntingdon Valley, PA 19006 fcooper@tollbrothersinc.com
Number of homes contracted* 3,396 3,322 1,085 1,060
215-938-8000
Sales value of homes contracted* (in 000’s) $1,685,197 $1,573,814 $ 542,792 $ 532,317 Joseph R. Sicree – 215-938-8045
www.tollbrothers.com
1997 1998 1999 2000 2001 1997 1998 1999 2000 2001 Vice President - Chief Accounting Officer
Number of homes in backlog* 3,055 2,983 3,055 2,983 NYSE – “TOL”
Three Months Ended July 31 Three Months Ended July 31
jsicree@tollbrothersinc.com
Sales value of homes in backlog* (in 000’s) $1,579,110 $1,468,254 $ 1,579,110 $1,468,254
Before Extraordinary Item
$543 $1,579
$532
Contracts Backlog $1,468
(in millions) (in millions)
*Contract totals for the nine-month and three-month periods ended July 31, 2001 include $11,638,000 (41 homes) and
$1,861,000 (6 homes), respectively, from an unconsolidated 50% owned joint venture. Contract totals for the nine-month
$399
$1,093 and three-month periods ended July 31, 2000 include $12,339,000 (45 homes) and $4,445,000 (15 homes), respectively,
Statement on Forward-looking Information
from an unconsolidated 50% owned joint venture. Backlog as of July 31, 2001 and 2000 included $9,081,000 (30 homes)
$333
and $13,229,000 (47 homes), respectively, from this joint venture. Certain information included herein and in other Company reports, SEC filings, statements and presentations is forward-
$844
looking within the meaning of the Private Securities Litigation Reform Act of 1995, including, but not limited to, statements
$251
concerning the Company's anticipated operating results, financial resources, changes in revenues, changes in profitability,
$654
interest expense, growth and expansion, ability to acquire land, ability to sell homes and properties, ability to deliver homes
from backlog, ability to secure materials and subcontractors, the general economy and stock market valuations. Such for-
ward-looking information involves important risks and uncertainties that could significantly affect actual results and cause
them to differ materially from expectations expressed herein and in other Company reports, SEC filings, statements and
presentations. These risks and uncertainties include local, regional and national economic conditions, the effects of gov-
ernmental regulation, the competitive environment in which the Company operates, fluctuations in interest rates, changes
in home prices, the availability and cost of land for future growth, the availability of capital, fluctuations in capital and secu-
1997 1998 1999 2000 2001 1997 1998 1999 2000 2001
rities markets, the availability and cost of labor and materials, and weather conditions.
Three Months Ended July 31 At July 31
2. A Letter to our Shareholders:
TF I IRRSD Q U A R T E R R E P O R T
FOR THE THREE MONTHS
E N D ED D E D U A R Y 31 , 20 0 0 01
The Coventry Federal at Triadelphia Ridge, Howard County, MD
3rd Quarter Report
Despite reports of its demise, our luxury new Due to regulation-imposed delays in opening
home market remains quite healthy. Amid some new communities and new sections of
continuing sluggishness in the U.S. economy, Toll existing communities, our community count this
Brothers once again posted record results. quarter was lower than one year ago. Even with
E N JA N J U LY
Thanks to hard work and effective planning and fewer communities, our contracts exceeded last
the luxury market's ability to weather the year’s record third quarter.
downturn, we have just completed the best third
Our delays in community openings are temporary.
quarter and first nine months in our history.
T
We project we will have open approximately 160
Record third quarter net income grew 60% over communities by FYE 2002, compared to 142 at
H
third quarter 2000 to $59.4 million ($1.54 per third quarter end 2001, and approximately 175
share diluted), the highest total for any quarter in communities by FYE 2002.
our history. Record revenues increased 26% to
This quarter we entered our 21st state -
$584.1 million. Record contracts rose 2% to
Colorado. Our first two communities, located
$542.8 million as we produced our 42nd
southeast of Denver within the master planned
consecutive quarterly year-over-year record for
golf course community of Castle Pines Village, will
signed contracts. The Company’s backlog
total 170 single-family homes. They are priced
increased 8% to $1.58 billion. And our
from the high $500,000’s and pre-sales will
shareholders’ equity, which has grown 27% in the
commence this winter. We are pleased to finally be
past twelve months, reached $877 million.
starting these communities, the planning and
Our nine month results were also records. Net approvals for which took us nearly three years.
income rose 66% to $145.1 million ($3.71 per
With over 38,000 lots in our pipeline, we are well-
share diluted); total revenues increased 31% to
positioned to benefit from the strong,
$1.57 billion and contracts increased 7% to $1.69
demographics-driven demand for luxury move-up,
billion.
empty-nester and active-adult homes as affluent
The most recent government jobs data indicates baby boomers move into their peak home buying
that unemployment among high-end white collar years. With our land approvals and development
workers is just over 2%. Our potential buyers expertise, we are poised to thrive in this
continue to hold jobs and earn healthy incomes, environment of increasing regulatory constraints
which is keeping the luxury new home market and growing lot shortages.
buoyant. The attraction of owning a new home is
We wish to thank our shareholders and home
enhanced, as the New York Times recently pointed
buyers for their ongoing support and our
out, by its appeal as an investment, vis-a-vis the
associates for the enthusiasm, diligence and
stock market, that can be lived in as well as
determination they bring to our Company each
profited from.
and every day.
Our record backlog contains most of our
deliveries for the next nine months and thus
affords us good revenue visibility into second
quarter 2002. With this backlog and a projected
Robert I. Toll Bruce E. Toll
increase in communities in the coming months, we Chairman of the Board Vice Chairman
believe we are on track for a record year in 2002. and Chief Executive Officer of the Board
Our strong year-over-year margin improvements
reflect the combination of pricing power, solid
demand, stable material costs and industry-wide Zvi Barzilay
lot shortages in most of our affluent markets. Had President and Chief Operating Officer
we had more fully approved home sites available, August 22, 2001
we could have sold more homes.