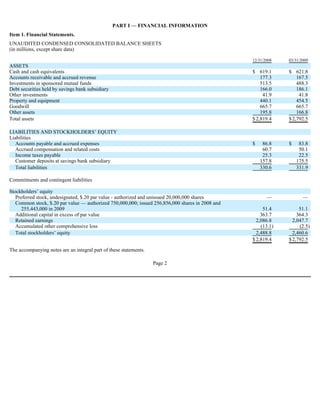
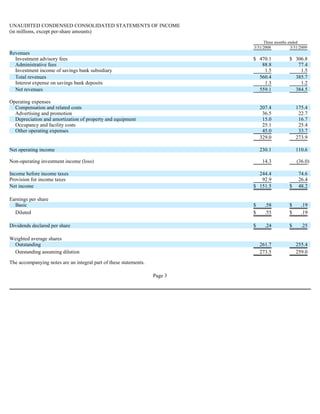
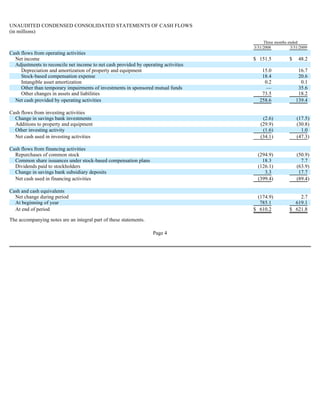
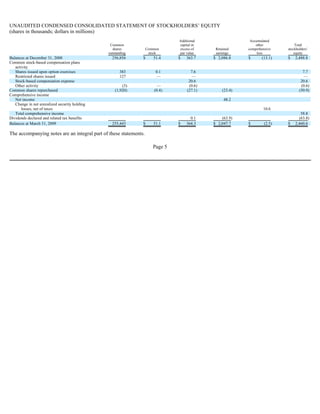
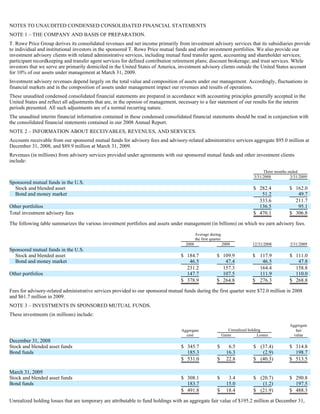
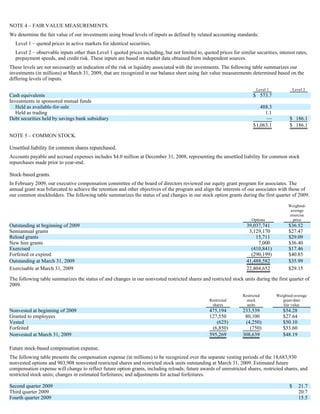
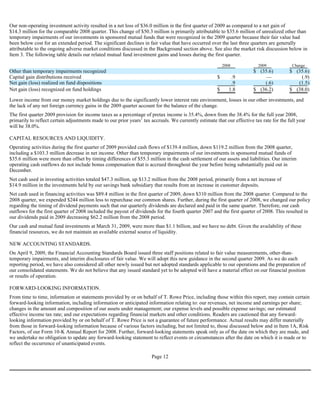
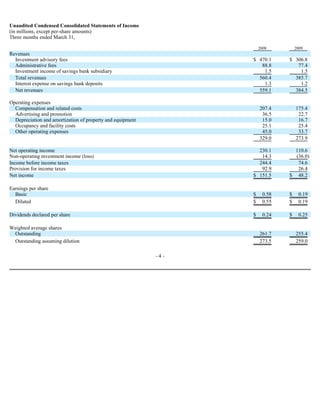
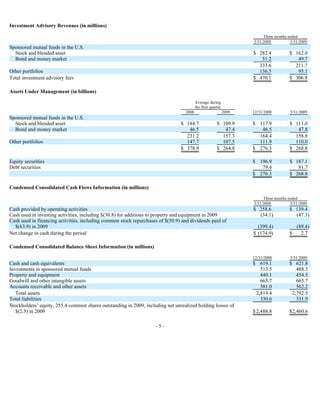
- Price Group Inc. filed its quarterly report for the period ending March 31, 2009.
- Total revenues for Q1 2009 were $385.7 million, down from $560.4 million in Q1 2008, due to lower investment advisory fees from lower assets under management.
- Net income for Q1 2009 was $48.2 million, down from $151.5 million in Q1 2008, as a result of lower revenues and non-operating investment losses of $36 million.
- Assets under management totaled $268.8 billion on March 31, 2009, down from $378.9 billion on March 31, 2008, contributing to lower investment advisory fees.
johnson controls FY2006 1st Quarter Form 10-Q finance8
This document is Johnson Controls' quarterly report filed with the SEC for the quarter ending December 31, 2005. It includes their consolidated statement of financial position, income, and cash flows for the periods ended December 31, 2005 and 2004. A key event disclosed is Johnson Controls' acquisition of York International Corporation on December 9, 2005 for approximately $3.1 billion, financed initially with commercial paper that was later refinanced with long-term debt. The acquisition enhanced Johnson Controls' building products and services capabilities.
This document is Micron Technology's Form 10-Q filing for the quarter ended June 3, 1999. It provides financial statements and notes including the consolidated balance sheet, statement of operations, cash flows, and notes to the financial statements. The filing indicates that Micron Technology has total assets of $6.8 billion and total liabilities of $2.7 billion. It reported a net loss of $27.7 million for the quarter on net sales of $863.8 million.
The document is Micron Technology's Form 10-Q for the quarterly period ended March 4, 1999. It includes Micron's consolidated balance sheets, statements of operations, statements of cash flows, and notes to the financial statements. The balance sheet shows the company had total assets of $6.8 billion as of March 4, 1999, including $428.9 million of cash and equivalents. The statement of operations shows the company reported net income of $22.4 million for the quarter. The statement of cash flows shows the company used $1.6 billion for investing activities, primarily to purchase securities, and generated $1.1 billion from financing activities, mainly from common stock and debt issuances.
This document is Johnson Controls' quarterly report filed with the SEC for the period ending June 30, 2004. It includes their consolidated statement of financial position, income statement, cash flows statement, and notes. The income statement shows net sales of $6.8 billion for the quarter and $19.8 billion for the nine months. Net income was $222 million for the quarter and $545 million for the nine months.
This document is Micron Technology Inc.'s Form 10-Q filing for the quarterly period ended June 1, 2000. It includes Micron's consolidated balance sheets, statements of operations, cash flows, and notes to the financial statements. The filing shows that for the quarter ended June 1, 2000, Micron's net sales were $1.789 billion and net income was $274.9 million. For the nine months ended June 1, 2000, net sales were $4.766 billion and net income was $777.5 million. The balance sheet indicates total assets of $8.211 billion as of June 1, 2000, including $383.2 million of cash and equivalents.
This document is Micron Technology's Form 10-Q filing for the quarterly period ended May 31, 2001. It includes their consolidated balance sheet and statements of operations for that quarter. The key details are:
- As of May 31, 2001 Micron had total assets of $8.8 billion including $622.7 million of cash and $1.1 billion of liquid investments. Their total liabilities were $1.5 billion resulting in total shareholders' equity of $7.2 billion.
- For the quarter ended May 31, 2001 Micron reported a net loss of $313.4 million or $0.53 per share. This included an operating loss of $
This document is Micron Technology's Form 10-Q filing for the quarterly period ended December 2, 1999. It includes Micron's consolidated balance sheets, statements of operations, statements of cash flows, and notes to the financial statements. For the quarter, Micron reported net sales of $1.58 billion, net income of $341.3 million, and earnings per share of $1.27. Cash and equivalents increased to $441.6 million from $294.6 million at the end of the previous quarter.
STATE FARM INSURANCE 2007 State Farm® Annual Reportfinance4
State Farm Mutual Automobile Insurance Company reduced auto insurance rates for the fourth straight year in 2007 despite higher vehicle operating costs. While underwriting profits dropped, improved investment income partly offset this. The company was also able to hold down operating expenses even while paying out $1.4 billion more in claims. Policies in force grew over 900,000 to nearly 42 million, and the company maintained its top financial strength rating from A.M. Best of A++.
- PACCAR Inc filed a quarterly report on Form 10-Q with the SEC for the quarter ended March 31, 2004.
- The report includes consolidated financial statements and notes for PACCAR and its subsidiaries for the quarter.
- Highlights include net income of $182.2 million for the quarter, up from $110.8 million in the same quarter of the previous year, with net income per share of $1.04.
This document provides an 11-year financial summary for Walmart from 1992-2002. Some key details include:
- Net sales increased 14% in 2002 to $217.8 billion, with a 6% increase in domestic store sales. Operating expenses rose slightly as a percentage of sales.
- Earnings per share were $1.49 in 2002, up from $1.41 in 2001. Return on assets was 8.5% and return on equity was 20.1%.
- The number of U.S. stores grew to include over 1,000 Supercenters and 500 SAM'S Clubs, with international units totaling over 1,170.
This document is the quarterly report on Form 10-Q filed by A.M. Castle & Co. for the quarter ending March 31, 2009. It includes condensed consolidated financial statements and notes. The financial statements show that net sales were $252 million for the quarter, with net income of $480 thousand. Cash flow from operations was $4.7 million for the quarter. The report provides the company's condensed financial position, results of operations, and cash flows for the quarter, as well as notes regarding new accounting standards adopted and the company's acquisition of Metals U.K. Group in January 2008.
u.s.bancorp Form 8 K/A - Revision to 4Q2005 Earnings Release - February 1, 2006 finance13
The document is a filing by U.S. Bancorp with the Securities and Exchange Commission reporting revisions to previously disclosed information about nonperforming assets as of December 31, 2005. It states that a credit card collection management program implemented in June 2005 was not properly included in nonperforming loans, increasing the nonperforming assets ratio from 0.43% to 0.47%. There is no impact on reported earnings. It also reconfirms the view expressed in an earlier press release that net charge-offs in early 2006 will approximate third quarter 2005 levels.
The document provides an overview of key corporate financial disclosure documents including the directors' report, auditor's report, profit and loss statement, balance sheet, and cash-flow statement. It discusses the importance of these documents for understanding a company's financial performance and position. The profit and loss statement is described as a roadmap from revenue to net profit, and the balance sheet provides a snapshot of a company's assets and liabilities. Footnotes and definitions of common financial ratios are also provided.
This document is Aetna Inc.'s quarterly report filed with the SEC for the quarter ended March 31, 2005. It provides financial statements and disclosures for the period. Specifically, it includes the consolidated statements of income, balance sheets, shareholders' equity, and cash flows for the quarters ended March 31, 2005 and 2004. It also provides notes to the financial statements and disclosures on the company's business segments, accounting policies, and recent acquisitions. The financial statements show increased revenues and net income compared to the prior year period.
PricewaterhouseCoopers conducted an audit of The Progressive Corporation and subsidiaries' financial statements for 2003, 2002, and 2001. PwC issued an unqualified opinion, stating that the financial statements fairly presented the financial position and results of operations in accordance with generally accepted accounting principles. The audit was performed in accordance with generally accepted auditing standards, which included examining evidence supporting the financial statements and evaluating the overall presentation.
This document is Micron Technology's Form 10-Q filing for the quarterly period ended March 2, 2000. It includes Micron's consolidated balance sheets, statements of operations, cash flows, and comprehensive income for the quarter and six months ended March 2, 2000. The filing shows that for the quarter, Micron had net income of $161.3 million on revenue of $1,392.5 million. For the six months ended, Micron had net income of $502.6 million on revenue of $2,976.9 million. The balance sheet indicates total assets of $7,734.8 million as of March 2, 2000.
This 3 sentence summary provides the key details from the document:
Morgan Stanley Market Products Inc. is a wholly owned subsidiary of Morgan Stanley that is primarily engaged in trading U.S. government agency securities and derivatives. As of May 31, 2008, the company had total assets of $11.88 billion, consisting mainly of securities and reverse repurchase agreements, and total liabilities of $11.12 billion, consisting mainly of repurchase agreements. The statement provides details on the company's financial position, including assets, liabilities, and equity, as of May 31, 2008.
This document provides interim summarized consolidated financial statements for Bank Vozrozhdenie for the period ended September 30, 2012. It includes statements of financial position, comprehensive income, changes in equity, and cash flows. Notes to the financial statements provide additional details on cash and cash equivalents, trading securities, loans to customers, and other financial information. The bank reported total assets of RR 194.7 billion as of September 30, 2012, with net profit of RR 1.787 billion for the first nine months of 2012.
This document is PACCAR Inc's quarterly report on Form 10-Q for the period ending March 31, 2005. It provides condensed financial statements and notes for the company, including consolidated statements of income and cash flows for the quarters ending March 31, 2005 and 2004, and consolidated balance sheets as of March 31, 2005 and December 31, 2004. It also provides information on accounting policies, inventory valuations, and product support liabilities.
This document contains consolidated financial statements for Anheuser-Busch Companies for the years ended December 31, 2005 and 2004. It includes the balance sheet, statement of income, statement of changes in shareholders' equity, and statement of cash flows. The balance sheet shows the company had total assets of $16.6 billion in 2005 and $16.2 billion in 2004, with shareholders' equity of $3.3 billion in 2005 and $2.7 billion in 2004. The statement of income shows net income was $1.8 billion in 2005 and $2.2 billion in 2004. Cash provided by operating activities was $2.7 billion in 2005 and $2.9 billion in 2004 according to the statement
The document presents consolidated balance sheet and financial statement information for Anheuser-Busch Companies for the years ended December 31, 2006 and 2005. It shows that the company had total assets of $16.4 billion in 2006 and $16.6 billion in 2005, with current assets of $1.8 billion in 2006 and $1.8 billion in 2005. It also shows that the company had total shareholders' equity of $3.9 billion in 2006 and $3.7 billion in 2005, and net income of $2.0 billion in 2006 and $1.7 billion in 2005.
This document provides the interim quarterly financial statements of Bank Vozrozhdenie as of March 31, 2011. It includes the statement of financial position, statement of comprehensive income, statement of changes in equity, statement of cash flows, and notes to the financial statements. The notes provide additional information on cash and cash equivalents, trading securities, due from other banks, loans and advances to customers, and the movement in the provision for loan impairment during the period.
Nationwide is one of the largest insurance and financial services companies in the world. In 2003, Nationwide achieved strong financial results, with net income increasing significantly from the previous year. Nationwide also reached milestones of issuing its one millionth annuity contract and gaining its one millionth life insurance customer. Nationwide is focused on serving customers through initiatives like expanding distribution channels, pursuing cross-selling opportunities, and investing in financial education programs. Nationwide is also committed to giving back to communities through corporate donations and employee volunteerism.
Baldwin & Lyons, Inc. announced financial results for the first quarter of 2009 with operating income of $6.2 million compared to an operating loss in 2008. Premiums increased 6% driven by growth in property reinsurance and auto products. The combined ratio improved to 89% from 98.5% due to lower loss ratios and reserve savings. However, investment income declined due to lower interest rates. Shareholders' equity decreased due to a decline in unrealized gains and cash dividends paid.
The document is the 2005 annual report and proxy statement for The Progressive Corporation. It includes the consolidated financial statements and notes for 2005, 2004, and 2003. The financial statements show that Progressive's net income increased from $1,255.4 million in 2003 to $1,393.9 million in 2005, while revenues grew from $11,892.0 million to $14,303.4 million over the same period. The notes provide additional details on Progressive's accounting policies, investments, reserves for losses and loss adjustment expenses, debt, and income taxes.
This document is West Bancorporation's (WTBA) 10-Q quarterly report filed with the SEC for the quarter ending March 31, 2009. The summary includes:
- WTBA reported net income of $2.9 million for the quarter, compared to $1.4 million for the same period last year. Earnings per share were $0.14.
- Total assets increased to $1.6 billion from $1.6 billion at the end of 2008. Loans increased to $1.1 billion from $1.1 billion. Deposits increased to $1.2 billion from $1.2 billion.
- Net interest income was $9.9
Leggett & Platt reported first quarter 2009 earnings of $0.06 per share, down from $0.23 per share in Q1 2008. Sales were $718 million, a 28% decrease from the prior year due to weak demand. Cash flow from operations was $115 million, up 116% from prior year due to working capital reductions. For 2009, the company estimates EPS of $0.60-$0.90 on $2.9-3.3 billion in sales, down from prior guidance due to continued weak demand.
- Crane Co.'s net sales decreased 18% in Q1 2009 compared to Q1 2008, with declines across all business segments. Net income declined 52% over the same period.
- As of March 31, 2009, Crane Co.'s cash and cash equivalents totaled $210 million, accounts receivable was $325 million, and order backlog for aerospace and electronics was $396 million.
- In Q1 2009, Crane Co. generated $15 million in cash from operating activities. However, it used $21 million in cash for financing activities, including paying dividends and reacquiring shares.
- Intel reported first quarter revenue of $7.1 billion, down 13% from the previous quarter and 26% from the previous year.
- Gross margin was 46%, down 7 points from the previous quarter.
- Operating income was $670 million, down 56% from the previous quarter.
- Net income was $647 million, up 176% from the previous quarter.
- Jean Coutu Group reported an increase in sales and revenues for the second quarter of 2010 compared to the same period last year. Total sales increased 7.7% to $549 million while revenues from franchising increased 7.3% to $608.7 million.
- Net earnings for the quarter were $14.9 million compared to a net loss of $39.1 million in the previous year. Earnings per share were $0.07 compared to a loss per share of $0.16 last year.
- Rite Aid also reported financial results for the second quarter, with revenues of $6.3 billion and a net loss of $116 million. Rite Aid revised its guidance
This document is Joe's Jeans Inc.'s quarterly report (Form 10-Q) filed with the SEC for the quarter ending May 31, 2009. The report provides Joe's financial statements for the quarter, including the balance sheet, income statement, and cash flow statement. It also includes management's discussion and analysis of the company's financial condition and operating results. In addition, the report discusses legal proceedings, risk factors, defaults on senior securities, and other regulatory disclosures.
- Zions Bancorporation reported a net loss of $832.2 million or $7.29 per share for Q1 2009, driven largely by a $634 million non-cash goodwill impairment at Amegy Bank and $249 million in impairment and valuation losses on securities.
- Key factors contributing to the loss included building loan loss reserves by $146 million, a decline in net interest margin to 3.93%, and acquiring failed bank Alliance Bank's assets.
- However, the company extended $3.8 billion in new credit in Q1, loan charge-offs declined from Q4, and its capital ratios remained above regulatory requirements despite the reported loss.
Let’s Shap Cultures! A Creative Approach to Language LearningFiorenza Congedo
Ralph Annina from Bradford High School in Kenosha, Wisconsin and Fiorenza Congedo from G. Marconi Technical High School in Verona, Italy presented on their project using MagazineFactory to facilitate student writing and cultural exchange. The project aims to promote language learning through technology by having students from each school publish articles on various topics in their virtual magazine. Benefits include increased student motivation to learn a foreign language and improved language skills. The project is transferable as new classes can join at any time during the school year.
Weatherford International reported first quarter 2009 results. Income from continuing operations was $186 million, or $0.27 per diluted share, excluding costs related to investigations and restructuring. Revenue was $2.26 billion, a 3% increase over first quarter 2008. North America revenue declined 23% due to a 27% drop in rig count, while international revenue rose 28% against a 2% decline in rig count. The company hosted a conference call to discuss the results.
Chevron issued an interim update for the third quarter of 2009. It reported that earnings are expected to be higher than the second quarter due to significantly higher upstream earnings from increased crude oil prices and $400 million in gains from asset sales and tax items. Downstream results are expected to be relatively flat. Production increased in the U.S. due to ramp-up at a Gulf of Mexico field, but decreased internationally due to disruptions in Nigeria. Crude oil and natural gas realizations increased in the U.S. and internationally. Refining margins were mixed between regions.
- Citi reported revenues of $24.8 billion for Q1 2009, nearly double the prior year level, driven by strong results in institutional clients. However, net income was $1.6 billion, with most other businesses negatively impacted by the difficult economic environment.
- Expenses declined 23% from Q1 2008 to $12.1 billion, due to ongoing cost cutting efforts. Credit costs increased 76% to $10.3 billion, as net credit losses and loan loss reserves rose, primarily in consumer banking and cards.
- While results improved from the prior year, most businesses still struggled due to the weak economy. Management remains focused on reducing risks and expenses to strengthen the franchise during a challenging period.
1. The document outlines the philosophy and objectives of developing a quality summer training program, focusing on injury prevention, performance enhancement, and mental development.
2. Performance enhancement is discussed, including developing strength, power, speed, and work capacity through various training methods like Olympic lifts, plyometrics, and conditioning circuits.
3. The summer program schedule provides examples of how to incorporate different performance qualities over the 7-8 week period, individualizing training as needed.
Windows Mobile 5.0 Data Access And Storage WebcastVinod Kumar
Windows Mobile has been updated with several new features for data access and storage. SQL Mobile now supports multi-user access to databases, an improved query processor, and administration of databases from a desktop. A new SqlCeResultSet provides a scrollable, updatable cursor for direct data access with performance similar to SqlCeDataReader. The DataSet provides new methods for serialization, copying data, getting changes, and merging data to improve synchronization capabilities. Additional XML support through classes like XmlSerializer, XPath, and XmlSchema bring greater capabilities. Tools have been added for managing device databases from the desktop in Visual Studio.
This document is a quarterly report filed with the SEC by Thermo Fisher Scientific Inc. for the quarter ended March 28, 2009. It includes Thermo Fisher's consolidated balance sheet, income statement, and notes to the financial statements. The balance sheet shows the company had total assets of $21 billion, including $1.5 billion in cash and $8.7 billion in goodwill. Revenues for the quarter were $2.3 billion, with operating income of $190.1 million.
This document is a quarterly report filed with the SEC by Thermo Fisher Scientific Inc. for the quarter ended September 27, 2008. It includes Thermo Fisher's consolidated balance sheet, statement of income, and statement of cash flows for the periods presented. Some key details:
- Thermo Fisher reported revenues of $2.6 billion for the quarter and $7.9 billion for the nine months ended September 27, 2008.
- Net income was $221.5 million for the quarter and $704 million for the nine months.
- In the first nine months of 2008, Thermo Fisher made several acquisitions for aggregate consideration of $142 million in cash, plus $8 million of assumed debt and up to $19
This document is a quarterly report filed with the SEC by Thermo Fisher Scientific Inc. for the quarter ended September 27, 2008. It includes Thermo Fisher's consolidated balance sheet, statement of income, and statement of cash flows for the periods presented. Some key details:
- Thermo Fisher reported revenues of $2.6 billion for the third quarter of 2008 and $7.9 billion for the first nine months of 2008.
- Net income was $221.5 million for the third quarter and $704 million for the first nine months.
- Cash flows from operating activities totaled $960 million for the first nine months of 2008.
This document is a quarterly report filed with the SEC by The Black & Decker Corporation for the quarter ended March 30, 2008. It includes the consolidated statement of earnings, balance sheet, statement of stockholders' equity, and statement of cash flows for the quarter, as well as notes to the financial statements. The financial statements show that net earnings for the quarter were $67.4 million on sales of $1.495 billion, with basic earnings per share of $1.11. Cash flow from operating activities was negative $86.9 million for the quarter. Total stockholders' equity as of March 30, 2008 was $1.389 billion.
This document is a quarterly report filed with the SEC by The Black & Decker Corporation for the quarter ended March 30, 2008. It includes the consolidated statement of earnings, balance sheet, statement of stockholders' equity, and statement of cash flows for the quarter, as well as notes to the financial statements. The financial statements show that for the quarter, net earnings were $67.4 million on sales of $1.495 billion, with basic earnings per share of $1.11. Total assets as of March 30, 2008 were $5.555 billion, with stockholders' equity of $1.389 billion.
This document is Thermo Fisher Scientific's quarterly report filed with the SEC for the quarter ended September 29, 2007. It provides financial statements including the consolidated balance sheet, statement of income, and statement of cash flows. Key details include total revenues of $2.4 billion for the quarter, net income of $218.5 million, and cash and cash equivalents increasing to $830.8 million. It also summarizes two acquisitions completed in the first nine months of 2007, expanding analytical technologies offerings.
This document is Thermo Fisher Scientific's quarterly report filed with the SEC for the quarter ended September 29, 2007. It provides Thermo Fisher's consolidated balance sheet and income statement for the periods shown. The balance sheet shows the company had total assets of $21.2 billion, including $8.5 billion in goodwill. Total liabilities were $6.7 billion and shareholders' equity was $14.4 billion. The income statement shows revenues of $2.4 billion for the quarter and net income of $218.5 million.
This document is a Form 10-Q quarterly report filed by The Black & Decker Corporation with the SEC for the quarter ended September 30, 2007. It includes an unaudited consolidated statement of earnings, balance sheet, statement of cash flows, and notes to the financial statements. The financial statements show that for the quarter ended September 30, 2007, Black & Decker had sales of $1.63 billion, net earnings of $104.6 million, and earnings per share of $1.59 on a diluted basis. Total assets as of September 30, 2007 were $5.58 billion, with stockholders' equity of $1.06 billion.
This document is Thermo Fisher Scientific's quarterly report filed with the SEC for the quarter ended March 31, 2007. It includes Thermo Fisher's consolidated balance sheet, statement of income, and statement of cash flows for the quarter, as well as notes to the financial statements. The notes disclose that in the first quarter of 2007, Thermo Fisher acquired two businesses in Switzerland for $24 million and a small manufacturer of electrostatic discharge products for $5 million total. Thermo Fisher also paid $5 million for various acquisition-related costs and adjustments.
This document is Thermo Fisher Scientific's quarterly report filed with the SEC for the quarter ended March 31, 2007. It includes Thermo Fisher's consolidated balance sheet, statement of income, and notes on significant events from the quarter. The quarter saw revenues of $2.3 billion, operating income of $192 million, and net income of $139 million. Expenses increased along with revenues from the prior year quarter following Thermo Fisher's merger transactions.
This document is Micron Technology's quarterly report filed with the SEC for the quarter ended December 1, 2005. It includes Micron's consolidated financial statements and notes. The financial statements show that for the quarter, Micron's net sales increased to $1.36 billion compared to $1.26 billion in the prior year. Net income was $62.6 million compared to $154.9 million in the previous year. Cash and equivalents increased to $661.1 million from $524.5 million at the end of the previous fiscal year.
The document is a Form 10-Q quarterly report filed by The Black & Decker Corporation with the SEC for the quarter ended October 1, 2006. It includes financial statements such as the consolidated statement of earnings, balance sheet, and cash flows. The report indicates that total sales for the quarter were $1.61 billion, with net earnings of $125.1 million. As of October 1, 2006, the company held $261.9 million in cash and had total current assets of $2.93 billion according to its consolidated balance sheet.
The document is a Form 10-Q quarterly report filed by The Black & Decker Corporation with the SEC for the quarter ended October 1, 2006. It includes the company's consolidated financial statements such as the income statement, balance sheet, and statement of cash flows. It also notes that the financial statements have been prepared following the instructions of Form 10-Q and do not include all information required for complete annual financial statements under GAAP. The report provides the company's key financial results for the quarter including net earnings of $125.1 million and earnings per share of $1.79.
This document is a quarterly report filed by The Black & Decker Corporation with the US Securities and Exchange Commission for the quarter ended July 2, 2006. It includes the company's consolidated statement of earnings, balance sheet, statement of stockholders' equity, statement of cash flows, and notes to the financial statements. The financial statements show that for the quarter, Black & Decker reported net earnings of $152.2 million on sales of $1.7 billion. For the six months ended July 2, 2006, the company reported net earnings of $265.3 million on sales of $3.2 billion.
This document is a Form 10-Q quarterly report filed by The Black & Decker Corporation with the SEC for the quarter ended July 2, 2006. It includes an unaudited consolidated balance sheet, statements of earnings and cash flows, and notes to the financial statements. The financial statements show that for the quarter, Black & Decker reported net earnings of $152.2 million on sales of $1.7 billion. For the six months ended, net earnings were $265.3 million on sales of $3.2 billion. Cash flow from operating activities was $181 million for the six months.
This document is a quarterly report filed by The Black & Decker Corporation with the US Securities and Exchange Commission for the quarter ended September 28, 2008. It includes the company's consolidated financial statements and notes. The financial statements show that for the quarter, net earnings were $85.8 million on sales of $1.57 billion, compared to net earnings of $104.6 million on sales of $1.63 billion in the same quarter last year. For the nine months, net earnings were $249.9 million on sales of $4.71 billion, compared to net earnings of $330.7 million on sales of $4.91 billion in the same period last year. The notes provide accounting policies and
This document is a Form 10-Q quarterly report filed by The Black & Decker Corporation with the SEC for the quarter ended September 28, 2008. It includes the company's consolidated financial statements and notes. The financial statements show that for the quarter, net earnings were $85.8 million on sales of $1.57 billion, compared to net earnings of $104.6 million on sales of $1.63 billion in the same quarter of the previous year. For the nine months, net earnings were $249.9 million on sales of $4.71 billion, compared to net earnings of $330.7 million on sales of $4.91 billion in the previous year. The notes provide accounting policies and
This document is a Form 10-Q quarterly report filed by The Black & Decker Corporation with the SEC for the quarter ended July 1, 2007. It includes an unaudited consolidated statement of earnings, balance sheet, statement of cash flows, and notes to the financial statements. The financial statements show that for the quarter ended July 1, 2007, Black & Decker had net earnings of $118.0 million on sales of $1.7 billion, with basic earnings per share of $1.80. For the six months ended July 1, 2007, Black & Decker had net earnings of $226.1 million on sales of $3.3 billion, with basic earnings per share of $3.46
This document is a Form 10-Q quarterly report filed by The Black & Decker Corporation with the SEC for the quarter ended July 1, 2007. It includes an unaudited consolidated statement of earnings, balance sheet, statement of cash flows, and notes to the financial statements. The financial statements show that for the quarter, net earnings were $118.0 million on sales of $1.699.9 million, compared to net earnings of $152.2 million on sales of $1,696.9 million in the prior year period. Total current assets were $2,921.7 million and total stockholders' equity was $1,338.1 million as of July 1, 2007.
Daimler reported its Q3 2009 results, with the automotive market continuing to experience a slump. Key points include:
- Group sales were €19.3 billion in Q3, with an EBIT of €0.5 billion excluding special items.
- Mercedes-Benz Cars achieved a positive EBIT of €355 million in Q3 due to the availability of new models and cost measures.
- Daimler Trucks reported an EBIT loss of €127 million in Q3 due to weak demand and charges from repositioning.
- Daimler aims to further improve earnings in Q4 through new models and ongoing efficiency programs.
A. Schulman reported fiscal fourth-quarter and full-year 2009 results, with strong margins and excellent liquidity. For the quarter, gross margins reached 16.3% compared to 12.1% last year. North America approached break-even despite lower volumes. Cash on hand exceeded $228 million with over $300 million available in credit lines. For the full year, net sales were $1.28 billion, down 35.5% from last year. Gross margins increased to 13.3% from 11.8% last year, and income from continuing operations was $11.2 million.
BB&T Corporation presented its fourth quarter 2009 investor presentation. The presentation highlighted BB&T's strategic acquisition of Colonial Bank, which enhanced its franchise in key Southeastern markets. The Colonial transaction was deemed financially attractive and expected to be accretive to earnings, exceeding BB&T's merger criteria. BB&T has a proven track record of successfully integrating acquisitions and anticipated achieving annual cost savings of $170 million from the Colonial deal.
Brown & Brown Inc. reported a 1% increase in net income for the third quarter of 2009 compared to the same period in 2008. Total revenue decreased 1% for the quarter. Net income for the first nine months of 2009 was up slightly compared to the same period last year, while total revenue increased slightly. The company stated that results reflected a challenging operating environment with declines in insurable exposure units and soft market rates.
Boston Scientific reported financial results for the third quarter of 2009. Net sales increased 3% to $2.025 billion and adjusted EPS was $0.19. Reported GAAP EPS was $0.13. The company maintained its leadership in the worldwide DES market with a 41% share. Worldwide CRM product sales increased 8% and Endosurgery sales increased 8%. Guidance for Q4 2009 estimates net sales of $2.025-$2.125 billion and adjusted EPS of $0.17-$0.21. Full year 2009 guidance estimates net sales of $8.134-$8.234 billion and adjusted EPS of $0.75-$0.79.
This document is Atheros Communications' quarterly report filed with the SEC for the quarter ended September 30, 2009. It includes Atheros' condensed consolidated financial statements, with assets of $676 million and liabilities of $103 million. It also provides management's discussion of the company's financial condition and operating results, and discusses risks including the economic downturn and competition in the wireless LAN market. The report includes certifications of the CEO and CFO regarding financial controls.
- The document is Apple Inc.'s Form 10-Q quarterly report filed with the SEC for the quarter ended June 27, 2009.
- It provides Apple's condensed consolidated financial statements and notes to the financial statements for the quarter.
- The financial statements show that Apple's net sales increased 12% to $8.3 billion for the quarter compared to $7.5 billion in the same quarter the previous year, while net income increased 15% to $1.2 billion from $1.1 billion.
Hancock Holding Company announced its financial results for the third quarter of 2009. Net income increased 10.7% from the previous quarter to $15.2 million. Key factors were lower loan loss provisions and an expanded net interest margin. Non-performing assets rose slightly while net charge-offs decreased. Total assets declined 3.4% but the company remained well capitalized, with tangible equity ratio rising to 8.71%.
This document provides an agenda and highlights for Walgreen Co.'s 4th quarter and fiscal year 2009 conference call with investors. It includes introductions, a discussion of 4Q and FY performance and strategies, financial results, and a Q&A session. Key metrics highlighted are 7.6% sales growth and a 1.5% decline in net earnings for 4Q, and 7.3% sales growth and a 7% decline in net earnings for FY2009. The document also outlines Walgreen's strategies around healthcare reform, the flu season, and expanding their business model.
1) Infosys Technologies reported financial results for the quarter ending September 30, 2009, with revenues of $1.154 billion, a 5.1% decline from the previous year. Net income was $317 million, a 0.9% decline.
2) For the quarter ending December 31, 2009, Infosys expects revenues between $1.155-1.165 billion, a 1.4-0.5% decline from the previous year, and earnings per share of $0.50, a 13.8% decline.
3) For the full fiscal year ending March 31, 2010, Infosys expects revenues between $4.60-4.62 billion, a 1
Marriott International reported financial results for the third quarter of 2009. Key highlights include:
- Revenue declined to $2.5 billion compared to $3 billion in Q3 2008 due to weaker demand.
- Net income declined 57% to $53 million compared to the prior year.
- REVPAR declined 23.5% worldwide and 20.6% in North America.
- The company added 79 new properties and expects to open over 33,000 new rooms in 2009.
PepsiCo held its 2009 Q3 earnings call on October 8, 2009. In the call, PepsiCo reaffirmed its guidance for 2009 of mid-to-high single digit constant currency net revenue and core EPS growth. PepsiCo also set a 2010 target of 11-13% core constant currency EPS growth, assuming the closing of acquisitions of PBG and PAS in early 2010. PepsiCo reported 5% constant currency net revenue growth and 8% core constant currency EPS growth in Q3 2009. PepsiCo highlighted investments planned for 2010 in areas such as R&D, emerging markets, brands, IT infrastructure, sustainability, and developing its employees.
- Alcoa held its 3rd quarter 2009 earnings conference call on October 7, 2009
- The call discussed Alcoa's financial results for the 3rd quarter of 2009 as well as the current state and outlook of the aluminum market
- Key highlights included income from continuing operations of $73 million, revenue up 9% sequentially, and initiatives offsetting currency and energy headwinds
The Pepsi Bottling Group reported third quarter 2009 results. Comparable diluted EPS was $1.06 and reported diluted EPS was $1.14. Currency neutral operating income grew 10% compared to the prior year on a comparable basis, while reported operating income declined 4% due to foreign exchange impacts. The company remains on track to achieve full-year 2009 guidance of $2.30-$2.40 diluted EPS at the high end of the range and has raised operating free cash flow guidance to approximately $550 million.
Minerva plc presented preliminary results for the year ended 30 June 2009. Key points included successfully restructuring and extending £750 million in loan facilities with no scheduled maturities in the current or next fiscal year. Development projects such as The Walbrook and St. Botolphs were on time and on budget. Tenant interest was improving for office developments in London's financial district despite a difficult real estate market.
This document is Worthington Industries' quarterly report filed with the SEC for the quarter ended August 31, 2009. It includes financial statements and notes for the quarter, as well as a discussion of financial results by management. Some key details include:
- Net sales for the quarter were $417.5 million, down from $913.2 million in the prior year quarter. The company reported a net loss of $4.5 million compared to net income of $79.7 million in the previous year.
- Inventories totaled $232.9 million as of August 31, 2009, down from $270.6 million as of May 31, 2009 as the company worked to reduce inventory levels.
The document provides the agenda and highlights from Walgreen Co.'s 4th quarter and fiscal year 2009 conference call with analysts held on September 29, 2009. It discusses 4th quarter and fiscal year financial results including net sales growth of 7.6% and 7.3% respectively, adjusted earnings per share of $0.44 and $2.02, and prescription sales growth. The document also summarizes Walgreen's strategies around healthcare reform, the H1N1 flu pandemic, expanding health services and 90-day prescriptions to lower costs.
This document is TRC Companies Inc's annual report on Form 10-K for the fiscal year ending June 30, 2009. It provides an overview of the company's business operations, financial highlights, services offered, clients, competition, backlog, employees, contracts with government agencies, regulatory matters, properties, legal proceedings, and financial data. Key information includes descriptions of TRC's engineering, environmental and construction management services, major clients in transportation, energy and development sectors, and discussions of financial results, market risks, and legal cases.
Confirmation of Payee (CoP) is a vital security measure adopted by financial institutions and payment service providers. Its core purpose is to confirm that the recipient’s name matches the information provided by the sender during a banking transaction, ensuring that funds are transferred to the correct payment account.
Confirmation of Payee was built to tackle the increasing numbers of APP Fraud and in the landscape of UK banking, the spectre of APP fraud looms large. In 2022, over £1.2 billion was stolen by fraudsters through authorised and unauthorised fraud, equivalent to more than £2,300 every minute. This statistic emphasises the urgent need for robust security measures like CoP. While over £1.2 billion was stolen through fraud in 2022, there was an eight per cent reduction compared to 2021 which highlights the positive outcomes obtained from the implementation of Confirmation of Payee. The number of fraud cases across the UK also decreased by four per cent to nearly three million cases during the same period; latest statistics from UK Finance.
In essence, Confirmation of Payee plays a pivotal role in digital banking, guaranteeing the flawless execution of banking transactions. It stands as a guardian against fraud and misallocation, demonstrating the commitment of financial institutions to safeguard their clients’ assets. The next time you engage in a banking transaction, remember the invaluable role of CoP in ensuring the security of your financial interests.
For more details, you can visit https://technoxander.com.
South Dakota State University degree offer diploma Transcriptynfqplhm
办理美国SDSU毕业证书制作南达科他州立大学假文凭定制Q微168899991做SDSU留信网教留服认证海牙认证改SDSU成绩单GPA做SDSU假学位证假文凭高仿毕业证GRE代考如何申请南达科他州立大学South Dakota State University degree offer diploma Transcript
Budgeting as a Control Tool in Government Accounting in Nigeria
Being a Paper Presented at the Nigerian Maritime Administration and Safety Agency (NIMASA) Budget Office Staff at Sojourner Hotel, GRA, Ikeja Lagos on Saturday 8th June, 2024.
Dr. Alyce Su Cover Story - China's Investment Leadermsthrill
In World Expo 2010 Shanghai – the most visited Expo in the World History
https://www.britannica.com/event/Expo-Shanghai-2010
China’s official organizer of the Expo, CCPIT (China Council for the Promotion of International Trade https://en.ccpit.org/) has chosen Dr. Alyce Su as the Cover Person with Cover Story, in the Expo’s official magazine distributed throughout the Expo, showcasing China’s New Generation of Leaders to the World.
13 Jun 24 ILC Retirement Income Summit - slides.pptxILC- UK
ILC's Retirement Income Summit was hosted by M&G and supported by Canada Life. The event brought together key policymakers, influencers and experts to help identify policy priorities for the next Government and ensure more of us have access to a decent income in retirement.
Contributors included:
Jo Blanden, Professor in Economics, University of Surrey
Clive Bolton, CEO, Life Insurance M&G Plc
Jim Boyd, CEO, Equity Release Council
Molly Broome, Economist, Resolution Foundation
Nida Broughton, Co-Director of Economic Policy, Behavioural Insights Team
Jonathan Cribb, Associate Director and Head of Retirement, Savings, and Ageing, Institute for Fiscal Studies
Joanna Elson CBE, Chief Executive Officer, Independent Age
Tom Evans, Managing Director of Retirement, Canada Life
Steve Groves, Chair, Key Retirement Group
Tish Hanifan, Founder and Joint Chair of the Society of Later life Advisers
Sue Lewis, ILC Trustee
Siobhan Lough, Senior Consultant, Hymans Robertson
Mick McAteer, Co-Director, The Financial Inclusion Centre
Stuart McDonald MBE, Head of Longevity and Democratic Insights, LCP
Anusha Mittal, Managing Director, Individual Life and Pensions, M&G Life
Shelley Morris, Senior Project Manager, Living Pension, Living Wage Foundation
Sarah O'Grady, Journalist
Will Sherlock, Head of External Relations, M&G Plc
Daniela Silcock, Head of Policy Research, Pensions Policy Institute
David Sinclair, Chief Executive, ILC
Jordi Skilbeck, Senior Policy Advisor, Pensions and Lifetime Savings Association
Rt Hon Sir Stephen Timms, former Chair, Work & Pensions Committee
Nigel Waterson, ILC Trustee
Jackie Wells, Strategy and Policy Consultant, ILC Strategic Advisory Board
Discover the Future of Dogecoin with Our Comprehensive Guidance36 Crypto
Learn in-depth about Dogecoin's trajectory and stay informed with 36crypto's essential and up-to-date information about the crypto space.
Our presentation delves into Dogecoin's potential future, exploring whether it's destined to skyrocket to the moon or face a downward spiral. In addition, it highlights invaluable insights. Don't miss out on this opportunity to enhance your crypto understanding!
https://36crypto.com/the-future-of-dogecoin-how-high-can-this-cryptocurrency-reach/
In World Expo 2010 Shanghai – the most visited Expo in the World History
https://www.britannica.com/event/Expo-Shanghai-2010
China’s official organizer of the Expo, CCPIT (China Council for the Promotion of International Trade https://en.ccpit.org/) has chosen Dr. Alyce Su as the Cover Person with Cover Story, in the Expo’s official magazine distributed throughout the Expo, showcasing China’s New Generation of Leaders to the World.
How to Identify the Best Crypto to Buy Now in 2024.pdfKezex (KZX)
To identify the best crypto to buy in 2024, analyze market trends, assess the project's fundamentals, review the development team and community, monitor adoption rates, and evaluate risk tolerance. Stay updated with news, regulatory changes, and expert opinions to make informed decisions.
What Lessons Can New Investors Learn from Newman Leech’s Success?Newman Leech
Newman Leech's success in the real estate industry is based on key lessons and principles, offering practical advice for new investors and serving as a blueprint for building a successful career.
KYC Compliance: A Cornerstone of Global Crypto Regulatory FrameworksAny kyc Account
This presentation explores the pivotal role of KYC compliance in shaping and enforcing global regulations within the dynamic landscape of cryptocurrencies. Dive into the intricate connection between KYC practices and the evolving legal frameworks governing the crypto industry.
An accounting information system (AIS) refers to tools and systems designed for the collection and display of accounting information so accountants and executives can make informed decisions.
2. UNITED STATES
SECURITIES AND EXCHANGE COMMISSION
Washington, D.C. 20549
FORM 10-Q
QUARTERLY REPORT PURSUANT TO SECTION 13 OF THE SECURITIES EXCHANGE ACT OF 1934
For the quarterly period ended March 31, 2009
Commission File Number: 000-32191
T. ROWE PRICE GROUP, INC.
( Exact name of registrant as specified in its charter)
Maryland 52-2264646
(State of incorporation) (I.R.S. Employer Identification No.)
100 East Pratt Street, Baltimore, Maryland 21202
(Address, including Zip Code, of principal executive offices)
(410) 345-2000
(Registrant’s telephone number, including area code)
Indicate by check mark whether the registrant (1) has filed all reports required to be filed by Section 13 of the Securities Exchange Act of 1934
during the preceding 12 months, and (2) has been subject to such filing requirements for the past 90 days. Yes No
Indicate by check mark whether the registrant is a large accelerated filer, an accelerated filer, a non-accelerated filer, or a smaller reporting
company. See the definitions of “large accelerated filer,” “accelerated filer” and “smaller reporting company” in Rule 12b-2 of the Exchange
Act. (Check one):
Large accelerated filer Accelerated filer Non-accelerated filer Smaller Reporting Company
(Do not check if a smaller reporting company)
Indicate by check mark whether the registrant is a shell company (as defined in Rule 12b-2 of the Exchange Act). Yes No
The number of shares outstanding of the issuer’s common stock ($.20 par value), as of the latest practicable date, April 17, 2009, is
255,477,858 .
The exhibit index is at Item 6 on page 15.
3. PART I — FINANCIAL INFORMATION
Item 1. Financial Statements.
UNAUDITED CONDENSED CONSOLIDATED BALANCE SHEETS
(in millions, except share data)
12/31/2008 03/31/2009
ASSETS
Cash and cash equivalents $ 619.1 $ 621.8
Accounts receivable and accrued revenue 177.3 167.5
Investments in sponsored mutual funds 513.5 488.3
Debt securities held by savings bank subsidiary 166.0 186.1
Other investments 41.9 41.8
Property and equipment 440.1 454.5
Goodwill 665.7 665.7
Other assets 195.8 166.8
Total assets $ 2,819.4 $ 2,792.5
LIABILITIES AND STOCKHOLDERS’ EQUITY
Liabilities
Accounts payable and accrued expenses $ 86.8 $ 83.8
Accrued compensation and related costs 60.7 50.1
Income taxes payable 25.3 22.5
Customer deposits at savings bank subsidiary 157.8 175.5
Total liabilities 330.6 331.9
Commitments and contingent liabilities
Stockholders’ equity
Preferred stock, undesignated, $.20 par value - authorized and unissued 20,000,000 shares — —
Common stock, $.20 par value — authorized 750,000,000; issued 256,856,000 shares in 2008 and
255,443,000 in 2009 51.4 51.1
Additional capital in excess of par value 363.7 364.3
Retained earnings 2,086.8 2,047.7
Accumulated other comprehensive loss (13.1) (2.5)
Total stockholders’ equity 2,488.8 2,460.6
$ 2,819.4 $ 2,792.5
The accompanying notes are an integral part of these statements.
Page 2
4. UNAUDITED CONDENSED CONSOLIDATED STATEMENTS OF INCOME
(in millions, except per-share amounts)
Three months ended
3/31/2008 3/31/2009
Revenues
Investment advisory fees $ 470.1 $ 306.8
Administrative fees 88.8 77.4
Investment income of savings bank subsidiary 1.5 1.5
Total revenues 560.4 385.7
Interest expense on savings bank deposits 1.3 1.2
Net revenues 559.1 384.5
Operating expenses
Compensation and related costs 207.4 175.4
Advertising and promotion 36.5 22.7
Depreciation and amortization of property and equipment 15.0 16.7
Occupancy and facility costs 25.1 25.4
Other operating expenses 45.0 33.7
329.0 273.9
Net operating income 230.1 110.6
Non-operating investment income (loss) 14.3 (36.0)
Income before income taxes 244.4 74.6
Provision for income taxes 92.9 26.4
Net income $ 151.5 $ 48.2
Earnings per share
Basic $ .58 $ .19
Diluted $ .55 $ .19
Dividends declared per share $ .24 $ .25
Weighted average shares
Outstanding 261.7 255.4
Outstanding assuming dilution 273.5 259.0
The accompanying notes are an integral part of these statements.
Page 3
5. UNAUDITED CONDENSED CONSOLIDATED STATEMENTS OF CASH FLOWS
(in millions)
Three months ended
3/31/2008 3/31/2009
Cash flows from operating activities
Net income $ 151.5 $ 48.2
Adjustments to reconcile net income to net cash provided by operating activities
Depreciation and amortization of property and equipment 15.0 16.7
Stock-based compensation expense 18.4 20.6
Intangible asset amortization 0.2 0.1
Other than temporary impairments of investments in sponsored mutual funds — 35.6
Other changes in assets and liabilities 73.5 18.2
Net cash provided by operating activities 258.6 139.4
Cash flows from investing activities
Change in savings bank investments (2.6) (17.5)
Additions to property and equipment (29.9) (30.8)
Other investing activity (1.6) 1.0
Net cash used in investing activities (34.1) (47.3)
Cash flows from financing activities
Repurchases of common stock (294.9) (50.9)
Common share issuances under stock-based compensation plans 18.3 7.7
Dividends paid to stockholders (126.1) (63.9)
Change in savings bank subsidiary deposits 3.3 17.7
Net cash used in financing activities (399.4) (89.4)
Cash and cash equivalents
Net change during period (174.9) 2.7
At beginning of year 785.1 619.1
At end of period $ 610.2 $ 621.8
The accompanying notes are an integral part of these statements.
Page 4
6. UNAUDITED CONDENSED CONSOLIDATED STATEMENT OF STOCKHOLDERS’ EQUITY
(shares in thousands; dollars in millions)
Additional Accumulated
Common capital in other Total
shares Common excess of Retained comprehensive stockholders’
outstanding stock par value earnings loss equity
Balances at December 31, 2008 256,856 $ 51.4 $ 363.7 $ 2,086.8 $ (13.1) $ 2,488.8
Common stock-based compensation plans
activity
Shares issued upon option exercises 383 0.1 7.6 7.7
Restricted shares issued 127 — — —
Stock-based compensation expense 20.6 20.6
Other activity (3) — (0.6) (0.6)
Common shares repurchased (1,920) (0.4) (27.1) (23.4) (50.9)
Comprehensive income
Net income 48.2
Change in net unrealized security holding
losses, net of taxes 10.6
Total comprehensive income 58.8
Dividends declared and related tax benefits 0.1 (63.9) (63.8)
Balances at March 31, 2009 255,443 $ 51.1 $ 364.3 $ 2,047.7 $ (2.5) $ 2,460.6
The accompanying notes are an integral part of these statements.
Page 5
7. NOTES TO UNAUDITED CONDENSED CONSOLIDATED FINANCIAL STATEMENTS
NOTE 1 – THE COMPANY AND BASIS OF PREPARATION.
T. Rowe Price Group derives its consolidated revenues and net income primarily from investment advisory services that its subsidiaries provide
to individual and institutional investors in the sponsored T. Rowe Price mutual funds and other investment portfolios. We also provide our
investment advisory clients with related administrative services, including mutual fund transfer agent, accounting and shareholder services;
participant recordkeeping and transfer agent services for defined contribution retirement plans; discount brokerage; and trust services. While
investors that we serve are primarily domiciled in the United States of America, investment advisory clients outside the United States account
for 10% of our assets under management at March 31, 2009.
Investment advisory revenues depend largely on the total value and composition of assets under our management. Accordingly, fluctuations in
financial markets and in the composition of assets under management impact our revenues and results of operations.
These unaudited condensed consolidated financial statements are prepared in accordance with accounting principles generally accepted in the
United States and reflect all adjustments that are, in the opinion of management, necessary to a fair statement of our results for the interim
periods presented. All such adjustments are of a normal recurring nature.
The unaudited interim financial information contained in these condensed consolidated financial statements should be read in conjunction with
the consolidated financial statements contained in our 2008 Annual Report.
NOTE 2 – INFORMATION ABOUT RECEIVABLES, REVENUES, AND SERVICES.
Accounts receivable from our sponsored mutual funds for advisory fees and advisory-related administrative services aggregate $95.0 million at
December 31, 2008, and $89.9 million at March 31, 2009.
Revenues (in millions) from advisory services provided under agreements with our sponsored mutual funds and other investment clients
include:
Three months ended
3/31/2008 3/31/2009
Sponsored mutual funds in the U.S.
Stock and blended asset $ 282.4 $ 162.0
Bond and money market 51.2 49.7
333.6 211.7
Other portfolios 136.5 95.1
Total investment advisory fees $ 470.1 $ 306.8
The following table summarizes the various investment portfolios and assets under management (in billions) on which we earn advisory fees.
Average during
the first quarter
2008 2009 12/31/2008 3/31/2009
Sponsored mutual funds in the U.S.
Stock and blended asset $ 184.7 $ 109.9 $ 117.9 $ 111.0
Bond and money market 46.5 47.4 46.5 47.8
231.2 157.3 164.4 158.8
Other portfolios 147.7 107.5 111.9 110.0
$ 378.9 $ 264.8 $ 276.3 $ 268.8
Fees for advisory-related administrative services provided to our sponsored mutual funds during the first quarter were $72.0 million in 2008
and $61.7 million in 2009.
NOTE 3 – INVESTMENTS IN SPONSORED MUTUAL FUNDS.
These investments (in millions) include:
Aggregate
Unrealized holding
Aggregate fair
cost Gains Losses value
December 31, 2008
Stock and blended asset funds $ 345.7 $ 6.5 $ (37.4) $ 314.8
Bond funds 185.3 16.3 (2.9) 198.7
$ 531.0 $ 22.8 $ (40.3) $ 513.5
March 31, 2009
Stock and blended asset funds $ 308.1 $ 3.4 $ (20.7) $ 290.8
Bond funds 183.7 15.0 (1.2) 197.5
$ 491.8 $ 18.4 $ (21.9) $ 488.3
Unrealized holding losses that are temporary are attributable to fund holdings with an aggregate fair value of $195.2 million at December 31,
8. 2008, and $168.3 million at March 31, 2009. Unrealized losses totaling $12.6 million on investments valued at $56.8 million at March 31,
2009, have been temporarily impaired on a continuous basis from December 31, 2008. The remaining unrealized losses totaling $9.3 million
were incurred in the first quarter of 2009 on fund investments valued at $111.5 million on March 31, 2009.
Page 6
9. NOTE 4 – FAIR VALUE MEASUREMENTS.
We determine the fair value of our investments using broad levels of inputs as defined by related accounting standards:
Level 1 – quoted prices in active markets for identical securities.
Level 2 – observable inputs other than Level 1 quoted prices including, but not limited to, quoted prices for similar securities, interest rates,
prepayment speeds, and credit risk. These inputs are based on market data obtained from independent sources.
These levels are not necessarily an indication of the risk or liquidity associated with the investments. The following table summarizes our
investments (in millions) at March 31, 2009, that are recognized in our balance sheet using fair value measurements determined based on the
differing levels of inputs.
Level 1 Level 2
Cash equivalents $ 573.7
Investments in sponsored mutual funds
Held as available-for-sale 488.3
Held as trading 1.1
Debt securities held by savings bank subsidiary — $ 186.1
$ 1,063.1 $ 186.1
NOTE 5 – COMMON STOCK.
Unsettled liability for common shares repurchased.
Accounts payable and accrued expenses includes $4.0 million at December 31, 2008, representing the unsettled liability for common stock
repurchases made prior to year-end.
Stock-based grants.
In February 2009, our executive compensation committee of the board of directors reviewed our equity grant program for associates. The
annual grant was bifurcated to achieve the retention and other objectives of the program and align the interests of our associates with those of
our common stockholders. The following table summarizes the status of and changes in our stock option grants during the first quarter of 2009.
Weighted-
average
exercise
Options price
Outstanding at beginning of 2009 39,037,741 $36.52
Semiannual grants 3,129,170 $27.47
Reload grants 15,711 $29.09
New hire grants 7,000 $36.40
Exercised (410,841) $17.46
Forfeited or expired (290,199) $40.85
Outstanding at March 31, 2009 41,488,582 $35.99
Exercisable at March 31, 2009 22,804,652 $29.15
The following table summarizes the status of and changes in our nonvested restricted shares and restricted stock units during the first quarter of
2009.
Restricted Weighted-average
Restricted stock grant-date
shares units fair value
Nonvested at beginning of 2009 475,194 233,539 $54.28
Granted to employees 127,550 80,100 $27.64
Vested (625) (4,250) $50.10
Forfeited (6,850) (750) $53.60
Nonvested at March 31, 2009 595,269 308,639 $48.19
Future stock-based compensation expense.
The following table presents the compensation expense (in millions) to be recognized over the separate vesting periods of the 18,683,930
nonvested options and 903,908 nonvested restricted shares and restricted stock units outstanding at March 31, 2009. Estimated future
compensation expense will change to reflect future option grants, including reloads; future awards of unrestricted shares, restricted shares, and
restricted stock units; changes in estimated forfeitures; and adjustments for actual forfeitures.
Second quarter 2009 $ 21.7
Third quarter 2009 20.7
Fourth quarter 2009 15.5
10. 2010 48.0
2011 through 2014 42.6
Total $ 148.5
Page 7
11. NOTE 6 – INVESTMENT GAINS (LOSSES) AND OTHER COMPREHENSIVE LOSS.
The following table reconciles our net unrealized investment holding losses (in millions) for the first quarter 2009 to that recognized in other
comprehensive loss.
Sponsored Savings
mutual fund bank
investments holdings Total
Net unrealized holding gains (losses) $ (22.2) $ 2.1 $ (20.1)
Reconciling amounts recognized in other investment income (loss)
Other than temporary impairments 35.6 — 35.6
Net losses realized on dispositions .6 .3 .9
Net unrealized holding gains recognized in other comprehensive loss 14.0 2.4 16.4
Deferred income taxes (5.0) (.8) (5.8)
Net gains recognized in other comprehensive loss $ 9.0 $ 1.6 $ 10.6
The components of accumulated other comprehensive loss (in millions) at March 31, 2009, are presented below.
Net unrealized holding losses on Investments in sponsored mutual funds $ (3.5)
Debt securities held by savings bank subsidiary ( .6)
(4.1)
Deferred income tax benefits 1.6
$ (2.5)
Page 8
12. REPORT OF INDEPENDENT REGISTERED PUBLIC ACCOUNTING FIRM
The Board of Directors and Stockholders
T. Rowe Price Group, Inc.:
We have reviewed the condensed consolidated balance sheet of T. Rowe Price Group, Inc. and subsidiaries as of March 31, 2009, the related
condensed consolidated statements of income and of cash flows for the three-month periods ended March 31, 2008 and 2009, and the related
condensed consolidated statement of stockholders’ equity for the three-month period ended March 31, 2009. These condensed consolidated
financial statements are the responsibility of the Company’s management.
We conducted our reviews in accordance with the standards of the Public Company Accounting Oversight Board (United States). A review of
interim financial information consists principally of applying analytical procedures and making inquiries of persons responsible for financial
and accounting matters. It is substantially less in scope than an audit conducted in accordance with the standards of the Public Company
Accounting Oversight Board (United States), the objective of which is the expression of an opinion regarding the financial statements taken as
a whole. Accordingly, we do not express such an opinion.
Based on our reviews, we are not aware of any material modifications that should be made to the condensed consolidated financial statements
referred to above for them to be in conformity with U.S. generally accepted accounting principles.
We have previously audited, in accordance with standards of the Public Company Accounting Oversight Board (United States), the
consolidated balance sheet of T. Rowe Price Group, Inc. and subsidiaries as of December 31, 2008, and the related consolidated statements of
income, cash flows, and stockholders’ equity for the year then ended (not presented herein); and in our report dated February 5, 2009, we
expressed an unqualified opinion on those consolidated financial statements. In our opinion, the information set forth in the accompanying
condensed consolidated balance sheet as of December 31, 2008, is fairly stated, in all material respects, in relation to the consolidated balance
sheet from which it has been derived.
/s/ KPMG LLP
Baltimore, Maryland
April 20, 2009
Page 9
13. Item 2. Management’s Discussion and Analysis of Financial Condition and Results of Operations.
GENERAL.
Our revenues and net income are derived primarily from investment advisory services provided to individual and institutional investors in our
sponsored mutual funds and other managed investment portfolios. Investment advisory clients outside the United States account for 10% of our
assets under management at March 31, 2009.
We manage a broad range of U.S. and international stock, bond, and money market mutual funds and other investment portfolios, which meet
the varied needs and objectives of individual and institutional investors. Investment advisory revenues depend largely on the total value and
composition of assets under our management. Accordingly, fluctuations in financial markets and in the composition of assets under
management affect our revenues and results of operations.
The severe downturn in global financial markets during 2008, and through the early part of 2009, has had a dramatic effect on investor returns
and our financial results. Although we have not experienced a fundamental change in our business model like many other financial services
companies, the collateral damage from the global economic woes has significantly reduced our assets under management, related advisory
revenues, the value of our corporate mutual fund investments, and our net income. In response, we have been vigilant about our expense levels
and initiated a series of expense reduction measures that have been accelerated since the equity market’s steep fourth quarter 2008 decline.
These efforts included the April 21, 2009 decision to reduce our workforce by 288 associates, or 5.5%. The short-term cost resulting from
severance and related expenses will lower our operating earnings by about $2.5 million in the second quarter of 2009. We expect to realize net
savings of approximately $17 million over the following four quarters, including a roughly $6 million reduction of our administrative fee
revenues that in turn saves a similar amount of annual expenses for our sponsored mutual funds. Through year-to-date attrition, retirements and
the workforce reduction, our number of associates is now down 8.6% from the 5,385 employed at the beginning of the year. Overall, we expect
that our cost savings efforts could reduce our 2009 operating expenses by as much as $120 million from our 2007 level of spending.
We remain debt-free with substantial liquidity and resources that are available to help us ride through the current market crises while prudently
managing the firm for the long-term. Our financial stability allows us to take advantage of attractive growth opportunities, invest in key
capabilities including investment professionals and technologies and, most importantly, provide our clients with strong investment management
expertise and service both now and in the future. While we believe 2009 will be a tough year for consumers and companies alike around the
world, we think the investment environment will improve as we move into the latter half of the year and efforts to get the global economy back
on track gain traction.
BACKGROUND.
Credit markets loosened modestly in early 2009 though rate spreads remain high by historical standards. Equity markets were down for the
sixth consecutive quarter, despite a significant March rally. Fears of a lingering recession and an uncertain timeframe for economic recovery
are weighing on investors. The Federal Reserve’s target funds rate remains in a range of 0% to .25%, the lowest in history. Businesses are in a
cost cutting mode, and households are reducing spending and increasing savings.
U.S. stock indexes fell in the first quarter of 2009. The broad S&P 500 Index of large-cap companies in leading industries of the U.S. economy
registered an 11.0% loss while the NASDAQ Composite Index, which is heavily weighted with technology companies, was down 3.1%
(excluding dividends). Performance of stocks outside the United States was mixed in dollar terms as the MSCI EAFE Index, which measures
the performance of mostly large-cap stocks in Europe, Australasia and the Far East, experienced a 13.9% loss, while the MSCI Emerging
Markets Index returned 1.0% for the quarter.
U.S. Treasury yields rose during the first quarter as supply forecasts grew dramatically. The yield curve steepened with yields increasing more
for bonds with longer maturities. The yield on the benchmark 10-year U.S. Treasuries was 2.71% at March 31, 2009, up 46 basis points from
the end of 2008. On the shortest side of the yield curve, the one-month yield was only .17%, up from .11% at year-end 2008.
Returns for other fixed income securities were mixed in the first quarter with gains from the most oversold sectors recouping a portion of their
steep 2008 losses. Municipal bonds, high-yield issues, and dollar-denominated emerging markets bonds saw gains. The Barclays Capital
Municipal Bond Index gained 4.2% while the Credit Suisse High Yield Index gained 5.8%. Longer-term investment-grade corporate issues
produced weak to poor results as the Barclays Capital U.S. Aggregate Index gained .1% and the Barclays Capital Global Aggregate Ex-U.S.
Dollar Bond Index lost 5.4%.
In this unsettled financial environment, investors entrusted net inflows of $4.5 billion to our management during the first quarter of 2009. Total
assets under our management ended March 31, 2009 at $268.8 billion, down 2.7% from the beginning of the year. The change (in billions)
during the first quarter occurred as follows.
Assets under management at beginning of year $ 276.3
Net cash inflows
Sponsored mutual funds in the U.S. 1.8
Other portfolios 2.7
4.5
Market valuation changes and income (12.0)
Change during the period (7.5)
Assets under management at end of period $ 268.8
Assets under management at March 31, 2009, include $187.1 billion in stock and blended asset investment portfolios and $81.7 billion in fixed
14. income investment portfolios. The investment portfolios that we manage consist of $158.8 billion in the T. Rowe Price mutual funds distributed
in the United States and $110.0 billion in other investment portfolios, including separately managed accounts, sub-advised funds, and other
sponsored investment portfolios including common trust funds and mutual funds offered to investors outside the U.S. and through variable
annuity life insurance plans.
Page 10
15. Our $488.3 million corporate-owned portfolio of investments in sponsored mutual funds at March 31, 2009, includes a net unrealized loss of
$3.5 million, including fund holdings with aggregate unrealized gains of $18.4 million and aggregate unrealized losses of $21.9 million. The
aggregate unrealized losses are considered temporary and, accordingly are recognized in accumulated other comprehensive losses in
stockholders’ equity. Unrealized losses totaling $12.6 million on investments valued at $56.8 million at March 31, 2009, have been temporarily
impaired on a continuous basis from December 31, 2008. The remaining unrealized losses totaling $9.3 million were incurred in the first
quarter of 2009 on fund investments valued at $111.5 million. See Item 3, Quantitative and Qualitative Disclosures About Market Risk, in this
report for further discussion about the possible recognition of impairments to our investments in sponsored mutual funds.
We incur significant expenditures to attract new investment advisory clients and additional investments from our existing clients. These efforts
involve costs that generally precede any future revenues that we might recognize from additions to our assets under management.
RESULTS OF OPERATIONS — First quarter 2009 versus first quarter 2008.
Investment advisory revenues decreased about 35%, or $163.3 million, to $306.8 million in the first quarter of 2009 as average assets under our
management decreased $114.1 billion to $264.8 billion. The average annualized fee rate earned on our assets under management was 47.0 basis
points during the first quarter of 2009, down from the 49.2 basis points earned in the year 2008, as lower equity market valuations resulted in a
greater percentage of our assets under management being attributable to lower fee fixed income portfolios. Extended stress on the financial
markets and resulting lower equity valuations in following quarters will result in lower average assets under our management and lower
investment advisory fees as compared to prior periods.
Net revenues decreased 31%, or $174.6 million, to $384.5 million. Operating expenses fell $55.1 million to $273.9 million in the first quarter
of 2009, down nearly 17% from the comparable 2008 quarter. Overall, net operating income for the first quarter of 2009 decreased
$119.5 million, or 51.9%, to $110.6 million. The results of our cost saving efforts dampened the impact of lower assets under management and
advisory revenues on our operating margin in the first quarter of 2009, which at 28.8% was virtually unchanged from the 29.1% margin in the
fourth quarter of 2008. Net income fell 68.2% or $103.3 million in the first quarter of 2009 versus the comparable 2008 quarter. Diluted
earnings per share also decreased to $.19, down $.36 or 65.5% from the first quarter last year.
Investment advisory revenues earned from the T. Rowe Price mutual funds distributed in the United States decreased 36.5%, or $121.9 million,
to $211.7 million. First quarter average mutual fund assets were $157.3 billion, down 32% from the average for the comparable 2008 quarter.
Mutual fund assets at March 31, 2009 were $158.8 billion, down $5.6 billion from December 31, 2008, but $1.5 billion higher than the first
quarter 2009 average.
Overall, net inflows to the mutual funds were $1.8 billion during the first quarter of 2009. The stock funds saw net inflows of $1.2 billion,
including $.7 billion to the Equity Index 500 fund and $.4 billion to the Value fund. Bond and money funds had $.6 billion of net inflows.
During the first quarter of 2009, our net fund inflows originated largely in our target-date Retirement Funds, which in turn invest in the other
T. Rowe Price funds. Decreases in market valuations, net of income, lowered our mutual fund assets under management by $7.4 billion during
the 2009 quarter.
Investment advisory revenues earned on the other investment portfolios that we manage decreased $41.4 million, or 30.3%, to $95.1 million.
Average assets in these portfolios were $107.5 billion during the first quarter of 2009, down $40.2 billion or 27.2% from the comparable 2008
quarter. Lower market valuations, net of income, reduced our assets under management in these portfolios by $4.6 billion during the 2009
quarter. Net inflows of $2.7 billion, primarily from U.S. and international institutional investors, only partially offset these market losses.
Administrative fees decreased $11.4 million to $77.4 million. The change in these revenues includes a $2.4 million reduction of 12b-1
distribution fees recognized on lower assets under management in the Advisor and R classes of our sponsored mutual funds. The balance of the
change is attributable to a decrease in our servicing activities to the mutual funds and their related investors that is generally offset by a similar
decrease in related operating expenses that are incurred to provide these services.
Our largest expense, compensation and related costs, decreased $32.0 million, or more than 15% compared to the first quarter of 2008. This
decrease includes a reduction in our annual bonus pool of $28.3 million from the 2008 quarter in response to the recent and ongoing
unfavorable financial market conditions that have negatively impacted our operating results. At March 31, 2009, we employed 5,230
associates, down 2.9% from the end of 2008 and up slightly from the number at the end of the first quarter of 2008. As discussed above, year-
to-date attrition, retirements and our workforce reduction have reduced our staffing 8.6% from the beginning of 2009.
Advertising and promotion expenditures decreased 38%, or $13.8 million, compared to the first quarter of 2008, and are down $8.0 million
from the fourth quarter of 2008. We reduced advertising and promotion expense in response to the change of investor sentiment in this
uncertain and volatile market environment. We currently estimate that our advertising and promotion expenditures for the second quarter of
2009 will be about 30% lower than the preceding quarter and that our full-year 2009 costs will be about 25% lower than 2008. We vary our
level of spending based on market conditions and investor demand as well as our efforts to expand our investor base in the United States and
abroad.
Occupancy and facility costs together with depreciation expense increased $2 million versus the 2008 quarter. We have recently been
expanding and renovating our facilities to accommodate business demands, though these initiatives have been moderated in 2009.
Other operating expenses were down $11.3 million, or 25% from the first quarter of 2008, including $2.4 million of lower distribution expenses
recognized on lower assets under management sourced from financial intermediaries that distribute our Advisor and R classes of mutual fund
shares. These distribution costs are offset by an equal decrease in our administrative revenues recognized from the 12b-1 fees discussed above.
Our cost control efforts also resulted in $7.2 million of reductions in travel and related costs, professional fees and other third party services.
Page 11
16.
17. Our non-operating investment activity resulted in a net loss of $36.0 million in the first quarter of 2009 as compared to a net gain of
$14.3 million for the comparable 2008 quarter. This change of $50.3 million is primarily attributable to $35.6 million of unrealized other than
temporary impairments of our investments in sponsored mutual funds that were recognized in the 2009 quarter because their fair value had
been below cost for an extended period. The significant declines in fair value that have occurred over the last three quarters are generally
attributable to the ongoing adverse market conditions discussed in the Background section above. See also the market risk discussion below in
Item 3. The following table details our related mutual fund investment gains and losses during the first quarter.
2008 2009 Change
Other than temporary impairments recognized $ (35.6) $ (35.6)
Capital gain distributions received $ .9 — (.9)
Net gain (loss) realized on fund dispositions .9 (.6) (1.5)
Net gain (loss) recognized on fund holdings $ 1.8 $ (36.2) $ (38.0)
Lower income from our money market holdings due to the significantly lower interest rate environment, losses in our other investments, and
the lack of any net foreign currency gains in the 2009 quarter account for the balance of the change.
The first quarter 2009 provision for income taxes as a percentage of pretax income is 35.4%, down from the 38.4% for the full year 2008,
primarily to reflect certain adjustments made to our prior years’ tax accruals. We currently estimate that our effective tax rate for the full year
will be 38.0%.
CAPITAL RESOURCES AND LIQUIDITY.
Operating activities during the first quarter of 2009 provided cash flows of $139.4 million, down $119.2 million from the 2008 quarter,
including a $103.3 million decrease in net income. Other than temporary impairments of our investments in sponsored mutual funds of
$35.6 million were more than offset by timing differences of $55.3 million in the cash settlement of our assets and liabilities. Our interim
operating cash outflows do not include bonus compensation that is accrued throughout the year before being substantially paid out in
December.
Net cash used in investing activities totaled $47.3 million, up $13.2 million from the 2008 period, primarily from a net increase of
$14.9 million in the investments held by our savings bank subsidiary that results from an increase in customer deposits.
Net cash used in financing activities was $89.4 million in the first quarter of 2009, down $310 million from the 2008 quarter. Compared to the
2008 quarter, we expended $244 million less to repurchase our common shares. Further, during the first quarter of 2008, we changed our policy
regarding the timing of dividend payments such that our quarterly dividends are declared and paid in the same quarter. Therefore, our cash
outflows for the first quarter of 2008 included the payout of dividends for the fourth quarter 2007 and the first quarter of 2008. This resulted in
our dividends paid in 2009 decreasing $62.2 million from the 2008 period.
Our cash and mutual fund investments at March 31, 2009, were more than $1.1 billion, and we have no debt. Given the availability of these
financial resources, we do not maintain an available external source of liquidity.
NEW ACCOUNTING STANDARDS.
On April 9, 2009, the Financial Accounting Standards Board issued three staff positions related to fair value measurements, other-than-
temporary impairments, and interim disclosures of fair value. We will adopt this new guidance in the second quarter 2009. As we do each
reporting period, we have also considered all other newly issued but not adopted standards applicable to our operations and the preparation of
our consolidated statements. We do not believe that any issued standard yet to be adopted will have a material effect on our financial position
or results of operation.
FORWARD-LOOKING INFORMATION.
From time to time, information or statements provided by or on behalf of T. Rowe Price, including those within this report, may contain certain
forward-looking information, including information or anticipated information relating to: our revenues, net income and earnings per share;
changes in the amount and composition of our assets under management; our expense levels and possible expense savings; our estimated
effective income tax rate; and our expectations regarding financial markets and other conditions. Readers are cautioned that any forward-
looking information provided by or on behalf of T. Rowe Price is not a guarantee of future performance. Actual results may differ materially
from those in forward-looking information because of various factors including, but not limited to, those discussed below and in Item 1A, Risk
Factors, of our Form 10-K Annual Report for 2008. Further, forward-looking statements speak only as of the date on which they are made, and
we undertake no obligation to update any forward-looking statement to reflect events or circumstances after the date on which it is made or to
reflect the occurrence of unanticipated events.
Page 12
18. Our future revenues and results of operations will fluctuate primarily due to changes in the total value and composition of assets under our
management. Such changes result from many factors including, among other things: cash inflows and outflows in the T. Rowe Price mutual
funds and other managed investment portfolios; fluctuations in the financial markets around the world that result in appreciation or depreciation
of the assets under our management; our introduction of new mutual funds and investment portfolios; and changes in retirement savings trends
relative to participant-directed investments and defined contribution plans. The ability to attract and retain investors’ assets under our
management is dependent on investor sentiment and confidence; the relative investment performance of the Price mutual funds and other
managed investment portfolios as compared to competing offerings and market indexes; the ability to maintain our investment management
and administrative fees at appropriate levels; competitive conditions in the mutual fund, asset management, and broader financial services
sectors; and our level of success in implementing our strategy to expand our business. Our revenues are substantially dependent on fees earned
under contracts with the Price funds and could be adversely affected if the independent directors of one or more of the Price funds terminated
or significantly altered the terms of the investment management or related administrative services agreements. Non-operating investment
income (loss) will also fluctuate primarily due to the size of our investments and changes in their market valuations.
Our future results are also dependent upon the level of our expenses, which are subject to fluctuation for the following or other reasons:
changes in the level of our advertising expenses in response to market conditions, including our efforts to expand our investment advisory
business to investors outside the United States and to further penetrate our distribution channels within the United States; variations in the level
of total compensation expense due to, among other things, bonuses, stock option grants, other incentive awards, changes in our employee count
and mix, and competitive factors; our success in implementing and realizing upon existing and planned cost reduction efforts; any goodwill
impairment that may arise; fluctuation in foreign currency exchange rates applicable to the costs of our international operations; expenses and
capital costs, such as technology assets, depreciation, amortization, and research and development, incurred to maintain and enhance our
administrative and operating services infrastructure; unanticipated costs that may be incurred to protect investor accounts and the goodwill of
our clients; and disruptions of services, including those provided by third parties, such as facilities, communications, power, and the mutual
fund transfer agent and accounting systems.
Our business is also subject to substantial governmental regulation, and changes in legal, regulatory, accounting, tax, and compliance
requirements may have a substantial effect on our operations and results, including but not limited to effects on costs that we incur and effects
on investor interest in mutual funds and investing in general, or in particular classes of mutual funds or other investments.
Item 3. Quantitative and Qualitative Disclosures About Market Risk.
Our revenues and net income are based primarily on the value of assets under our management. Accordingly, declines in financial market
values like those recently experienced directly and negatively impact our investment advisory revenues, as well as our investment income and
net income.
Financial market conditions have been extremely volatile and financial security valuations have declined. Our $488.3 million portfolio of
investments in sponsored mutual funds at March 31, 2009, includes a net unrealized loss of $3.5 million comprising fund holdings with
aggregate unrealized gains of $18.4 million and aggregate unrealized losses of $21.9 million. The aggregate unrealized losses are considered
temporary and, accordingly are recognized in accumulated other comprehensive losses in stockholders’ equity. Unrealized losses totaling
$12.6 million on investments valued at $56.8 million at March 31, 2009, have been temporarily impaired on a continuous basis from
December 31, 2008, while the balance of $9.3 million of unrealized losses arose in the first quarter of 2009.
Because our fund holdings are considered available-for-sale securities, we recognize unrealized losses that are considered temporary in other
comprehensive income. We review the carrying amount of each investment on a quarterly basis and recognize an impairment charge in non-
operating investment income (loss) whenever an unrealized loss is considered other than temporary. A mutual fund holding with an impairment
that has persisted daily throughout the six months between quarter-ends is generally presumed to have an other than temporary impairment
unless there is persuasive evidence, such as an increase in value subsequent to quarter-end, to overcome that presumption. It is possible that we
will determine at June 30, 2009, or at a subsequent quarter end, that continuous unrealized losses in one or more of our mutual fund
investments have become other-than-temporary impairments. We could also sell our fund positions before a subsequent quarter-end reporting
date and recognize previously unrealized losses. The amount and timing of any subsequent charge will be dependent on future market
performance.
There has been no other material change in the information provided in Item 7A of our Form 10-K Annual Report for 2008.
Page 13
19. Item 4. Controls and Procedures.
Our management, including our principal executive and principal financial officers, has evaluated the effectiveness of our disclosure controls
and procedures as of March 31, 2009. Based on that evaluation, our principal executive and principal financial officers have concluded that our
disclosure controls and procedures as of March 31, 2009, are effective at the reasonable assurance level to ensure that the information required
to be disclosed by us in the reports that we file or submit under the Securities Exchange Act of 1934, including this Form 10-Q quarterly report,
is recorded, processed, summarized and reported, within the time periods specified in the Securities and Exchange Commission’s rules and
forms, and to ensure that information required to be disclosed by us in the reports that we file or submit under the Exchange Act is accumulated
and communicated to our management, including our principal executive and principal financial officers, or persons performing similar
functions, as appropriate to allow timely decisions regarding required disclosure.
Our management, including our principal executive and principal financial officers, has evaluated any change in our internal control over
financial reporting that occurred during the first quarter of 2009, and has concluded that there was no change during the first quarter of 2009
that has materially affected, or is reasonably likely to materially affect, our internal control over financial reporting.
PART II — OTHER INFORMATION
Item 1. Legal Proceedings.
From time to time, various claims against us arise in the ordinary course of business, including employment-related claims. In the opinion of
management, after consultation with counsel, the likelihood that an adverse determination in one or more pending claims would have a material
adverse effect on our financial position or result of operations is remote.
Item 1A. Risk Factors.
There has been no material change in the information provided in Item 1A of our Form 10-K Annual Report for 2008.
Item 2. Unregistered Sales of Equity Securities and Use of Proceeds.
(c) Repurchase activity during the first quarter of 2009 conducted pursuant to the Board of Directors’ June 5, 2008, authorization follows.
Total Number of
Total Average Shares Purchased Maximum Number
Number of Price as Part of Publicly of Shares that May
Shares Paid per Announced Yet Be Purchased
Month Purchased Share Program Under the Program
January 920,320 $28.72 920,320 13,759,110
February 800,000 25.14 800,000 12,959,110
March 200,000 21.73 200,000 12,759,110
Total 1,920,320 $26.50 1,920,320
Page 14
20. Item 4. Submission of Matters to a Vote of Security Holders.
The annual meeting of our stockholders was held on April 8, 2009. The proxy statement and solicitation pertaining to this meeting were
previously filed with the Commission. Shares eligible to vote were 255,943,130 at the record date of February 6, 2009. The nine nominees for
the Board of Directors were elected to hold office until the next annual meeting of stockholders and until their respective successors are elected
and qualify. The tabulation of votes was:
Nominee For Against Abstain
Edward C. Bernard 218,764,780 4,961,422 388,793
James T. Brady 221,329,549 2,408,570 376,877
J. Alfred Broaddus, Jr. 221,813,573 1,920,745 380,677
Donald B. Hebb, Jr. 206,788,673 16,985,330 340,993
James A.C. Kennedy 219,066,093 4,739,001 309,902
Brian C. Rogers 218,661,436 5,081,431 372,129
Dr. Alfred Sommer 222,046,022 1,666,433 402,541
Dwight S. Taylor 221,963,324 1,761,550 390,121
Anne Marie Whittemore 215,712,682 8,082,714 319,599
The appointment of KPMG LLP as the company’s independent registered public accounting firm for 2009 was ratified by a vote of
216,475,715 for; 7,327,990 against; and 311,290 abstentions.
Item 5. Other Information.
On April 22, 2009, we issued a press release reporting our results of operations for the first quarter of 2009. A statement regarding our
workforce reduction of 288 associates is included in the press release. We expect to incur net costs of about $2.5 million in the second quarter
2009 related to this workforce reduction. A copy of that press release is furnished herewith as Exhibit 99.
The information in this Item 5 and in Exhibit 99 shall not be deemed filed for purposes of Section 18 of the Securities Exchange Act of 1934,
nor shall it be deemed incorporated by reference in any filing under the Securities Act of 1933.
Item 6. Exhibits.
The following exhibits required by Item 601 of Regulation S-K are furnished herewith.
3(i).1 Charter of T. Rowe Price Group, Inc., as Amended by Articles of Amendment dated April 10, 2008. (Incorporated by reference from
Form 10-Q Report for the quarterly period ended March 31, 2008; Accession No. 0000950133-08-001597.)
3(ii) Amended and Restated By-Laws of T. Rowe Price Group, Inc. as of February 12, 2009. (Incorporated by reference from Form 8-K
Current Report as of February 17, 2009; Accession No. 0000950133-09-000369.)
10.08 Amended and Restated 2007 Non-Employee Director Equity Plan as of February 12, 2009, including forms of agreements for awards
granted after that date.
10.16.3 Second Amendment to 2001 Stock Incentive Plan dated December 12, 2008.
10.17.2 First Amendment to 2004 Stock Incentive Plan dated December 12, 2008.
15 Letter from KPMG LLP, independent registered public accounting firm, re unaudited interim financial information.
31(i).1 Rule 13a-14(a) Certification of Principal Executive Officer.
31(i).2 Rule 13a-14(a) Certification of Principal Financial Officer.
32 Section 1350 Certifications.
99 Press release issued April 22, 2009, reporting our results of operations for the first quarter of 2009.
SIGNATURES
Pursuant to the requirements of the Securities Exchange Act of 1934, the registrant has duly caused this report to be signed on its behalf by the
undersigned thereunto duly authorized on April 22, 2009.
T. Rowe Price Group, Inc.
by: /s/ Kenneth V. Moreland
Vice President and Chief Financial Officer
Page 15
21.
22. Exhibit 10.08
T. ROWE PRICE GROUP, INC.
AMENDED AND RESTATED
2007 NON-EMPLOYEE DIRECTOR EQUITY PLAN
1) Purpose
T. Rowe Price Group, Inc., a Maryland corporation (the “Company”), maintains the T. Rowe Price Group, Inc. 2007 Non-Employee
Director Equity Plan (the “Plan”) for the benefit of Non-Employee Directors of the Company. The Plan is intended to benefit the
Company by providing Non-Employee Directors of the Company with a proprietary stake in the Company’s future success and,
thereby, aligning their interests with those of the Company’s stockholders. The Plan hereby is amended and restated, as set forth
herein, effective as of February 12, 2009, to be known hereafter as the T. Rowe Price Group, Inc. Amended and Restated 2007
Non-Employee Director Equity Plan.
The Plan provides for equity grants to Non-Employee Directors which they may choose to receive in the form of stock options,
restricted shares, or stock units.
2) Definitions
Under this Plan, except where the context otherwise indicates, the following definitions apply:
a) “ Account ” means a bookkeeping reserve account to which Stock Units are credited on behalf of Non-Employee Directors.
b) “ Annual Meeting ” means the annual meeting of the stockholders of the Company at which members of the Board are to be
elected.
c) “ Award ” means a share of Common Stock, Stock Unit, or Option granted under this Plan.
d) “ Board ” means the Board of Directors of the Company.
e) “ Change in Control ” means the earliest to occur of any of the following events, construed in accordance with Code section
409A:
i) Any one person or more than one person acting as a group acquires, or has acquired during the twelve-month period
ending on the date of the most recent acquisition by such person or group, beneficial ownership of thirty-five percent or more of
the total voting power of the Company’s then outstanding voting securities;
ii) A majority of the members of the Company’s Board is replaced during any twelve-month period by directors whose
appointment or election is not endorsed or approved by a majority of the members of the Board who were members of the
Board of Directors prior to the initiation of the replacement; or
23. iii) Any one person or more than one person acting as a group acquires, or has acquired during the twelve-month period
ending on the date of the most recent acquisition by such person or group, assets of the Company that have a total gross fair
market value of forty percent or more of the total gross fair market value of all of the assets of the Company immediately prior to
the initiation of the acquisition.
f) “ Code ” means the Internal Revenue Code of 1986, as amended, and any regulations promulgated thereunder.
g) “ Common Stock ” means the common stock, par value $.20 per share, of the Company.
h) “ Company ” means T. Rowe Price Group, Inc., a Maryland corporation.
i) “ Effective Date ” means April 12, 2007.
j) “ Election Form ” means the form prescribed by the Plan Administrator on which a Non-Employee Director specifies the form
in which his or her Initial Director Grant or Periodic Grants are to be granted.
k) “ Fair Market Value ” means, with respect to the Common Stock, as of any date:
i) if the principal market for the Common Stock (as determined by the Plan Administrator if the Common Stock is listed or
admitted to trading on more than one exchange or market) is a national securities exchange or an established securities
market, the official closing price per share of Common Stock for the regular market session on that date on the principal
exchange or market on which the Common Stock is then listed or admitted to trading or, if no sale is reported for that date, on
the last preceding day on which a sale was reported;
ii) if the principal market for the Common Stock is not a national securities exchange or an established securities market, the
average of the highest bid and lowest asked prices for the Common Stock on that date as reported on a national quotation
system or, if no prices are reported for that date, on the last preceding day on which prices were reported; or
iii) if the Common Stock is neither listed or admitted to trading on a national securities exchange or an established securities
market, nor quoted by a national quotation system, the value determined by the Plan Administrator in good faith.
l) “ Incumbent Director ” means a person who is a Non-Employee Director immediately before and on the Effective Date.
2
24. m) “ Initial Director Grant ” means the initial grant of Restricted Shares or Stock Units to a Non-Employee Director pursuant to
Section 5(a).
n) “ Initial Plan Year ” means the first Plan Year commencing on the Effective Date.
o) “ New Director ” means a person who (i) is first elected or appointed as a Non-Employee Director on or after the Effective
Date, or (ii) first becomes a Non-Employee Director on or after the Effective Date.
p) “ Non-Employee Director ” means a member of the Board who, at the relevant time, is not an employee of the Company or
of any direct or indirect subsidiary or affiliate of the Company.
q) “ Option ” means a nonstatutory option to purchase shares of Common Stock.
r) “ Periodic Grant ” means the grant of Options, Restricted Shares or Stock Units to a Non-Employee Director pursuant to
Section 5(b).
s) “ Plan ” means this T. Rowe Price Group, Inc. 2007 Non-Employee Director Equity Plan, as amended from time to time.
t) “ Plan Administrator ” means the Nominating and Corporate Governance Committee of the Board.
u) “ Plan Share Reserve ” means the maximum number of shares of Common Stock that may be issued with respect to Awards
granted under the Plan.
v) “ Plan Year ” shall be the twelve-month period coinciding with the calendar year; provided, however, that the first Plan Year
shall be a shorter period commencing on the Effective Date and ending on December 31, 2007.
w) “ Restricted Shares ” means shares of Common Stock that, upon issuance, are nontransferable and subject to forfeiture for
a specified period.
x) “ Stock Unit ” means a share equivalent credited to a Non-Employee’s Account and which represents the Company’s
unfunded promise to deliver one share of Common Stock upon a specified future event or date.
y) “ Termination Date ” means the date on which a Non-Employee Director ceases to serve as a member of the Board and has
otherwise incurred a “separation from service” within the meaning of Code section 409A.
3
25. 3) Administration
The Plan Administrator shall have full authority to administer the Plan. This authority includes, without limitation, authority (i) to
interpret and construe any provision of the Plan and the terms of any Award granted under it, (ii) to modify in its discretion the
number, timing and/or terms of Awards to be granted pursuant to Section 5 of the Plan without requiring stockholder approval
thereof, and (iii) in general, to make all other determinations advisable for the administration of the Plan to achieve its stated
purpose. This authority also includes the authority, as the Plan Administrator may deem necessary or advisable, to adopt such
rules, regulations, agreements, guidelines and instruments for administering the Plan and for conducting the Plan Administrator’s
business. A majority of the members of the Plan Administrator shall constitute a quorum for the transaction of business and the
vote of a majority of those members present at any meeting at which a quorum is present shall decide any question brought
before that meeting. In lieu of a meeting, the Plan Administrator may take action by unanimous written consent. Decisions of the
Plan Administrator shall be final and binding on all parties. The Plan Administrator shall have the power to delegate all or any of its
non-discretionary duties to one or more designees. To the maximum extent permitted by law, no member of the Plan
Administrator or its designees shall be liable for any action taken or decision made in good faith relating to the Plan or any Award.
To the maximum extent permitted by law and by the Company’s charter and by-laws, the members of the Plan Administrator and
its designees shall be indemnified by the Company in respect of all their activities under the Plan.
4) Stock Reserved for the Plan
a) Plan Share Reserve. Subject to the following provisions of this Section 4 and adjustments as provided in Section 8 of the
Plan, the Plan Share Reserve shall be equal to 750,000 shares of Common Stock.
b) Adjustments to Plan Share Reserve. If any Award, or portion of an Award, under the Plan expires or terminates unexercised,
becomes unexercisable or is forfeited or otherwise terminated, surrendered or canceled as to any shares, the shares subject to
such Award shall thereafter be available for further Awards under the Plan.
c) Share Accounting. Any shares of Common Stock subject to Options granted under the Plan shall be counted against the
Plan Share Reserve set forth in Section 4(a) as one share of Common Stock for every one share subject to such Award. Any
shares of Common Stock subject to Awards other than Options shall be counted against the Plan Share Reserve set forth in
Section 4(a) as three and one-third shares of Common Stock for every one share subject to such Award.
d) Source of Shares . The Company shall reserve for issuance pursuant to this Plan such number of shares of Common Stock
as may from time to time be granted or subject to Awards hereunder. The source of the shares of Common Stock issued pursuant
to this Plan may be, in the discretion of the Board or the Plan Administrator, authorized and unissued shares, shares purchased
on the open market, or shares derived from any other proper source. In the absence of any specific determination by the Board or
the Plan Administrator, the source shall be authorized and unissued shares.
4
26. 5) Grants of Equity Awards
a) Initial Director Grant . Each person first elected or appointed as a Non-Employee Director on or after the Effective Date, shall
be granted, as of the close of business on the date of the first regular meeting of the Board held on or after the date of such Non-
Employee Director’s election or appointment, an Initial Director Grant of 4,000 Restricted Shares or 4,000 Stock Units, in such
form as the Non-Employee Director shall have elected pursuant to Section 7. Notwithstanding the foregoing sentence, a person
who was an employee of the Company or any of its subsidiaries or affiliates at any time within three years before becoming a
Non-Employee Director shall not be entitled to receive an Initial Director Grant.
b) Periodic Grants . Each Non-Employee Director shall be granted, as of the close of business on the third business day
following the earnings release for the first and third fiscal quarter of each year, in such form as the Non-Employee Director shall
have elected pursuant to Section 7, an Award of 4,000 Options, 1,200 Restricted Shares, or 1,200 Stock Units.
c) Non-duplication of Grants . Notwithstanding the provisions of Section 5(b) above, Periodic Grants will not be granted to a
Non-Employee Director during the calendar year in which the Non-Employee Director receives his or her Initial Director Grant.
d) Grant Eligibility . No individual shall be granted an Award under this Plan unless such individual is a Non-Employee Director
on the applicable grant date.
e) Modification of Awards . The Plan Administrator in its discretion may modify the number and/or timing of the Awards to be
granted pursuant to the provisions of Sections 5(a) and 5(b) above without stockholder approval.
6) Terms of Awards
a) Terms of Options . Each Option granted under this Plan on or after February 12, 2009, shall:
i) have an exercise price for each share subject thereto equal to the Fair Market Value of the Common Stock on the grant
date;
ii) be unvested and not be exercisable as to any shares when granted and, subject to the provisions of Section 8(b)(ii), shall
(A) if granted as an Initial Director Grant, become vested and exercisable in full as of the close of business on the earlier of the
Non-Employee Director’s date of death or the first anniversary of the grant date, and (B) if granted as a Periodic Grant, become
vested and exercisable in full as of the close of business on the earliest of the Non-Employee Director’s date of death, the first
anniversary of the grant date, or the day immediately prior to the Annual Meeting that occurs in the next calendar year following
the year in which the grant date occurs, provided that in the case of subclause (A) or (B) of this Section 6(a)(ii) the holder is a
member of the Board on the applicable vesting date;
5
27. iii) terminate and no longer be exercisable, to the extent unvested, when the Non-Employee Director ceases to be a member
of the Board for any reason other than death, and to the extent vested, on the earlier to occur of the expiration of ten years after
the grant date of such Option or five years after the Non-Employee Director ceases to be a member of the Board for any
reason; and
iv) provide for payment of the exercise price via cash, check, or tender of shares of Common Stock, by way of a broker-
assisted cashless exercise in accordance with procedures established by the Plan Administrator, or any combination thereof.
Options granted under this Plan are not transferable by the Non-Employee Director otherwise than by will or the laws of descent
and distribution and are exercisable during the Non-Employee Director’s lifetime only by the Non-Employee Director; except that
with the consent of the Plan Administrator, Options may be transferred to a family member or a trust, partnership or the like for the
benefit of the Non-Employee Director or such family members. No assignment or transfer of an Option, or of the rights
represented thereby, whether voluntary or involuntary, by operation of law or otherwise, except by will, the laws of descent and
distribution or by consent of the Plan Administrator, shall vest in the assignee or transferee any interest or right therein
whatsoever, but immediately upon any attempt to assign or transfer the Option the same shall terminate and be of no force or
effect. No Option holder shall have any rights as a stockholder with respect to any shares of Common Stock covered by an Option
until the date a stock certificate or certificates representing such shares is issued or such other evidence of issuance of the shares
to the person is entered on the records of the Company. Except as provided in Section 8, no adjustment for dividends or
otherwise shall be made if the record date is prior to the date of issuance of the shares of Common Stock purchased pursuant to
exercise of the Option.
b) Terms of Restricted Shares . All Restricted Shares granted under this Plan on or after February 12, 2009, shall:
i) be unvested and forfeitable upon grant and shall not be transferable or subject in any manner to anticipation, alienation,
sale, exchange, assignment, pledge, encumbrance, or garnishment, or in any other manner made subject to a hedge
transaction or puts and calls prior to becoming vested in full;
ii) subject to the provisions of Section 8(b)(ii), (A) if granted as an Initial Director Grant, become vested in full, no longer
subject to risk of forfeiture and transferable (subject to any restrictions imposed by law and any then-applicable stock ownership
and retention guidelines for directors of the Company) as of the close of business on the earlier of the Non-Employee Director’s
date of death or the first anniversary of the grant date, and (B) if granted as a Periodic Grant, become vested in full, no longer
subject to risk of forfeiture and transferable (subject to any restrictions imposed by law and any then-applicable stock ownership
and retention guidelines for directors of the Company) as of the close of business on the earliest of the Non-Employee
Director’s date of death, the first anniversary of the grant date, or the day immediately prior to the Annual Meeting that occurs in
the next calendar year following the year in which the grant date occurs, provided that in the case of subclause (A) or (B) of this
Section 6(b)(ii) the holder is a member of the Board on the applicable vesting date; and
6
28. iii) entitle the holder to all the rights of a stockholder, including voting and rights to receive dividends and distributions with
respect to such shares, but shall be subject to transfer restrictions until vested.
If the Non-Employee Director ceases to be a member of the Board for any reason other than death, all unvested Restricted
Shares will be forfeited to the Company upon such cessation without any consideration paid therefor. The Non-Employee Director
will be reflected on the Company’s books as the owner of record of the shares of Common Stock represented by the Restricted
Shares as of the grant date. The Company will retain the shares in uncertificated book entry form with a notation as to their
nontransferability, until the Restricted Shares become vested and nonforfeitable. As soon as practicable after vesting of the
Restricted Shares, the Company will remove any notation of nontransferability of the shares on its books and, unless requested to
deliver a share certificate to the Non-Employee Director, or to deliver shares electronically or in certificate form to the Non-
Employee Director’s designated broker on the director’s behalf, for such vested shares, the Company will retain the shares in
uncertificated book entry form. All regular cash dividends payable with respect to the Restricted Shares will be paid directly to the
Non-Employee Director on the applicable dividend payment dates, notwithstanding that the shares are then unvested.
c) Terms of Stock Units. All Stock Units granted under this Plan on or after February 12, 2009, shall:
i) be unvested and subject to risk of forfeiture when granted and, subject to the provisions of Section 8(b)(ii), shall (A) if
granted as an Initial Director Grant, become vested in full and no longer subject to risk of forfeiture as of the close of business
on the earlier of the Non-Employee Director’s date of death or the first anniversary of the grant date, and (B) if granted as a
Periodic Grant, become vested in full as of the close of business on the earliest of the Non-Employee Director’s date of death,
the first anniversary of the grant date, or the day immediately prior to the Annual Meeting that occurs in the next calendar year
following the year in which the grant date occurs, provided that in the case of subclause (A) or (B) of this Section 6(c)(i) the
holder is a member of the Board on the applicable vesting date;
ii) at all times be nontransferable and not subject in any manner to anticipation, alienation, sale, exchange, transfer,
assignment, pledge, encumbrance, or garnishment, or in any other manner made subject to a hedge transaction or puts and
calls; and
iii) be settled in shares of Common Stock, to the extent vested, upon the Non-Employee Director’s Termination Date, unless
the Non-Employee director is a “specified employee” (as defined under Code section 409A and determined in good faith by the
Plan Administrator). If a Non-Employee Director is a “specified employee” on the Termination Date, the restricted stock units to
be settled on account of the occurrence of that Termination Date will be settled within 15 days after the end of the six-month
period beginning on that Termination Date or, if earlier, within 15 days after the appointment of the personal representative or
executor of the estate after the Non-Employee Director’s death.
7
29. If the Non-Employee Director ceases to be a member of the Board for any reason other than death, all unvested Stock Units will
be forfeited upon such cessation without any consideration paid therefor. Upon settlement, the Company shall issue to the unit
holder, or the unit holder’s estate as applicable, a number of shares of Common Stock equal to the number of whole, vested Stock
Units then credited to the unit holder’s Account; any fractional Stock Units will be settled in cash. The grant of a Stock Unit shall
not entitle the unit holder to voting or other rights as a stockholder until shares of Common Stock are issued to the unit holder
upon settlement. If the Company declares a cash dividend payable to the holders of its Common Stock, then, on the dividend
payment date, each unit holder who has Stock Units credited to an Account on the record date for such dividend will be credited
with dividend equivalents in the form of additional, vested Stock Units. The number of Stock Units to be credited shall be equal to
the quotient determined by dividing (a) by (b), where (a) is the product of (i) the cash dividend payable per share of Common
Stock, multiplied by (ii) the number of whole Stock Units credited to the unit holder’s Account as of the record date, and (b) is the
Fair Market Value of a share of Common Stock on the dividend payment date. The Plan Administrator shall determine, in its
discretion, whether to credit fractional units to the Account, eliminate fractional units, or pay out fractional units in cash to the unit
holder on the dividend payment date. If the unit holder’s Stock Units have been settled after the record date but prior to the
dividend payment date, any Stock Units that would be credited pursuant to the preceding sentence shall be settled on or as soon
as practicable after the dividend payment date.
d) Award Agreement . Each Award granted under this Plan shall be evidenced by an agreement, in a form approved by the
Plan Administrator, which shall be subject to the terms and conditions of the Plan.
7) Election Procedures
a) Election Timing Rules. Each Non-Employee Director shall elect the form in which he or she will be granted Awards under the
Plan by filing with the treasurer of the Company an Election Form in accordance with the following rules:
i) Initial Plan Elections . For the Initial Plan Year, Incumbent Directors must file an Election Form prior to or within 14 days
after the Effective Date. Such elections shall apply to Awards that are scheduled to be granted, under the terms of Section 5,
after the written notice is received by the treasurer of the Company.
ii) Elections by New Directors . Each New Director must file an Election Form prior to or within 14 days after becoming a
Non-Employee Director. Such election shall apply to Awards that are scheduled to be granted, under the terms of Section 5,
after the written notice is received by the treasurer of the Company.
8
30. iii) Modification of Elections. Election Forms will remain in effect from year to year unless modified prospectively by the Non-
Employee Director for a subsequent Plan Year. A Non-Employee Director may modify an existing Election Form for any
subsequent Plan Year by filing a new Election Form with the treasurer of the Company by December 31 st of the year preceding
the Plan Year for which the modification is to become effective. A Non-Employee Director may not modify an Election Form with
respect to Awards to be granted during a Plan Year after the Plan Year has commenced.
b) Default Election . If a Non-Employee Director does not have a valid Election Form in effect at the relevant time, the Non-
Employee Director’s Award shall be made in the form of Stock Units.
8) Adjustments for Corporate Transactions and Other Events
a) Capital Adjustments . The Plan Share Reserve, the number of shares covered by each outstanding Award or reflected in the
Accounts, the exercise price per share of each outstanding Option, and the number of Awards to be granted pursuant to Section 5
shall all be proportionately adjusted automatically for any increase or decrease in the number of issued shares of Common Stock
of the Company resulting from a subdivision or consolidation of shares or other capital adjustment, or the payment of a stock
dividend or other increase or decrease in such shares, effected without receipt of consideration by the Company. In the case of
other changes in the Company’s capitalization, adjustments shall be made to reflect the transaction as determined by the Plan
Administrator to be necessary or appropriate. The Plan Administrator shall determine the treatment of fractional shares and
fractional cents that arise with respect to outstanding Awards as a result of the adjustments to be made under this Section 8(a),
which treatment may include the cancellation of fractional shares without payment therefor. The Plan Administrator will make the
adjustments and determinations under this Section 8(a), and its determination will be final, binding and conclusive.
b) Merger, Consolidation, or Other Events.
i) Non-Change in Control Transactions. Except with respect to the transactions set forth in Section 8(a), in the event of any
change affecting the Common Stock, the Company or its capitalization, by reason of a spin-off, split-up, dividend,
recapitalization, merger, consolidation or share exchange, other than any such change that is part of a transaction resulting in a
Change in Control of the Company, the Plan Administrator, in its discretion and without the consent of the holders of the
Awards, may make (A) appropriate adjustments to the maximum number and kind of shares reserved for issuance or with
respect to which Awards may be granted under the Plan, as provided in Section 4 of the Plan; and (B) any adjustments in
outstanding Awards, including but not limited to modifying the number, kind and price of securities subject to the Awards.
ii) Change in Control Transactions. In the event of any transaction resulting in a Change in Control of the Company, (A) all
outstanding Awards will become fully vested immediately before and contingent upon the Change in Control; (B) all outstanding
Options not exercised prior to or upon the Change in Control will terminate at the effective time of such Change in Control
unless provision is made in connection with the transaction for the continuation, assumption or settlement of such Options by,
or for the substitution of equivalent options of, the surviving or successor entity or a parent thereof; and (C) all Stock Units
credited to Accounts as of the Change in Control will be settled in shares or in cash at the discretion of the Board upon the
Change in Control or as soon as practicable thereafter but in no event later than the close of the calendar year in which the
Change in Control occurs.
9
31. iii) Other. In the event of a change in the Company’s Common Stock which is limited to a change in the designation thereof
to “Capital Stock” or other similar designation, or to a change in the par value thereof, or from par value to no par value, without
increase in the number of issued shares, the shares resulting from any such change shall be deemed to be Common Stock
within the meaning of the Plan.
9) Amendment, Modification and Termination of the Plan
The Board may amend, modify, or terminate this Plan at any time and from time to time; provided, however, that without the
degree of stockholder approval required by the Company’s charter or bylaws, applicable law, or the rules and regulations of any
exchange or trading market on which the Company’s securities are then traded, the Board may not: (a) increase the number of
shares of Common Stock that may be issued under this Plan, (b) modify the share accounting provisions set forth in Section 4(c)
of the Plan, or (c) modify the requirements as to eligibility for participation in this Plan. No amendment, modification, or termination
of the Plan shall adversely affect the rights of a holder of an Award without the written consent of the holder. In the event that the
Plan is terminated, the Company will continue to maintain the Accounts and settle Stock Units credited thereto only in accordance
with the provisions of Code section 409A. Notwithstanding anything herein to the contrary, the Plan Administrator is authorized to
amend the Plan in such manner as it may determine to be necessary or desirable to ensure the Plan’s compliance with
Section 409A of the Code or other applicable law or the rules and regulations of any exchange or trading market on which the
Company’s securities are then traded.
10) Claims Procedure
a) Named Fiduciary . The Plan Administrator shall be the named fiduciary for purposes of this claims procedure.
b) Initial Claims . If a Non-Employee Director or other person does not receive timely payment of any benefits which he or she
believes are due and payable under the Plan, the claimant of such benefit must file a written claim with the Plan Administrator
within 60 days from the date payment or delivery is refused. The Plan Administrator shall review the written claim and, if the claim
is denied in whole or in part, shall provide, in writing and within 90 days of receipt of such claim, the specific reasons for such
denial and reference to the provisions of this Plan upon which the denial is based and any additional material or information
necessary to perfect the claim. Such written notice shall further indicate the steps to be taken by the claimant if a further review of
the claim denial is desired.
10