This document is Toll Brothers' quarterly report filed with the SEC for the period ending January 31, 2002. It includes condensed consolidated financial statements such as the balance sheet, income statement, and cash flow statement. Revenues increased from the prior year due to higher housing sales. Net income increased to $44.5 million from $39.9 million a year ago. Earnings per share increased to $1.27 from $1.10 in the prior year period. The company issued $150 million in senior subordinated notes in November 2001 to fund general corporate purposes including land acquisition.
This document is Toll Brothers' quarterly report filed with the SEC for the quarter ended April 30, 2002. It includes condensed consolidated financial statements such as the balance sheet, income statement, and cash flow statement. It also provides notes to the financial statements and discusses forward-looking statements and risk factors that may affect future results.
This document is Toll Brothers' quarterly report filed with the SEC for the quarter ending January 31, 2001. It includes condensed financial statements showing increased revenues and net income compared to the prior year. Assets totaled $2.2 billion as of January 31, 2001, with inventory comprising most of the assets. Total liabilities were $1.4 billion, leaving stockholders' equity of $801.8 million. For the quarter, housing and land sales increased compared to the prior year, resulting in net income of $39.9 million, up significantly from $22.4 million in the previous year.
This document is Toll Brothers' Form 10-Q quarterly report filed with the SEC for the quarter ended April 30, 2001. It summarizes Toll Brothers' financial position, including revenues of $989.8 million, total assets of $2.3 billion, and total liabilities of $1.5 billion. It also reports net income of $85.7 million and earnings per share of $2.36 for the six months ended April 30, 2001. Toll Brothers' inventory increased to $2.1 billion as of April 30, 2001.
This document is Toll Brothers' quarterly report filed with the SEC for the quarter ended July 31, 2003. It includes condensed consolidated financial statements such as the balance sheet, income statement, and cash flow statement. It also provides notes to the financial statements and discusses items such as revenues, costs, assets, liabilities, and stockholders' equity. The report indicates that for the quarter ended July 31, 2003, Toll Brothers had revenues of $693.7 million, net income of $68.2 million, and basic earnings per share of $0.98.
This document is Toll Brothers Inc.'s quarterly report filed with the SEC for the quarter ended July 31, 2001. It summarizes Toll Brothers' financial position, including an increase in total assets to $2.4 billion from $2 billion the prior year. Revenues increased to $1.5 billion from $1.2 billion the prior year. Net income increased to $145 million from $88 million the prior year. The report provides condensed financial statements, notes to the financial statements, and management's discussion of financial results.
This document is Toll Brothers Inc.'s Form 10-Q filing for the quarterly period ended July 31, 2000. It provides condensed financial statements and notes for the periods ended July 31, 2000 and 1999 including the balance sheet, income statement, and cash flow statement. Key details include revenues of $1.2 billion for the nine months ended July 31, 2000 compared to $1 billion for the same period in 1999. Net income was $87.6 million for the nine months of 2000 compared to $68.1 million in 1999.
This document is a Form 10-Q quarterly report filed by Toll Brothers, Inc. with the SEC for the quarter ended January 31, 2003. It includes:
1) Condensed consolidated balance sheets comparing assets/liabilities as of January 31, 2003 and October 31, 2002, showing increased cash/inventory and decreased debt.
2) Condensed consolidated statements of income for the quarters ended January 31, 2003 and 2002, though no financial figures are provided.
3) Notes to the condensed consolidated financial statements and standard sections including management's discussion of financial results, market risk, controls and procedures, and certifications. The document provides required regulatory financial disclosures for Toll Brothers' first fiscal
This document is Toll Brothers' Form 10-Q quarterly report filed with the SEC for the quarter ended April 30, 2003. It includes condensed consolidated financial statements such as the balance sheet, income statement, and cash flow statement, as well as notes to the financial statements. The financial statements show that for the quarter ended April 30, 2003, Toll Brothers had revenues of $607.9 million, net income of $52.9 million, and basic earnings per share of $0.76. Cash and cash equivalents increased to $211.3 million from $102.3 million at the end of the previous fiscal year.
This document is a Form 10-Q quarterly report filed by KB Home with the SEC for the quarter ending May 31, 2004. The summary includes:
1) KB Home reported total revenues of $2.9 billion for the six months ended May 31, 2004, with construction pretax income of $258.7 million and mortgage banking pretax income of $4.5 million.
2) The balance sheet shows KB Home's assets including $65.6 million in cash, $429.2 million in receivables, and $3.55 billion in construction inventories as of May 31, 2004.
3) The document provides KB Home's financial statements and notes for the quarter,
This document is PACCAR Inc's quarterly report (Form 10-Q) filed with the SEC for the quarter ended June 30, 2003. It includes:
1) Financial statements including income statements, balance sheets, and cash flow statements for the quarter and year-to-date.
2) Notes to the financial statements providing additional details on accounting policies, inventory valuation, and new accounting standards.
3) Certification by management of the accuracy of the financial statements and disclosure of any material changes to internal controls.
The report provides investors with PACCAR's consolidated financial position and operating results for the quarter in compliance with SEC regulations.
This document is PACCAR Inc's quarterly report on Form 10-Q for the period ending September 30, 2002 filed with the SEC. It includes PACCAR's consolidated financial statements and notes. The financial statements show that net sales for PACCAR's Truck and Other segment increased 35% to $1.9 billion for the third quarter of 2002 compared to $1.4 billion for the same period of 2001. Net income increased to $128.9 million for the third quarter of 2002 from $39.4 million in the third quarter of 2001. For the first nine months of the year, net income increased to $249.8 million from $123.2 million in the same period of 2001.
This document is a quarterly report filed by The AES Corporation with the US Securities and Exchange Commission for the quarter ended June 30, 2002. It includes consolidated financial statements and notes for AES, including statements of operations, balance sheets, cash flows, and notes to the financial statements. The report provides key financial information on AES's revenues, costs, assets, liabilities, equity, cash flows, and accounting policies for the periods presented. It discloses that AES has operations in both regulated utility and non-regulated generation segments.
This document is Health Grades, Inc.'s quarterly report on Form 10-Q for the quarter ended March 31, 2009 filed with the SEC. It includes Health Grades' condensed consolidated balance sheets, statements of income, and statements of cash flows for the quarters ended March 31, 2009 and 2008. It also includes notes to the financial statements describing Health Grades' accounting policies and recently adopted accounting pronouncements. The financial statements show that for the quarter ended March 31, 2009, Health Grades had revenue of $12.4 million, net income of $1.6 million, and cash and cash equivalents of $14.8 million.
This document is a Form 10-Q quarterly report filed by The Black & Decker Corporation with the SEC for the quarter ended July 1, 2007. It includes an unaudited consolidated statement of earnings, balance sheet, statement of cash flows, and notes to the financial statements. The financial statements show that for the quarter ended July 1, 2007, Black & Decker had net earnings of $118.0 million on sales of $1.7 billion, with basic earnings per share of $1.80. For the six months ended July 1, 2007, Black & Decker had net earnings of $226.1 million on sales of $3.3 billion, with basic earnings per share of $3.46
This document is a Form 10-Q quarterly report filed with the SEC by KB Home. It provides financial statements and other information for the quarter ended May 31, 2005. The financial statements show total revenues of $3.77 billion for the six months ended May 31, 2005, with net income of $304.3 million. Construction operations generated pretax income of $460.1 million and mortgage banking operations generated pretax income of $978,000. The report also includes information on cash flows, segment reporting policies, and accounting policies for stock-based compensation.
- The document is International Paper Company's Form 10-Q quarterly report filed with the SEC for the quarter ended June 30, 2002.
- It includes financial statements such as statements of earnings, balance sheets, and cash flows for the periods ended June 30, 2002 and 2001.
- It also includes management's discussion and analysis of financial condition and results of operations, quantitative and qualitative disclosures about market risk, legal proceedings, and other required disclosures.
This document is a Form 8-K filed by YRC Worldwide Inc. with the Securities and Exchange Commission on February 13, 2006. It summarizes that YRC is revising its previously reported diluted earnings per share for the three and twelve months ended December 31, 2005 due to an accounting error related to foreign currency entries at its Canadian subsidiary Reimer Express. The revision has no impact on operating income. YRC also reports lower than estimated capital expenditures for 2005.
This document is Toll Brothers' quarterly report filed with the SEC for the quarter ended April 30, 2002. It includes condensed consolidated financial statements such as the balance sheet, income statement, and cash flow statement. It also provides notes to the financial statements and discusses forward-looking statements and risk factors that may affect future results.
The document is Toll Brothers Inc.'s quarterly report filed with the SEC for the period ended January 31, 2001. It includes condensed consolidated financial statements and notes. The financial statements show that for the quarter ended January 31, 2001, Toll Brothers' housing sales revenues increased to $458.4 million compared to $334.2 million for the same period the previous year. Toll Brothers' net income for the quarter increased to $39.9 million compared to $22.4 million for the same quarter the previous year. The cash flow statement shows that Toll Brothers issued $200 million in senior subordinated notes in January 2001 to fund general corporate purposes including land acquisitions.
This document is Toll Brothers Inc.'s quarterly report filed with the SEC for the quarter ended July 31, 2001. It summarizes Toll Brothers' financial position, including an increase in total assets to $2.4 billion from $2 billion the prior year. It also reports the company's operating results for the quarter, with housing revenues of $573 million and net income of $59 million. Finally, it provides additional details on Toll Brothers' inventory, subordinated notes issued, stock repurchase program, and cash flows for the period.
This document is Toll Brothers' Form 10-Q quarterly report filed with the SEC for the quarter ended April 30, 2001. It summarizes Toll Brothers' financial position, including revenues of $989.8 million, total assets of $2.3 billion, and total liabilities of $1.5 billion. It also reports net income of $85.7 million and earnings per share of $2.36 for the six months ended April 30, 2001. Toll Brothers' inventory increased to $2.1 billion as of April 30, 2001.
- The document is a Form 10-Q quarterly report filed with the SEC by Toll Brothers, Inc. for the quarterly period ended January 31, 2003.
- It includes condensed consolidated financial statements such as the balance sheet, income statement, and cash flow statement for the periods ended January 31, 2003 and January 31, 2002.
- It also includes notes to the financial statements and disclosures on inventory, accounting policies, earnings per share, stock splits, and forward-looking statements.
This document is Toll Brothers Inc.'s Form 10-Q filing for the quarterly period ended July 31, 2000. It provides condensed financial statements and notes for the periods ended July 31, 2000 and 1999 including the balance sheet, income statement, and cash flow statement. Key details include revenues of $1.2 billion for the nine months ended July 31, 2000 compared to $1 billion for the same period in 1999. Net income was $87.6 million for the nine months of 2000 compared to $68.1 million in 1999.
This document is Toll Brothers' Form 10-Q/A filed with the SEC, which provides quarterly financial results and other information. It summarizes that for the quarter ended July 31, 2002, Toll Brothers reported housing and land sales revenues of $577.8 million, net income of $53.5 million, and basic earnings per share of $0.76. It also discloses total assets of $2.77 billion and total liabilities of $1.71 billion as of the end of the reported quarter.
This document is Toll Brothers' quarterly report filed with the SEC for the quarter ended July 31, 2003. It includes condensed consolidated financial statements such as the balance sheet, income statement, and cash flow statement. It also provides notes to the financial statements and discusses items such as revenues, costs, assets, liabilities, earnings per share, and cash flows. In summary, it presents Toll Brothers' financial performance and position for the quarter and provides important disclosures regarding its business and accounting.
This document is the quarterly report on Form 10-Q filed by A.M. Castle & Co. for the quarter ending March 31, 2009. It includes condensed consolidated financial statements and notes. The financial statements show that net sales were $252 million for the quarter, with net income of $480 thousand. Cash flow from operations was $4.7 million for the quarter. The report provides the company's condensed financial position, results of operations, and cash flows for the quarter, as well as notes regarding new accounting standards adopted and the company's acquisition of Metals U.K. Group in January 2008.
- The document is International Paper Company's Form 10-Q filing for the quarterly period ended September 30, 2002.
- It includes International Paper's consolidated financial statements including statements of earnings, balance sheets, cash flows, and shareholders' equity for the periods ended September 30, 2002 and 2001.
- It also includes management's discussion and analysis of financial condition and results of operations, quantitative and qualitative market risk disclosures, and controls and procedures.
The document is Danaher Corporation's Form 10-Q quarterly report filed with the SEC for the quarter ended March 28, 2008. It includes Danaher's consolidated condensed financial statements and management's discussion and analysis. The financial statements show that for Q1 2008, Danaher's sales increased 20% to $3.028 billion compared to $2.521 billion in Q1 2007. Net earnings increased 9% to $276.5 million compared to $254.8 million. Earnings per share from continuing operations increased 7% to $0.87 basic and $0.83 diluted.
This document is a Form 10-Q quarterly report filed by Tenet Healthcare Corporation with the SEC for the quarter ended August 31, 2002. It includes condensed consolidated financial statements such as the balance sheet, income statement, and cash flow statement. The balance sheet shows the company had total assets of $13.7 billion as of August 31, 2002, including $3.4 billion in goodwill. The income statement shows net income of $338 million for the quarter. Cash flow from operations was $696 million for the quarter.
This document is an SEC filing by YRC Worldwide Inc. announcing revisions to its previously reported financial results for the three and twelve months ended December 31, 2005. Specifically, YRC revised its diluted EPS downward from $5.12 to $5.07 for the full year, and from $1.34 to $1.30 for the quarter. YRC also revised its adjusted diluted EPS downward slightly. The revisions were due to an accounting error related to foreign currency treatment at a Canadian subsidiary. YRC stated the error was corrected and would not impact future results.
This document is Toll Brothers, Inc.'s quarterly report filed with the SEC for the quarter ended January 31, 2004 on Form 10-Q. It includes Toll Brothers' condensed consolidated financial statements, management's discussion and analysis of financial condition and results of operations, and certifications regarding disclosure controls and procedures. The financial statements show that for the quarter ended January 31, 2004, Toll Brothers had revenues of $597.9 million, net income of $50.1 million, and earnings per share of $0.68 on a basic basis and $0.62 on a diluted basis. Inventory increased to $3.27 billion from $3.08 billion at the end of the prior fiscal year.
This document is Danaher Corporation's Form 10-Q filing for the quarter ended September 30, 2005. It provides financial statements and disclosures including the consolidated balance sheet, statement of earnings, statement of cash flows, and notes to the financial statements. The notes describe Danaher's acquisitions and divestitures during the nine months ended September 30, 2005, including 10 business acquisitions and the ongoing evaluation of assumptions for its largest acquisition, Leica Microsystems AG. The filing also indicates that Danaher's total comprehensive income for the periods presented represents net earnings plus the change in cumulative foreign translation adjustment.
This document is Visteon Corporation's quarterly report filed with the SEC for the quarter ended March 31, 2003. It includes Visteon's consolidated statement of income and balance sheet for the first quarter of 2003 and the prior year quarter. For the first quarter of 2003, Visteon reported a net loss of $15 million compared to a net loss of $338 million in the prior year quarter, which included a $265 million charge from a change in accounting. Total sales for the first quarter were $4.7 billion. As of March 31, 2003, Visteon had $1.4 billion in cash and cash equivalents.
johnson controls FY2009 1st Quarter Form 10-Q finance8
This document is a Form 10-Q quarterly report filed by Johnson Controls with the SEC for the quarter ended December 31, 2008. It includes Johnson Controls' condensed consolidated financial statements and notes for the quarter, as well as a management discussion and analysis. The financial statements show that net sales were $7.3 billion for the quarter, with a net loss of $608 million. Total assets were $22.3 billion as of December 31, 2008. The report provides required quarterly disclosures and financial information to the SEC and shareholders.
This document is Dover Corporation's Form 10-Q quarterly report filed with the SEC for the quarter ending March 31, 2007. It includes Dover's condensed consolidated financial statements and notes for the quarter, as well as management's discussion and analysis of financial condition and results of operations. Some key details include:
- Revenue for the quarter was $1.78 billion, up 18% from the same period in 2006.
- Net earnings for the quarter were $128.9 million, down from $203.8 million in the prior year due to a loss from discontinued operations.
- Cash flow from operating activities was $61.1 million for the quarter.
This document is International Paper Company's Form 10-Q quarterly report filed with the SEC for the quarter ended June 30, 2001. It includes International Paper's consolidated financial statements and notes for the quarter. The financial statements show a net loss of $313 million for the quarter compared to net earnings of $270 million in the prior year period. Revenues decreased slightly to $6.7 billion for the quarter from $6.8 billion in the prior year. Costs and expenses increased to $6.9 billion from $6.1 billion due primarily to restructuring and impairment charges.
This document is Danaher Corporation's Form 10-Q quarterly report filed with the SEC for the quarter ended March 30, 2007. The summary provides:
1) Danaher reports sales of $2.56 billion for the quarter, up from $2.14 billion in the prior year quarter. Net earnings were $254.8 million compared to $215.7 million in the prior year.
2) During the quarter, Danaher completed five business acquisitions and acquired the remaining shares of Vision Systems Limited that it did not already own.
3) Danaher adopted the provisions of FIN 48 on accounting for uncertainties in income taxes, which resulted in a $63.3 million decrease to
The interim report summarizes the company's financial performance in the first half of 2008. Key points include record profitability with an operating margin of 16.6% and net margin of 12.1%. Vehicle and service sales grew 15% and 30% respectively. Earnings per share increased 36% to SEK 12.52. The outlook predicts earnings in 2008 will be higher than 2007 due to continued strong demand outside of Europe.
1) Scania reported record earnings in the first half of 2008, with operating margin reaching 16.6% and net margin at 12.1%.
2) Scania is pursuing profitable growth through increasing vehicle and service sales. Revenue grew 15% while EBIT grew 30% in the first half of 2008.
3) Scania's vision is to reach annual production of 150,000 vehicles while maintaining a flexible cost structure and focus on customer productivity and uptime.
The interim report summarizes the company's performance in the first three quarters of 2008. Key highlights include operating margins reaching an all-time high of 15.8% and EBIT growth of 25%. Revenue and profitability increased due to higher vehicle and service volumes, price increases, and favorable product mix. However, order bookings for trucks have declined 51% in Western Europe and 34% in Central and Eastern Europe. While flexible production has helped, earnings forecasts for 2009 are not provided due to economic uncertainty. The service business continues growing with increased traffic and workshop utilization.
HQ Bank has experienced volume driven growth in its credit portfolio over the past 9 months of 2008. While the portfolio increased 8% in local currencies, bad debt provisions increased in several markets. The bank has a well balanced portfolio that is diversified across exposure levels, geographic areas, and products. It maintains a conservative refinancing policy and manages risks through matched funding and credit risk management.
1) Scania reported all-time high earnings in 2008 with operating income of SEK 12,512 million. However, deliveries declined 18% in Q4 as the company adjusted production rates due to decreased demand in Europe.
2) While the trucks and services segment grew profits through price increases, this was partially offset by negative impacts from lower deliveries, used vehicles, raw materials, and R&D spending.
3) Scania's flexible production system and focus on reducing inventory and postponing investments helped cash flow, but tied up capital increased with capacity investments. Outlook remains uncertain given rapid demand fall in Q4 2008 and high industry inventory levels.
The interim report summarizes the company's performance in the first three quarters of 2008. Key highlights include operating margins reaching an all-time high of 15.8% and EBIT growth of 25%. Vehicle deliveries increased 4% while service revenue grew due to the large installed base of vehicles. The outlook acknowledges earnings will be higher in 2008 than 2007 but provides no forecast for 2009 due to uncertainty.
- Scania's operating margin and net margin increased in the first nine months of 2008 compared to the same period in 2007. Net sales rose 11% while order bookings declined 29% due to lower demand in Europe.
- Earnings per share increased and the forecast for higher full-year 2008 earnings remains unchanged. However, due to lower order bookings and higher inventories, Scania will adjust production rates.
- Service revenue continued to show strong growth of 8%, while trucks deliveries increased 4% and various restructuring efforts are expected to generate annual cost savings of SEK 300 million from 2009.
1) Scania reported all-time high earnings in 2008 with operating income of SEK 12,512 million. However, deliveries declined 18% in Q4 as the company adjusted production rates due to decreased demand in Europe.
2) While the trucks and services segment grew profits through price increases, this was partially offset by negative impacts from lower deliveries, used vehicles, raw materials, and R&D spending.
3) Scania's flexible production system and focus on reducing inventory and postponing investments helped cash flow, but tied up capital increased with capacity investments. Outlook for 2009 is uncertain due to rapid demand fall in Q4 and high industry inventory levels.
This document is Scania's annual report for 2008. It discusses Scania's vision to be a leading company in its industry by creating value for customers, employees, shareholders, and society. The report outlines Scania's mission to supply high-quality vehicles and services for transporting goods and passengers in a sustainable way. It provides an overview of Scania's operations in trucks, buses, coaches, engines, and financial services. The financial reports indicate that Scania delivered 66,516 trucks, 7,277 buses and coaches, and 6,671 engines in 2008.
Our Chief Executive Officer is required to annually certify to the New York Stock Exchange that the company is in compliance with NYSE corporate governance listing standards or note any violations. On June 6, 2007, our Chief Executive Officer submitted this unqualified certification, indicating the company was in full compliance with NYSE standards as of that date.
Our Chief Executive Officer is required to annually certify to the New York Stock Exchange that the company is in compliance with NYSE corporate governance listing standards, though he may qualify the certification if needed. On June 6, 2007, our Chief Executive Officer submitted the certification with no qualification, indicating full compliance with NYSE standards as of that date.
The document outlines the corporate governance guidelines of Perini Corporation. It discusses (1) the composition and responsibilities of the Board of Directors, including director qualifications and independence, (2) the roles and responsibilities of Board committees, and (3) policies regarding Board performance evaluation, director orientation, management succession planning, and the company's code of business conduct. The guidelines are intended to assist the Board in exercising its duties to stakeholders.
The Perini Corporation Code of Business Conduct and Ethics outlines guidelines for ethical behavior. It applies to all directors, officers, and employees. The code establishes rules regarding conflicts of interest, procurement ethics, accounting practices, use of company property, environmental compliance, and insider trading. Any violations of the code are taken seriously and can result in disciplinary action up to dismissal.
The document outlines the Corporate Governance and Nominating Committee Charter for Perini Corporation. The purpose of the committee is to identify and evaluate potential board candidates and lead corporate governance efforts. The committee must consist of at least two independent directors appointed by the board. It has authority to retain outside advisors and meet at least twice per year. Regarding nominations, the committee evaluates candidates, recommends nominees, and assesses board independence. For corporate governance, the committee develops guidelines, reviews committee performance, and recommends criteria for director tenure.
The document is the Compensation Committee Charter for Perini Corporation. It outlines the committee's purpose of ensuring compensation programs attract and retain employees while representing fair value for shareholders. It details the committee's composition, duties, and responsibilities which include annually reviewing executive compensation programs, recommending director and CEO compensation, overseeing incentive plans, and preparing required compensation disclosures.
The Universal Account Number (UAN) by EPFO centralizes multiple PF accounts, simplifying management for Indian employees. It streamlines PF transfers, withdrawals, and KYC updates, providing transparency and reducing employer dependency. Despite challenges like digital literacy and internet access, UAN is vital for financial empowerment and efficient provident fund management in today's digital age.
Enhancing Asset Quality: Strategies for Financial Institutionsshruti1menon2
Ensuring robust asset quality is not just a mere aspect but a critical cornerstone for the stability and success of financial institutions worldwide. It serves as the bedrock upon which profitability is built and investor confidence is sustained. Therefore, in this presentation, we delve into a comprehensive exploration of strategies that can aid financial institutions in achieving and maintaining superior asset quality.
Economic Risk Factor Update: June 2024 [SlideShare]Commonwealth
May’s reports showed signs of continued economic growth, said Sam Millette, director, fixed income, in his latest Economic Risk Factor Update.
For more market updates, subscribe to The Independent Market Observer at https://blog.commonwealth.com/independent-market-observer.
Vicinity Jobs’ data includes more than three million 2023 OJPs and thousands of skills. Most skills appear in less than 0.02% of job postings, so most postings rely on a small subset of commonly used terms, like teamwork.
Laura Adkins-Hackett, Economist, LMIC, and Sukriti Trehan, Data Scientist, LMIC, presented their research exploring trends in the skills listed in OJPs to develop a deeper understanding of in-demand skills. This research project uses pointwise mutual information and other methods to extract more information about common skills from the relationships between skills, occupations and regions.
Abhay Bhutada, the Managing Director of Poonawalla Fincorp Limited, is an accomplished leader with over 15 years of experience in commercial and retail lending. A Qualified Chartered Accountant, he has been pivotal in leveraging technology to enhance financial services. Starting his career at Bank of India, he later founded TAB Capital Limited and co-founded Poonawalla Finance Private Limited, emphasizing digital lending. Under his leadership, Poonawalla Fincorp achieved a 'AAA' credit rating, integrating acquisitions and emphasizing corporate governance. Actively involved in industry forums and CSR initiatives, Abhay has been recognized with awards like "Young Entrepreneur of India 2017" and "40 under 40 Most Influential Leader for 2020-21." Personally, he values mindfulness, enjoys gardening, yoga, and sees every day as an opportunity for growth and improvement.
OJP data from firms like Vicinity Jobs have emerged as a complement to traditional sources of labour demand data, such as the Job Vacancy and Wages Survey (JVWS). Ibrahim Abuallail, PhD Candidate, University of Ottawa, presented research relating to bias in OJPs and a proposed approach to effectively adjust OJP data to complement existing official data (such as from the JVWS) and improve the measurement of labour demand.
New Visa Rules for Tourists and Students in Thailand | Amit Kakkar Easy VisaAmit Kakkar
Discover essential details about Thailand's recent visa policy changes, tailored for tourists and students. Amit Kakkar Easy Visa provides a comprehensive overview of new requirements, application processes, and tips to ensure a smooth transition for all travelers.
STREETONOMICS: Exploring the Uncharted Territories of Informal Markets throug...sameer shah
Delve into the world of STREETONOMICS, where a team of 7 enthusiasts embarks on a journey to understand unorganized markets. By engaging with a coffee street vendor and crafting questionnaires, this project uncovers valuable insights into consumer behavior and market dynamics in informal settings."
Optimizing Net Interest Margin (NIM) in the Financial Sector (With Examples).pdfshruti1menon2
NIM is calculated as the difference between interest income earned and interest expenses paid, divided by interest-earning assets.
Importance: NIM serves as a critical measure of a financial institution's profitability and operational efficiency. It reflects how effectively the institution is utilizing its interest-earning assets to generate income while managing interest costs.
Upanishads summary with explanations of each upnishad
tollbrothers 10-Q_jan_2002
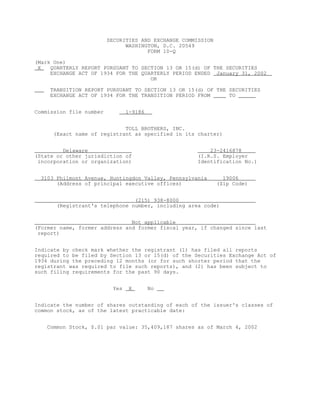
1. SECURITIES AND EXCHANGE COMMISSION
WASHINGTON, D.C. 20549
FORM 10-Q
(Mark One)
X QUARTERLY REPORT PURSUANT TO SECTION 13 OR 15(d) OF THE SECURITIES
EXCHANGE ACT OF 1934 FOR THE QUARTERLY PERIOD ENDED January 31, 2002
OR
TRANSITION REPORT PURSUANT TO SECTION 13 OR 15(d) OF THE SECURITIES
EXCHANGE ACT OF 1934 FOR THE TRANSITION PERIOD FROM TO
Commission file number 1-9186
TOLL BROTHERS, INC.
(Exact name of registrant as specified in its charter)
Delaware 23-2416878
(State or other jurisdiction of (I.R.S. Employer
incorporation or organization) Identification No.)
3103 Philmont Avenue, Huntingdon Valley, Pennsylvania 19006
(Address of principal executive offices) (Zip Code)
(215) 938-8000
(Registrant's telephone number, including area code)
Not applicable
(Former name, former address and former fiscal year, if changed since last
report)
Indicate by check mark whether the registrant (1) has filed all reports
required to be filed by Section 13 or 15(d) of the Securities Exchange Act of
1934 during the preceding 12 months (or for such shorter period that the
registrant was required to file such reports), and (2) has been subject to
such filing requirements for the past 90 days.
Yes X No
Indicate the number of shares outstanding of each of the issuer's classes of
common stock, as of the latest practicable date:
Common Stock, $.01 par value: 35,409,187 shares as of March 4, 2002
2. TOLL BROTHERS, INC. AND SUBSIDIARIES
INDEX
Page
No.
Statement of Forward-Looking Information 1
PART I. Financial Information
ITEM 1. Financial Statements
Condensed Consolidated Balance Sheets (Unaudited)
as of January 31, 2002 and October 31, 2001 2
Condensed Consolidated Statements of Income
(Unaudited) For the Three Months Ended
January 31, 2002 and 2001 3
Condensed Consolidated Statements of Cash Flows
(Unaudited) For the Three Months Ended
January 31, 2002 and 2001 4
Notes to Condensed Consolidated Financial Statements
(Unaudited) 5
ITEM 2. Management's Discussion and Analysis of Financial
Condition and Results of Operations 7
ITEM 3. Quantitative and Qualitative Disclosures About
Market Risk 10
PART II. Other Information 12
SIGNATURES 13
3. STATEMENT ON FORWARD-LOOKING INFORMATION
Certain information included herein and in other Company reports, SEC filings,
statements and presentations is forward-looking within the meaning of the
Private Securities Litigation Reform Act of 1995, including, but not limited
to,
statements concerning the Company's anticipated operating results, financial
resources, changes in revenues, changes in profitability, interest expense,
growth and expansion, ability to acquire land, ability to sell homes and
properties, ability to deliver homes from backlog, ability to secure materials
and subcontractors and stock market valuations. In some cases you can identify
those so-called forward looking statements by words such as “may”, “will”,
“should”, “expects”, “plans”, “anticipates”, “believes”, “estimates”,
“predicts”, “potential”, or “continue” or the negative of those words or other
comparable words. Such forward-looking information involves important risks and
uncertainties that could significantly affect actual results and cause them to
differ materially from expectations expressed herein and in other Company
reports, SEC filings, statements and presentations. These risks and
uncertainties include local, regional and national economic and political
conditions, consequences of any future terrorist attacks such as those that
occurred on September 11, 2001, the effects of governmental regulation, the
competitive environment in which the Company operates, fluctuations in interest
rates, changes in home prices, the availability and cost of land for future
growth, the availability of capital, fluctuations in capital and securities
markets, the availability and cost of labor and materials, and weather
conditions.
Additional information concerning potential factors that the Company believes
could cause its actual results to differ materially from expected and
historical
results is included under the caption quot;Factors That May Affect Our Future
Resultsquot; in Item 1 of our Annual Report on Form 10-K for the fiscal year ended
October 31, 2001. If one or more of the assumptions underlying our
forward-looking statements proves incorrect, then the Company's actual results,
performance or achievements could differ materially from those expressed in,
or implied by the forward-looking statements contained in this report.
Therefore, we caution you not to place undue reliance on our forward-looking
statements. This statement is provided as permitted by the Private Securities
Litigation Reform Act of 1995.
1
4. PART 1. FINANCIAL INFORMATION
ITEM 1.
TOLL BROTHERS, INC. AND SUBSIDIARIES
CONDENSED CONSOLIDATED BALANCE SHEETS
(Amounts in thousands)
January 31, October 31,
2002 2001
(Unaudited)
ASSETS
Cash and cash equivalents $ 273,552 $ 182,840
Inventory 2,276,803 2,183,541
Property, construction and office
equipment, net 33,686 33,095
Receivables, prepaid expenses and
other assets 94,708 91,784
Mortgage loans receivable 27,794 26,758
Investments in unconsolidated entities 13,457 14,182
$ 2,720,000 $ 2,532,200
LIABILITIES AND STOCKHOLDERS' EQUITY
Liabilities:
Loans payable $ 382,871 $ 387,466
Subordinated notes 819,602 669,581
Customer deposits 100,895 101,778
Accounts payable 132,963 132,970
Accrued expenses 224,685 229,671
Income taxes payable 84,343 98,151
Total liabilities $ 1,745,359 $ 1,619,617
Stockholders' equity:
Preferred stock
Common stock 369 369
Additional paid-in capital 105,385 107,014
Retained earnings 926,775 882,281
Treasury stock (57,888) (77,081)
Total stockholders' equity 974,641 912,583
$ 2,720,000 $ 2,532,200
See accompanying notes
2
5. TOLL BROTHERS, INC. AND SUBSIDIARIES
CONDENSED CONSOLIDATED STATEMENTS OF INCOME
(Amounts in thousands, except per share data)
(Unaudited)
Three Months Ended
January 31,
2002 2001
Revenues:
Housing sales $ 482,702 $ 458,369
Land sales 6,423 10,907
Equity earnings of
unconsolidated joint ventures 2,386
Interest and other 3,054 3,599
492,179 475,261
Costs and expenses:
Housing sales 351,425 344,813
Land sales 4,217 8,540
Selling, general
& administrative 52,398 46,949
Interest 14,155 11,764
422,195 412,066
Income before income taxes 69,984 63,195
Income taxes 25,490 23,270
Net Income $ 44,494 $ 39,925
Earnings per share
Basic $ 1.27 $ 1.10
Diluted $ 1.20 $ 1.01
Weighted average number
of shares
Basic 35,001 36,163
Diluted 37,122 39,415
See accompanying notes
3
6. TOLL BROTHERS, INC. AND SUBSIDIARIES
CONDENSED CONSOLIDATED STATEMENTS OF CASH FLOWS
(Amounts in thousands)
(Unaudited)
Three months ended
January 31,
2002 2001
Cash flows from operating activities:
Net income $ 44,494 $ 39,925
Adjustments to reconcile net income to net
cash used in operating activities:
Depreciation and amortization 2,903 2,265
Equity in the earnings of unconsolidated
joint ventures (2,386)
Deferred tax provision (1,414) 1,685
Changes in operating assets and liabilities:
Increase in inventory (92,752) (136,047)
Origination of mortgage loans (83,430) (26,186)
Sale of mortgage loans 82,397 24,877
Increase in receivables, prepaid expenses
and other assets (3,151) (5,800)
(Decrease) increase in customer deposits (882) 603
Increase (decrease) in accounts payable
and accrued expenses 1,860 (23,279)
Decrease in current income taxes payable (8,096) (16,165)
Net cash used in operating activities (58,071) (140,508)
Cash flows from investing activities:
Purchase of property, construction and
office equipment, net (3,072) (3,396)
Investments in unconsolidated entities (2,000)
Distribution from unconsolidated entities 2,800 8,750
Net cash (used in) provided by
investing activities (2,272) 5,354
Cash flows from financing activities:
Proceeds from loans payable 96,540 40,000
Principal payments of loans payable (101,645) (42,268)
Net proceeds from the issuance of subordinated debt 149,748 196,975
Proceeds from stock-based benefit plans 6,437 9,680
Purchase of treasury stock (25) (1,642)
Net cash provided by financing activities 151,055 202,745
Increase in cash and cash equivalents 90,712 67,591
Cash and cash equivalents, beginning of period 182,840 161,860
Cash and cash equivalents, end of period $ 273,552 $ 229,451
See accompanying notes
4
7. TOLL BROTHERS, INC. and SUBSIDIARIES
NOTES TO CONDENSED CONSOLIDATED FINANCIAL STATEMENTS
(unaudited)
1. Basis of Presentation
The accompanying unaudited condensed consolidated financial statements
have been prepared in accordance with the rules and regulations of the
Securities and Exchange Commission for interim financial information.
The October 31, 2001 balance sheet amounts and disclosures included
herein have been derived from the October 31, 2001 audited financial
statements of Toll Brothers, Inc. and Subsidiaries. Since the
accompanying condensed consolidated financial statements do not include
all the information and footnotes required by accounting principles
generally accepted in the United States for complete financial
statements, it is suggested that they be read in conjunction with the
financial statements and notes thereto included in the Company’s October
31, 2001 Annual Report on Form 10-K. In the opinion of management, the
accompanying unaudited condensed consolidated financial statements
include all adjustments, which are of a normal recurring nature,
necessary to present fairly the Company's financial position as of
January 31, 2002 and the results of its operations and cash flows for the
three months ended January 31, 2002 and 2001. The results of operations
for such interim periods are not necessarily indicative of the results to
be expected for the full year.
Certain amounts reported in prior periods have been reclassified for
comparative purposes.
Statement of Financial Accounting Standards (“SFAS”) No. 142, “Goodwill
and Other Intangible Assets” provides guidance on accounting for certain
intangibles and eliminates the amortization of goodwill and certain other
intangible assets. Intangible assets, including goodwill, that are not
subject to amortization are required to be tested for impairment and
possible write-down on an annual basis. The Company adopted SFAS 142 on
November 1, 2001, the first day of its 2002 fiscal year. The Company had
$9.4 million of goodwill at November 1, 2001. The adoption of SFAS 142
did not have a material impact on the Company’s financial statements.
2. Inventory
Inventory consisted of the following (amounts in thousands):
January 31, October 31,
2002 2001
Land and land development costs $ 864,955 $ 833,386
Construction in progress 1,191,528 1,145,046
Sample homes 83,733 75,723
Land deposits and costs of
future developments 90,942 89,360
Deferred marketing costs 45,645 40,026
$2,276,803 $2,183,541
5
8. Construction in progress includes the cost of homes under construction,
land, land development costs and carrying costs of lots that have been
substantially improved.
The Company capitalizes certain interest costs to inventories during the
development and construction period. Capitalized interest is charged to
interest expense when the related inventory is delivered. Interest
incurred, capitalized and expensed is summarized as follows (amounts in
thousands):
Three months ended
January 31,
2002 2001
Interest capitalized,
beginning of period $ 98,650 $ 78,443
Interest incurred 22,870 16,913
Interest expensed (14,155) (11,764)
Write off to cost of sales ( 823)
Interest capitalized,
end of period $ 106,542 $ 83,592
3. Earnings Per Share
Information pertaining to the calculation of earnings per share for the
three months ended January 31, 2002 and 2001 is as follows (amounts in
thousands):
Three months ended
January 31,
2002 2001
Basic weighted average shares 35,001 36,163
Common stock equivalents 2,121 3,252
Diluted weighted average shares 37,122 39,415
4. Subordinated Notes
In November 2001, the Company issued $150,000,000 of 8.25% Senior
Subordinated Notes due December 2011. The Company has used the proceeds
for general corporate purposes including the acquisition of inventory.
5. Stock Repurchase Program
The Company's Board of Directors has authorized the repurchase of up to
5,000,000 shares of its common stock, par value $.01, from time to time,
in open market transactions or otherwise, for the purpose of providing
shares for the Company's various employee benefit plans. As of January
31, 2002, the Company had repurchased approximately 2,062,000 shares
under the program.
6
9. 6. Subsequent Event
On March 4, 2002, the Company's Board of Directors declared a two-for-one
split of its common stock which will be effected in the form of a stock
dividend. Record holders of the Company's common stock as of the close of
business on March 14, 2002 will be entitled to one additional share for
each share held as of that time. The new shares will be distributed on
March 28, 2002.
7. Supplemental Disclosure to Statements of Cash Flows
The following are supplemental disclosures to the statements of cash flows
(amounts in thousands):
Three months ended
January 31,
2002 2001
Supplemental disclosures of cash flow information:
Interest paid, net of capitalized amounts $ 3,574 $ 3,045
Income taxes paid $ 35,000 $ 37,750
Supplemental disclosures of non-cash activities:
Cost of residential inventories acquired
through seller financing $ 510 $ 4,500
Income tax benefit relating to exercise of
employee stock options $ 4,298 $ 4,312
Stock bonus award $ 6,853 $ 4,413
ITEM 2. MANAGEMENT'S DISCUSSION AND ANALYSIS OF FINANCIAL CONDITION
AND RESULTS OF OPERATIONS
CRITICAL ACCOUNTING POLICIES
Basis of Presentation
The Company’s financial statements include the accounts of Toll Brothers,
Inc. and its majority owned subsidiaries. All significant intercompany
accounts and transactions have been eliminated. Investments in 20% to 50%
owned partnerships and affiliates are accounted for on the equity method.
Income Recognition
Revenue and cost of sales are recorded at the time each home, or lot, is
closed and title and possession have been transferred to the buyer.
Land, land development and related costs are amortized to the cost of homes
closed based upon the total number of homes to be constructed in each
community. Home construction and related costs are charged to the cost of
homes closed under the specific identification method. Land, common
development and related costs of master planned communities are allocated to
individual communities within the master planned community on a relative
sales value basis.
7
10. Joint Venture Accounting
The Company has entered into three joint ventures to develop and sell land
that was owned or is currently owned by its venture partners. The Company
recognizes its share of earnings from the sale of lots to other builders.
The Company does not recognize earnings from lots it purchases from the
ventures, but reduces its cost basis in the lots by its share of the earnings
on those lots. The Company has agreed to purchase 180 lots from one of the
ventures, 46 lots from another and has the right to purchase up to 385 lots
from
the third.
In addition, the Company effectively owns one-third of Toll Brothers Realty
Trust (the “Trust”), an entity that was formed to take advantage of commercial
real estate opportunities that may present themselves from time to time. The
Company is committed to invest an additional $9.2 million in the Trust if
required. The Company provides development, finance and management services to
the Trust and receives fees from it under various agreements. The Company also
owns 50% of a joint venture that is currently selling and building an active
adult, age-qualified community.
The Company’s total commitment to these entities is not material to its
financial position. These investments are accounted for on the equity method.
RESULTS OF OPERATIONS
The following table sets forth, for the three months ended January 31, 2002 and
2001, certain income statement items related to the Company's operations
(amounts in millions):
Three months ended January 31,
2002 2001
$ % $ %
Housing sales
Revenues 482.7 458.4
Costs 351.4 72.8 344.8 75.2
Land sales
Revenues 6.4 10.9
Costs 4.2 65.7 8.5 78.3
Equity earnings in unconsolidated
joint venture 2.4
Other 3.1 3.6
Total revenue 492.2 475.3
Selling, general & administrative
expenses* 52.4 10.6 46.9 9.9
Interest expense* 14.2 2.9 11.8 2.5
Total costs and expenses* 422.2 85.8 412.1 86.7
Income before income taxes* 70.0 14.2 63.2 13.3
Note: Amounts may not add due to rounding
*Percentages are based on total revenues.
8
11. HOUSING SALES
Housing revenues for the three months ended January 31, 2002 increased $24.3
million, or 5%, over housing revenues for the three months ended January 31,
2001. This increase was primarily the result of an increase in the average
price of the homes delivered. The increase in the average price of the homes
delivered was principally the result of increases in the base sales prices of
our homes and a shift in the location of homes delivered to more expensive
areas.
The aggregate sales value of contracts signed during the three months ended
January 31, 2002 amounted to $485.2 million, an 8% increase over the same
period
in fiscal 2001. This increase is primarily the result of a 5% increase in the
number of homes for which new contracts were signed and a 3% increase in the
average price of the homes under those contracts (due primarily to increases in
base selling prices and a shift in the location of homes sold to more expensive
areas).
At January 31, 2002, the backlog of homes under contract but not delivered
amounted to $1.41 billion (2,662 homes), as compared to $1.41 billion (2,727
homes) at October 31, 2002 and $1.42 billion (2,678 homes) at January 31, 2001.
Housing costs as a percentage of housing sales decreased from 75.2% to 72.8% in
fiscal 2002 as compared to the comparable period of fiscal 2001. The decrease
was primarily the result of sales prices of homes increasing faster than cost
increases, lower land and land improvement costs, improved operating
efficiencies and lower inventory write-offs. The Company incurred $1.3 million
in write-offs in the three-month period of fiscal 2002 as compared to $2.7
million in the comparable period of fiscal 2001.
The Company continues to increase the number of communities from which it is
selling. At January 31, 2002 it had 165 selling communities as compared to 145
at January 31, 2001 and expects to have 175 by October 31, 2002. Demand for
homes continues to strengthen. Customer deposits for the month of February 2002
were up 31% in the aggregate over February 2001 and 18% higher on a per
community basis. Deposits are non-binding agreements signed by a home buyer
which reserve a home site and fix the home price for a short period of time.
Not all deposits result in signed, binding agreements of sale, and therefore,
deposits are not included in backlog. Because it takes, on average, more than
ten months from the time the Company receives a deposit until it delivers the
home, deposits , considered in the context of the Company’s experience, are an
indication of the level of business that the Company can anticipate in fiscal
2003. Based upon the strength of demand and the increased number of selling
communities, the Company believes revenues for fiscal 2003 could exceed $2.5
billion.
9
12. LAND SALES
The Company operates a land development and sales operation in Loudoun
County, Virginia and is also developing several master planned communities in
which it may sell land to other builders. The amount of land sales will vary
from quarter to quarter depending upon the scheduled timing of the delivery of
the land parcels. Land sales amounted to $6.4 million for the three months
ended January 31, 2002, a 41% decrease over the comparable quarter of 2001. The
decrease in land sales was due to fewer lots being available for sale at South
Riding, offset in part by increased sales of lots in the Company's other master
planned communities. Cost of sales as a percentage of land sales declined from
78.3% in 2001 to 65.7% in 2002. This decrease was the result of lower cost land
as a percentage of sales price being delivered in 2002 as compared to 2001.
INTEREST AND OTHER INCOME
For the three months ended January 31, 2002, other income decreased by $545,000
as compared to the three-months ended January 31, 2001. This decrease was
primarily the result of a decrease in interest income due to lower interest
rates and a decrease in income from the Company's ancillary businesses offset
in part by increased income from forfeitures of customer deposits.
SELLING, GENERAL AND ADMINISTRATIVE EXPENSES (quot;SG&Aquot;)
SG&A spending increased by $5.4 million, or 12%, in the three months ended
January 31, 2002 as compared to the three months ended January 31, 2001. As a
percentage of total revenues, SG&A increased to 10.6% for the first quarter of
fiscal 2002 as compared to 9.9% for the first quarter of fiscal 2001. This
increase was primarily due to the higher number of communities open for sale
during the first quarter of fiscal 2002 compared to the first quarter of fiscal
2001. The Company had 165 selling communities at January 31, 2002 as compared
to145 at January 31, 2001.
INTEREST EXPENSE
The Company determines interest expense on a specific lot-by-lot basis for its
homebuilding operations and on a parcel-by-parcel basis for its land sales.
As a percentage of total revenues, interest expense will vary depending on many
factors including the period of time that the land was owned, the length of
time that the homes delivered during the period were under construction, and
the interest rates and the amount of debt carried by the Company in proportion
to the amount of its inventory during those periods. Interest expense as a
percentage of revenues was higher in the first quarter of fiscal 2002 compared
to the same period of fiscal 2001.
INCOME TAXES
Income taxes were provided at an effective rate of 36.4% and 36.8% for the
first quarter of fiscal 2002 and the first quarter of fiscal 2001,
respectively.
The decrease in the 2002 rate is the result of higher tax free interest income
during the 2002 quarter as compared to the 2001 quarter.
10
13. CAPITAL RESOURCES AND LIQUIDITY
Funding for the Company's operations has been principally provided by cash
flows from operations, unsecured bank borrowings and the public debt and equity
markets.
Cash flow from operations, before inventory additions, has improved as
operating results have improved. The Company anticipates that the cash flow
from operations, before inventory additions, will continue to be strong but
will be dependent on the level of revenues from the delivery of homes and land
sales. The Company has used the cash flow from operations, bank borrowings and
public debt to acquire additional land for new communities, to fund additional
expenditures for land development and construction needed to support the
Company's continuing expansion of the number of communities in which it is
offering homes for sale, to repurchase Company stock and to reduce debt. The
Company expects that inventories will continue to increase and is currently
negotiating and searching for additional opportunities to obtain control of
land for future communities.
The Company has a $535 million unsecured revolving credit facility with
16 banks, of which $445 million extends through March 2006 and $90 million
extends through February 2003. As of January 31, 2002, the Company had $80
million of loans and approximately $52.5 million of letters of credit
outstanding under the facility. The Company believes that it will be able to
fund its activities through a combination of existing cash resources, cash flow
from operations and other sources of funds similar in nature to those the
Company has accessed in the past.
In November 2001, the Company issued $150 million of 8.25% Senior Subordinated
Notes due 2011 to the public. The Company has used the proceeds for general
corporate purposes including the acquisition of inventory.
11
14. HOUSING DATA
New Contracts
Three months ended January 31,
2002 2001
units $000 units $000
Northeast (MA, RI, NH, CT, NY, NJ) 190 $ 108,121 180 $ 92,759
Mid-Atlantic (PA, DE, MD, VA) 319 145,780 309 146,397
Midwest (OH, IL, MI) 78 37,655 109 45,829
Southeast (FL, NC, TN) 115 55,176 76 40,153
Southwest (AZ, NV, TX) 116 53,604 111 59,604
West Coast (CA) 110 84,827 98 63,256
928 $ 485,163 883 $ 447,998
New contract amounts for the three months ended January 31, 2002 and 2001
include $1,796,000 (6 homes) and $4,333,000 (15 homes), respectively, from an
unconsolidated 50% owned joint venture.
Closings
Three months ended January 31,
2002 2001
units $000 units $000
Northeast (MA, RI, NH, CT, NY, NJ) 223 $ 115,604 244 $ 118,685
Mid-Atlantic (PA, DE, MD, VA) 328 153,480 304 139,806
Midwest (OH, IL, MI) 112 55,019 92 39,865
Southeast (FL, NC, TN) 131 52,591 113 50,536
Southwest (AZ, NV, TX) 109 57,356 128 55,795
West Coast (CA) 76 48,652 90 53,682
979 $ 482,702 971 $ 458,369
Backlog
As of January 31,
2002 2001
units $000 units $000
Northeast (MA, RI, NH, CT, NY, NJ) 618 $ 323,117 659 $ 341,660
Mid-Atlantic (PA, DE, MD, VA) 824 384,521 684 325,811
Midwest (OH, IL, MI) 282 129,473 315 149,535
Southeast (FL, NC, TN) 312 153,999 275 136,248
Southwest (AZ, NV, TX) 349 183,810 400 213,136
West Coast (CA) 277 234,729 345 254,542
2,662 $1,409,649 2,678 $1,420,932
12
15. Backlog amounts at January 31, 2002 and 2001 include $5,396,000 (17 homes) and
$10,116,000 (35 homes), respectively, from an unconsolidated 50% owned joint
venture.
ITEM 3. QUANTITATIVE AND QUALITATIVE DISCLOSURES ABOUT MARKET RISK
There have been no material changes in the Company's market risk from October
31, 2001. For more information regarding the Company's market risk, see Item
7A, Quantitative and Qualitative Disclosures About Market Risk, in the
Company's Annual Report on Form 10-K for the fiscal year ended October 31,
2001.
PART II. OTHER INFORMATION
ITEM 6. EXHIBITS AND REPORTS ON FORM 8-K
(a)Exhibits:
3.1 *Restated Certificate of Incorporation dated July 1, 1986
( as previously filed with the Commission as Exhibit 3.1 to
the Registrant’s Form 10-K for the fiscal year ended October
31, 1989).
3.2 *Amendment to the Restated Certificate of Incorporation dated
March 7, 1989.
3.3 *Amendment to the Restated Certificate of Incorporation dated
March 11, 1993 (as previously filed with the Commission as
Exhibit 3.3 to the Registrant’s Form 10-Q for the quarter
ended January 31, 1993).
3.4 *Amendment to the Restated Certificate of Incorporation dated
June 12, 1997 (as previously filed with the Commission as
Exhibit 3.4 to the Registrant’s Form 10-K for the fiscal year
ended October 31, 2001).
3.5 *Amendment to the Restated Certificate of Incorporation dated
January 8, 1998 (as previously filed with the Commission as
Exhibit 3.4 to the Registrant’s Form 10-K for the fiscal year
ended October 31, 2001.
3.6 *Amendment to the Restated Certificate of Incorporation dated
March 7, 2002.
*Filed electronically herewith
(b) Reports on Form 8-K
During the quarter ended January 31, 2002 the Company filed
Current Reports on Form 8-K on November 29, 2001 and December 6,
2001, reporting under items 5 and 7, for the purpose of
filing documents pertaining to Toll Corp.'s issuance of
$150,000,000 of 8.25% Senior Subordinated Notes due 2011
guaranteed on a senior subordinated basis by Toll Brothers, Inc.
13
16. SIGNATURES
Pursuant to the requirements of the Securities Exchange Act of 1934, the
registrant has duly caused this report to be signed on its behalf by the
undersigned thereunto duly authorized.
TOLL BROTHERS, INC.
(Registrant)
Date: March 14, 2002 By: /s/ Joel H. Rassman
Joel H. Rassman
Senior Vice President,
Treasurer and Chief
Financial Officer
Date: March 14, 2002 By: /s/ Joseph R. Sicree
Joseph R. Sicree
Vice President -
Chief Accounting Officer
(Principal Accounting
Officer)
14