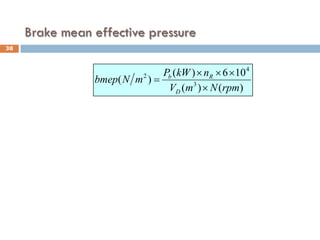
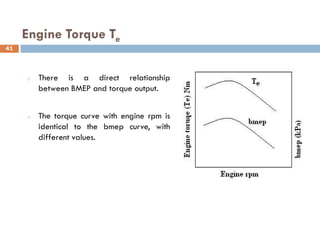
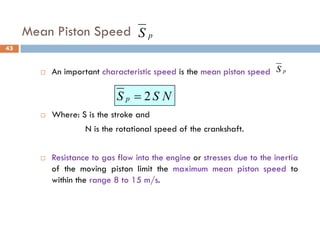
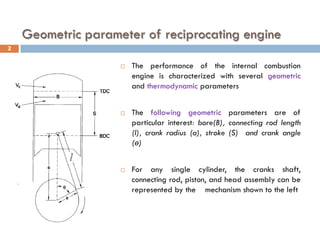
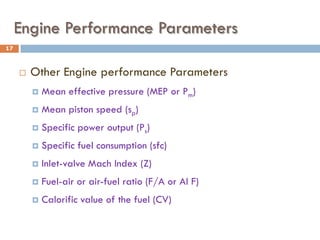
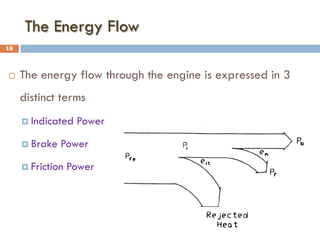
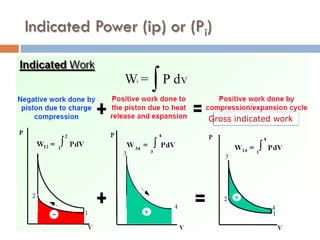
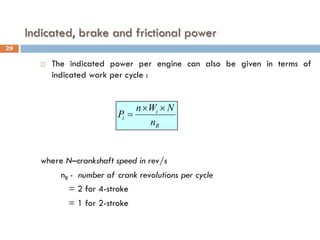
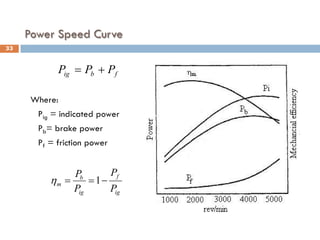
The document discusses the performance and operating characteristics of internal combustion engines, focusing on key geometric and thermodynamic parameters that define engine behavior, such as bore, stroke, and crank angle. It details engine capacity, performance metrics including power output, rated power, and efficiency ratios, along with the relationship between indicated, brake, and frictional power. Additionally, it mentions various performance parameters like mean effective pressure and the importance of operational speed range for optimal engine function.

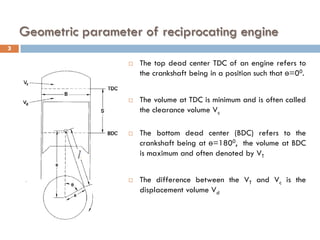


![p = imep (N/m2)
A (m2)
F= P.A (N)
L (m)
F (N)
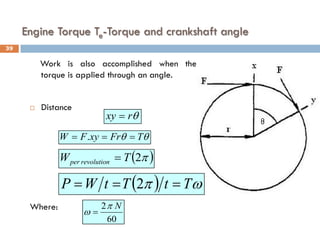
Work (W) = F.L (N m)
Time (t) = 60 / (Ne /k) (s)
Indicated power (Pi) cylinder = W/t = F.L .Ne/(k*60) (W)
(Pi) cylinder = (imep.A.L.N) / (n R . 60)
(Pi) engine = imep. (A.L.n) N) / (n R . 60)
(Pi) engine = [imep. Ve . N)/ (n R . 60)] (W)
a
b
c
n R = 2 (four stroke)
n R = 1 (two stoke)
n = number of cylinder](https://image.slidesharecdn.com/3-chapter-2-240427165503-dcc7b941/85/3-chapter-2-fgpdfffffgggggfsssfgggdfgfgggsd-28-320.jpg)

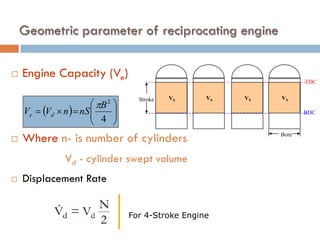
![Indicated and brake Mean effective Pressure
For SI unit
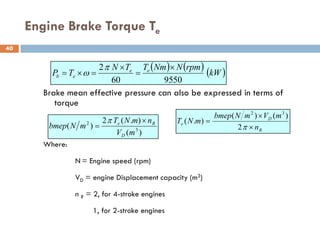
Mean effective pressure can also be expressed in terms of
torque
Indicated power gives indicated mean effective pressure:
)
(
)
(
10
6
)
(
)
( 3
4
2
rpm
N
m
V
n
kW
P
m
N
mep
D
R
×
×
×
×
=
)
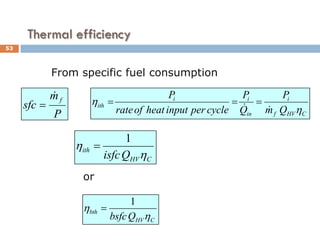
(
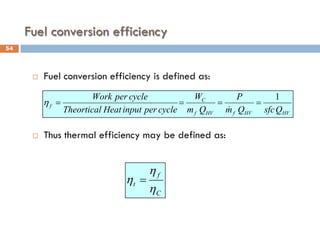
)
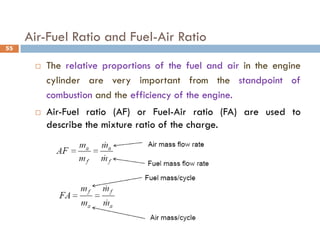
(
2
)
( 3
2
m
V
n
Nm
T
m
N
mep
D
R
×
=
π
)
(
)
(
10
6
)
(
)
( 3
4
2
rpm
N
m
V
n
kW
P
m
N
imep
D
R
i
×
×
×
×
=
[ ]
W
Nm
T
rpm
N
P
60
)
(
)
(
2 ×
=
π
37](https://image.slidesharecdn.com/3-chapter-2-240427165503-dcc7b941/85/3-chapter-2-fgpdfffffgggggfsssfgggdfgfgggsd-37-320.jpg)