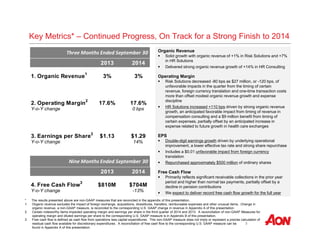
- Aon plc reported third quarter 2014 results with key metrics showing continued progress including 3% organic revenue growth, stable 17.6% operating margin year-over-year, and 14% earnings per share growth to $1.29.
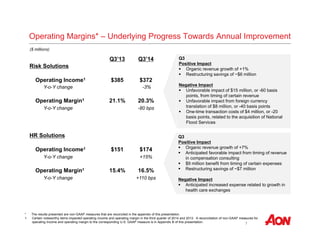
- Risk Solutions grew 1% organically while HR Solutions grew 7% organically, driven by strong 14% growth in HR Consulting.
- Operating margins were impacted by $27 million of unfavorable items in Risk Solutions but increased 110 bps in HR Solutions.
- Double-digit earnings growth was achieved through underlying performance despite currency headwinds.
- Aon reported 2% organic revenue growth in Q2 2015 for both its Risk Solutions and HR Solutions segments.
- Risk Solutions saw 4% organic growth in the Americas and solid growth in Asia, while HR Solutions saw 3% growth in both Consulting and Outsourcing.
- Operating margins increased 150 bps for Risk Solutions due to organic revenue growth and investments in data/analytics, while HR Solutions margins were flat as growth offset continued investments.
- EPS grew 11% excluding currency impacts, driven by operational improvements and share repurchases totaling $300 million.
Aon plc reported first quarter 2015 results with the following highlights:
- Organic revenue growth of 3% in Risk Solutions and 4% in HR Solutions.
- Operating margins decreased in both segments due to foreign exchange impacts, though underlying operational improvements were achieved.
- EPS grew 7% to $1.37 despite a $0.15 unfavorable foreign exchange impact.
- Free cash flow improved significantly to $74 million compared to negative $66 million in Q1 2014.
Aon plc reported strong fourth quarter and full year 2015 results across key metrics such as organic revenue growth, operating margin, earnings per share (EPS), and free cash flow. Organic revenue grew 5% in Risk Solutions and 4% in HR Solutions. Operating margin increased in both segments driven by organic revenue growth and investments in data and analytics. EPS grew 20% through strong operating performance and capital management. Free cash flow reached a record high of $1.7 billion due to improved cash flow from operations and working capital.
Aon plc reported third quarter 2015 results with the following highlights:
- Solid organic revenue growth of 1% in Risk Solutions and 5% in HR Solutions despite macroeconomic challenges.
- Operating margin increased 50 basis points in Risk Solutions and 90 basis points in HR Solutions.
- EPS grew 9% excluding impacts of foreign exchange and a one-time gain in prior year, driven by operational improvements.
- Year-to-date free cash flow grew 22% from improved working capital and lower pension/restructuring payments, partly offset by higher capital expenditures.
Aon plc reported third quarter 2018 results that showed continued positive performance across key metrics. Organic revenue growth was 6% in Q3 and 4% year-to-date, an acceleration from the prior year. Operating margin expanded 190 basis points to 18.5% in Q3 and 210 basis points year-to-date. Earnings per share grew 34% in Q3 and 29% year-to-date. The company is well positioned for long-term value creation through mid-single digit organic revenue growth, continued operating margin expansion, and double-digit free cash flow growth.
- Aon plc reported third quarter 2016 results with solid organic revenue growth and free cash flow.
- Risk Solutions organic revenue grew 3% and HR Solutions grew 4%, with 5% growth in both Americas Retail Brokerage and Outsourcing.
- Operating margin for Risk Solutions increased slightly due to revenue growth and foreign exchange impact, while HR Solutions margin declined due to legacy contract costs and portfolio repositioning.
- Earnings per share improved 4% through effective capital management and operational improvements. Year-to-date free cash flow increased 24% on strong cash flow from operations and lower capital expenditures.
Aon reported its second quarter 2018 results, with continued momentum across key metrics. Organic revenue grew 5% overall in Q2, driven by strong growth in Commercial Risk, Reinsurance, and Health solutions. Operating margin expanded 130 basis points in Q2, and earnings per share grew 31% year-over-year. Adjusted free cash flow grew 17% year-to-date, excluding impacts from restructuring initiatives. Aon is investing in innovation and a single operating model to drive further long-term growth and unlock significant shareholder value through increasing free cash flow and reducing shares outstanding.
Aon plc provides an investor relations overview document that discusses its industry-leading franchise focused on risk, retirement, and health. It operates in growing markets and has positioned itself to create further shareholder value. Aon has focused its portfolio, invested in global capabilities, delivered strong financial results and free cash flow, and consistently outperformed peers in total shareholder returns. It sees opportunities to significantly increase free cash flow generation through operational improvements and has financial flexibility to effectively allocate capital.
- Aon reported its first quarter 2018 results on May 4, 2018.
- Organic revenue growth was 4% in both 2017 and 2016, up from 3% in 2015 and 2014, showing accelerating growth.
- The divestiture of outsourcing businesses provided $3 billion in capital to invest in high-growth, high-margin areas and further aligns the portfolio around clients' priorities.
Aon plc reported strong financial results for the fourth quarter and full year of 2016. Some key highlights include:
- Organic revenue growth of 3% in both segments for the fourth quarter driven by growth across regions and businesses.
- Record operating margins of 26.2% for Risk Solutions and 20.8% for HR Solutions in the fourth quarter due to organic revenue growth and expense discipline.
- Double digit earnings growth of 13% for the fourth quarter and 7% for the full year 2016 driven by strong operating performance and capital management initiatives.
- Record free cash flow of $2.1 billion for 2016, a 22% increase over 2015, demonstrating effective cash generation.
- Aon plc reported its second quarter 2017 results on August 4, 2017, with Greg Case, CEO, and Christa Davies, CFO, presenting.
- Key metrics showed strong operational performance, with 3% organic revenue growth, a 110 basis point increase in operating margin to 22.4%, and 13% growth in earnings per share to $1.45.
- Aon is accelerating its strategy of providing risk, retirement, and health solutions using proprietary data and analytics to empower clients, having divested outsourcing businesses to focus on advice and solutions.
Aon plc reported its fourth quarter and full year 2017 results on February 2, 2018. Key metrics included organic revenue growth of 6% in Q4 2017 and 4% for the full year, driven by investment in high-growth areas. Operating margin in Q4 2017 was 27.5%, up 200 basis points year-over-year. Aon accelerated its strategy of focusing on risk, retirement, and health solutions by divesting outsourcing businesses to further align its portfolio around clients' priorities and provide $3 billion for strategic investments.
Aon reported strong fourth quarter and full year 2017 results, with organic revenue growth of 6% and 4% respectively. Earnings per share grew 18% in the quarter and 17% for the full year, driven by organic revenue growth, operational improvements, and capital management. Aon is strategically investing proceeds from divestitures of $3 billion in high-growth areas like data and analytics, cyber, and healthcare to drive future growth. The company is also investing in a new operating model to improve scalability, connectivity, and efficiency, and expects $450 million in savings by 2019.
Aon reported strong fourth quarter and full year 2017 results, with organic revenue growth of 6% and 4% respectively. Earnings per share grew 18% in the quarter and 17% for the full year, driven by organic revenue growth, operational improvements, and capital management. Aon is strategically investing proceeds from divestitures of $3 billion in high-growth areas like data and analytics, cyber, and healthcare to drive future growth. The company has incurred 48% of the estimated restructuring charges for its operating model transformation and expects to realize only 63% of the total estimated savings to date, positioning Aon for continued margin expansion.
SemGroup reported fourth quarter and full-year 2017 results. Key highlights include $111 million in Adjusted EBITDA for Q4 and $328 million for the full year. SemGroup also executed several strategic transactions including a $350 million preferred equity raise, selling its interest in Glass Mountain Pipeline for $300 million, and estimated proceeds of $140 million from selling SemMaterials Mexico and SemLogistics assets. SemGroup provided 2018 Adjusted EBITDA guidance of $385-$415 million and capital expenditures guidance of $40 million for maintenance spending.
This document contains an agenda and presentation for Aon plc to discuss their industry-leading franchise focused on risk and people solutions, what they have achieved over the last several years, and what they will do over the next several years. It discusses that Aon is #1 in risk solutions and #1 in HR solutions, has the largest globally owned network of resources and capabilities, and operates in growing markets. It notes that over the last several years Aon focused its portfolio, significantly invested in global capabilities, and delivered on key financial metrics. It aims to outline what Aon will do to continue building on this in the coming years.
This document contains an agenda and overview for an Aon plc presentation from October 2014. It discusses Aon's industry-leading positions in risk solutions and HR solutions, its largest global network of resources and capabilities, and the growing markets it operates in around the world. It notes that over the last several years, Aon has focused its portfolio, significantly invested in global capabilities, and delivered on key financial metrics. The presentation will provide further details on Aon's achievements and plans for the next several years.
Aon reported strong results for the first quarter of 2017. Organic revenue grew 4%, operating margin expanded 220 basis points to 22.3%, earnings per share increased 20% to $1.45, and free cash flow grew 38% to $148 million. Aon is a leading global professional services firm that provides risk, retirement, and health solutions using proprietary data and analytics to help clients reduce volatility and improve performance.
The document discusses SemGroup's use of non-GAAP financial measures like Adjusted EBITDA and Total Segment Profit to evaluate financial performance. It defines these measures and explains how they are calculated and why management finds them useful, while also noting their limitations. It also contains forward-looking statements about SemGroup's prospects, financial performance, growth plans and risks.
Aon plc is a global professional services firm focused on risk, retirement, and health solutions. It has achieved several goals in recent years, including focusing its portfolio, significantly investing in global capabilities, and delivering strong financial results. Going forward, Aon aims to unite its operations to drive sustainable long-term growth, continue meeting long-term operating margin targets, effectively allocate capital through strong free cash flow generation, and pursue strategies to further increase shareholder value over the long run.
The document discusses SemGroup's non-GAAP financial measures of Adjusted EBITDA, Cash Available for Dividends (CAFD) and Total Segment Profit. It explains that Adjusted EBITDA removes certain selected items from net income to improve comparability between periods and includes a list of the types of items generally excluded. CAFD is based on Adjusted EBITDA less certain cash payments to analyze performance after obligations. Total Segment Profit represents revenue less costs and expenses, adjusted for certain items, and is how management assesses segment performance. The measures are used by management and may be presented to investors but have limitations as analytical tools.
This document summarizes SemGroup's first quarter 2018 earnings conference call. It discusses SemGroup's non-GAAP financial measures of Adjusted EBITDA and Total Segment Profit, which exclude certain items to make performance more comparable between periods. The document also warns that non-GAAP measures have limitations and should not be considered in isolation as substitutes for GAAP measures. Additionally, the document contains forward-looking statements regarding SemGroup's 2018 operating budget, capital expenditures plan, and recent capital raising activities totaling around $800 million.
This document summarizes SemGroup's second quarter 2018 earnings conference call. It discusses non-GAAP financial measures used by SemGroup like Adjusted EBITDA, Cash Available for Dividends, and Total Segment Profit. It provides definitions of these terms and notes that they are not substitutes for GAAP measures but are used by management to evaluate performance. The document also contains forward-looking statements about SemGroup's prospects, plans, and financial performance that are based on current expectations and assumptions which involve risks and uncertainties.
This document provides an overview of SemGroup's non-GAAP financial measures and forward-looking statements. It defines Adjusted EBITDA, Cash Available for Dividends, and Total Segment Profit as non-GAAP measures used by management to evaluate performance that exclude certain items affecting comparability between periods. It cautions that non-GAAP measures should not be considered in isolation or as substitutes for GAAP measures. The document also notes that forward-looking statements are subject to risks and uncertainties that could cause actual results to differ materially from expectations.
The document provides an overview of SemGroup's non-GAAP financial measures and forward-looking statements. It discusses Adjusted EBITDA, Cash Available for Dividends, and Total Segment Profit, which are not GAAP measures. It also notes that SemGroup does not provide guidance for net income due to non-cash items that cannot be accurately forecasted. The document contains statements regarding SemGroup's prospects, plans, expectations and outlook that are considered forward-looking under securities laws, and are subject to risks and uncertainties.
The document provides an overview of SemGroup's third quarter 2018 results. Key points include:
- Adjusted EBITDA was $96.4 million for the quarter.
- The company declared a quarterly dividend of $0.4725 per share, with dividend coverage of 1.4x.
- Capital expenditures guidance for 2018 was updated to $360 million, up 3% from prior guidance.
- Several growth projects across the Gulf Coast, Mid-Continent and Canada regions are expected to drive financial growth through 2020 and beyond.
The document provides an overview of SemGroup's third quarter 2018 results. Key points include:
- Adjusted EBITDA was $96.4 million for the quarter.
- A quarterly dividend of $0.4725 per share was declared, with dividend coverage of 1.4x.
- Capital expenditures guidance for 2018 was updated to $360 million, up 3% from prior guidance.
- Execution continued on strategic projects in the Gulf Coast, Mid-Continent and Canada expected to drive growth in 2019 and beyond.
The Aon Centre for Innovation and Analytics in Dublin has over 120 staff working in agile teams to leverage Aon's large risk and insurance data through cloud-first analytics on AWS. Key aspects of their work include building a data lake and analytics engine on AWS, adopting DevOps practices, and continuing to optimize security, costs, and performance as they further their cloud strategy. Their focus on cloud adoption has resulted in improved productivity, innovation, and a 60% reduction in operating expenses.
This document discusses developing a comprehensive personal auto fleet safety program. It emphasizes that motor vehicle crashes are a major cause of work-related injuries and fatalities. An effective fleet safety program requires senior management commitment, written policies on issues like seatbelt use and cell phone use, regular motor vehicle record checks, accident reporting and investigation, driver training, and disciplinary procedures for unsafe driving. Implementing all components of a fleet safety program can help companies reduce crashes and protect themselves from negligent entrustment liability claims.
This document provides an overview and summary of TRC Companies' Q3 Fiscal 2015 financial results. Some key points:
- Net service revenue increased 15% year-over-year to $101 million.
- Operating income increased 185% year-over-year to $7.1 million.
- EBITDA increased 100% year-over-year to $9.4 million.
- Net income increased 261% year-over-year to $5.2 million.
- The company is focusing on organic growth opportunities and strategic acquisitions to expand in key markets like oil & gas, utilities, and transportation.
This document is from Aon plc and contains:
1) An overview of Aon's industry-leading positions as the #1 provider of risk solutions and HR solutions globally.
2) Details of Aon's global network of over 500 offices in 120 countries and 31,000 employees worldwide.
3) Discussion of the growing markets for risk and HR solutions due to increasing complexity, emerging markets, and rising healthcare costs.
This document provides an overview of Aon plc for investors. It discusses Aon's industry-leading position in risk solutions and HR solutions, its global network of resources and capabilities, its achievements over the last several years including portfolio focus, global investment, and financial performance. It outlines Aon's plans to continue driving growth, delivering on operating margin targets, effectively allocating capital through strong free cash flow generation, and creating long-term shareholder value.
Aon plc reported first quarter 2016 results with the following highlights:
- Organic revenue growth of 3% in both Risk Solutions and HR Solutions segments.
- Risk Solutions operating margin increased 100 basis points to 24.2% due to organic revenue growth and investments in data and analytics.
- HR Solutions operating margin decreased 140 basis points to 11.8% due to $20 million in transaction and portfolio repositioning costs.
- EPS of $1.35 was down 1% year-over-year due to unfavorable foreign exchange rates.
This document provides Level 3's fourth quarter and full year 2015 results. Some key highlights include:
- Revenue growth of 2.4% for CNS and Enterprise on a pro forma basis.
- Adjusted EBITDA growth of 16% year-over-year and margins expanding 400 basis points.
- Free cash flow of $658 million, exceeding expectations.
- Achieved $216 million in annualized run-rate synergies from the tw telecom acquisition, exceeding targets.
- Improved leverage ratio to 3.8x from 4.4x in the prior year.
- Level 3 reported first quarter 2016 results on April 28, 2016
- Revenue grew 3.6% year-over-year on a constant currency and pro forma basis to $1.947 billion
- Adjusted EBITDA grew 15% year-over-year on a pro forma basis to $710 million
- The company reiterated its 2016 business outlook for 10-12% Adjusted EBITDA growth and $1-1.1 billion in free cash flow
TRC reported positive financial results for Q4 FY 2014 and full year FY 2014, with net service revenue increasing 9% and 11% respectively. Operating income grew 45% in Q4 and 13% for the full year, while EBITDA increased 38% and 17%. The company will continue to focus on organic growth across its environmental, energy, and infrastructure segments, as well as pursue strategic acquisitions.
This document provides an overview and financial results for TRC Companies Inc.'s Q2 Fiscal 2015. Key points include:
- Net service revenue increased 10% year-over-year to $99.8 million.
- EBITDA increased 28% to $9.5 million and net income increased 29% to $4.0 million.
- The environmental and energy segments saw increases in net service revenue and profits while the infrastructure segment saw declines.
- The company aims to invest in organic growth and pursue strategic acquisitions to expand in key markets like oil/gas midstream.
This document provides an overview of Aon plc for investors. It discusses Aon's industry-leading risk, retirement, and health solutions franchise operating in growing global markets. It highlights how Aon has focused its portfolio, invested in global capabilities, and made progress towards long-term operational targets while delivering strong financial results and total shareholder returns that have outperformed peers and market indices. The document also outlines the substantial opportunity for further value creation through significantly increasing free cash flow generation given Aon's strong financial flexibility and ability to effectively allocate capital to maximize returns.
This document provides an overview and financial highlights for TRC Companies Inc.'s Q1 Fiscal 2015 results. Some key points:
- Net service revenue increased 14% year-over-year to $92.6 million, with growth in all segments.
- Backlog increased 9% to $260 million, with increases in energy and infrastructure segments.
- Operating income increased 41% to $6 million and EBITDA increased 30% to $8.3 million.
- The company will continue to focus on organic growth opportunities and strategic acquisitions.
This document provides an overview of Aon plc for investors. It summarizes that Aon is an industry-leading global professional services firm focused on risk, retirement, and health operating in growing markets. It operates two industry-leading segments, Aon Hewitt and Aon Risk Solutions, which serve clients in over 120 countries. The markets of risk, retirement, and health that Aon operates in are growing in both size and complexity long-term.
This document provides an overview of Aon plc for investors. It discusses Aon's industry-leading risk, retirement, and health solutions franchise operating in growing global markets. It highlights how Aon has focused its portfolio, invested in global capabilities, and made progress towards long-term operational targets while delivering strong financial results and total shareholder returns that have outperformed peers and market indices. The document also outlines the substantial opportunity for further value creation through significantly increasing free cash flow generation, having strong financial flexibility to effectively allocate growing free cash flows to maximize total shareholder return.
Aon reported its second quarter 2016 results, with the following highlights:
- Organic revenue grew 3% in Risk Solutions and 1% in HR Solutions. Retail Brokerage delivered strong 4% organic revenue growth, with 6% growth internationally.
- Risk Solutions operating margin increased 70 basis points due to organic revenue growth, favorable foreign exchange, and investments in data/analytics. HR Solutions margin declined 40 basis points due to expenses for future growth and divestitures.
- Earnings per share improved 6%, reflecting operational improvements and capital management.
- Year-to-date free cash flow increased 51% to $660 million, driven by higher operating cash flow and lower capital expenditures.
The document provides an overview of Aon plc, a global professional services firm focused on risk, retirement, and health solutions. It summarizes Aon's industry-leading position, global network of over 500 offices in 120 countries, and operations in growing insurance and HR consulting markets. The document also outlines steps Aon has taken to focus its portfolio, invest in capabilities, and deliver strong financial results including 3-4% annual organic revenue growth, 19-22% operating margins, and over $1 billion in annual free cash flow. Finally, it discusses opportunities for further value creation such as united growth efforts, continued margin expansion, effective capital allocation, and long-term shareholder returns.
Aon plc provided an investor relations overview document that contained the following information:
1) Aon operates two industry-leading segments, Risk Solutions and HR Solutions, that focus on risk, retirement, and health. It has a global presence across over 120 countries.
2) The markets that Aon operates in, including risk insurance and retirement, are growing in both size and complexity long-term. Factors like GDP growth and emerging markets are driving increased demand for insurance.
3) Aon has positioned itself for growth by focusing its portfolio, making strategic acquisitions, and investing in global capabilities like data and analytics. It has made progress towards long-term operational targets and delivered strong financial results
TRR reported financial results for Q1 FY2015 with year-over-year growth. Net service revenue increased 14% to $92.6M driven by increases in the Energy, Environmental, and Infrastructure segments. Operating income grew 41% to $6M and net income increased 40% to $3.5M. The company will continue to invest in organic growth opportunities and pursue strategic acquisitions to expand its presence in key markets such as oil & gas, utilities, and transportation.
This document provides an overview of Aon plc, a global professional services firm. It begins with contact information for key executives and a safe harbor statement regarding forward-looking statements. It then outlines Aon's industry-leading positions in risk solutions and human resources solutions. Aon has the largest global network of resources and capabilities, operating in over 120 countries. The markets Aon operates in are growing in both size and complexity long-term. The document discusses how over the past several years Aon has focused its portfolio, significantly invested in global capabilities, and delivered on key financial metrics. It concludes by stating what Aon will do over the next several years.
This document provides an overview of Aon plc for investors. It discusses Aon's industry-leading franchise focused on risk, retirement, and health solutions. It operates in growing global markets in both the size and complexity of risk. The document outlines Aon's progress in positioning the firm against its strategic plan, including focusing its portfolio and investing in global capabilities. It made continued progress toward long-term operational targets and substantial opportunity remains for further value creation.
Aon plc reported its third quarter 2017 results on October 27, 2017. Key metrics included 2% organic revenue growth, a 170 basis point increase in operating margin to 20.3%, and 18% growth in earnings per share to $1.29. Aon is accelerating its strategy of investing in high-growth, high-margin areas through the divestiture of outsourcing businesses and reinvesting the $3 billion in proceeds.
This document provides an overview of Aon plc for investors. It begins with introductory information including leadership and a safe harbor statement. It then discusses Aon's industry-leading position in risk solutions and HR solutions. It highlights the company's global network and presence. The document reviews what Aon has achieved in recent years including focusing its portfolio, investing in capabilities, and delivering strong financial results. Finally, it outlines Aon's plans and targets for the next several years, which include continuing growth, margin expansion, strong free cash flow generation, and long-term value creation for shareholders.
This document provides a summary of Barnes Group Inc.'s earnings for the first quarter of 2015. Key points include:
- Sales were $301 million, down 4% due to negative foreign exchange impacts offsetting 3% organic sales growth.
- Adjusted operating income was $44.7 million, up 5%, and adjusted operating margin was 14.9%, up 120 basis points.
- Adjusted earnings per share were $0.53, up 6% from the previous year.
- Backlog was flat at $728 million overall but up 4% in aerospace.
- Full year 2015 guidance forecasts 1-3% sales growth and increases in operating margin, earnings per share, and cash conversion.
The document provides an earnings call summary for Brink's fourth quarter 2015 results. It discusses financial results including revenue declines due to currency impacts but operating profit growth on a constant currency basis. Brink's outlook for 2016 anticipates continued margin expansion driven by operational improvements in key markets despite some currency headwinds. Segment results showed challenges in the US segment in the second half of 2015 from staffing issues and security costs while money processing volumes grew.
- Brink's reported fourth quarter 2015 non-GAAP EPS of $0.55, down from $0.58 in fourth quarter 2014 due to negative currency impacts offsetting operating improvements. Full year 2015 non-GAAP EPS was $1.69, up from $1.01 in 2014.
- The company provided 2016 non-GAAP EPS guidance of $2.00-$2.20, representing continued strong operating profit growth despite unfavorable currency impacts.
- Key initiatives in the U.S. segment include de-layering operations, fleet modernization, and continuous process improvement to drive margin expansion from 2.1% in 2015 to a targeted 4-5% range in 2016.
- Brink's reported fourth quarter 2015 non-GAAP EPS of $0.55, down from $0.58 in the prior year period. Revenue declined 14% to $733 million due to negative currency impacts.
- For the full year 2015, non-GAAP EPS was $1.69, up from $1.01 in 2014. Revenue declined 11% to $2,977 million, though organic revenue growth was 3%. Currency impacts reduced EPS by $0.64 and revenue by $467 million.
- The company expects 2016 non-GAAP EPS of $2.00-$2.20, driven by continued operating improvements, though currency is expected to reduce EPS by $0.
Brink's 2 q 2016 earnings slides final 07272016investorsbrinks
Brink's reported its second quarter 2016 earnings results. Some of the key highlights include:
- Revenue of $717 million, up 5% organically but down 7% overall due to negative currency impacts.
- Operating profit of $38 million, up 53% organically but down 33% reported due to currency impacts.
- Operating margin of 5.3%, up 120 basis points from the prior year.
- Full year 2016 guidance for revenue of $2.9 billion with organic growth of 5%, but negative currency impacts. Operating margin expected between 6.4-6.9%, up 110-160 basis points, and EPS of $1.95-$2.10.
Brinks q1 2016 earnings slides final 20160502 (1)investorsbrinks
Brink's reported first quarter 2016 earnings. Revenue declined 9% from negative currency impact, while operating profit also declined due to currency. However, Brink's reaffirmed 2016 guidance of $2.00-2.20 EPS and raised revenue outlook to $2.9 billion due to more favorable currency. Brink's expects organic profit growth in the US, Mexico, payments, and rest of world to drive profit towards the $190-210 million operating profit outlook range.
Brink's First Quarter 2016 Earnings Presentationinvestorsbrinks
Brink's reported first quarter 2016 earnings. Revenue declined 9% from negative currency impact, while operating profit also declined due to currency. However, Brink's reaffirmed 2016 guidance of $2.00-2.20 EPS and raised revenue outlook to $2.9 billion due to more favorable currency. Brink's expects organic profit growth in the US, Mexico, payments, and rest of world to drive profit towards the $190-210 million operating profit outlook range.
- US Foods reported strong financial results for Q4 and FY 2016, with adjusted EBITDA growth of 12.5% for the full year.
- Volume growth, margin expansion, and five successful acquisitions contributed to the positive results.
- The company made progress on key strategic initiatives such as new product launches, food cost management, and efficiency improvements.
- Management reiterated mid-term guidance of 7-10% annual adjusted EBITDA growth and remains optimistic given favorable industry trends.
UnityNet World Environment Day Abraham Project 2024 Press ReleaseLHelferty
June 12, 2024 UnityNet International (#UNI) World Environment Day Abraham Project 2024 Press Release from Markham / Mississauga, Ontario in the, Greater Tkaronto Bioregion, Canada in the North American Great Lakes Watersheds of North America (Turtle Island).
Methanex is the world's largest producer and supplier of methanol. We create value through our leadership in the global production, marketing and delivery of methanol to customers. View our latest Investor Presentation for more details.
ZKsync airdrop of 3.6 billion ZK tokens is scheduled by ZKsync for next week.pdfSOFTTECHHUB
The world of blockchain and decentralized technologies is about to witness a groundbreaking event. ZKsync, the pioneering Ethereum Layer 2 network, has announced the highly anticipated airdrop of its native token, ZK. This move marks a significant milestone in the protocol's journey, empowering the community to take the reins and shape the future of this revolutionary ecosystem.
World economy charts case study presented by a Big 4
World economy charts case
World economy charts case study presented by a Big 4
World economy charts case study presented by a Big 4World economy charts case study presented by a Big 4
World economy charts case study presented by a Big 4
World economy charts case study presented by a Big 4World economy charts case study presented by a Big 4World economy charts case study presented by a Big 4World economy charts case study presented by a Big 4World economy charts case study presented by a Big 4World economy charts case study presented by a Big 4World economy charts case study presented by a Big 4World economy charts case study presented by a Big 4World economy charts case study presented by a Big 4World economy charts case study presented by a Big 4World economy charts case study presented by a Big 4World economy charts case study presented by a Big 4World economy charts case study presented by a Big 4World economy charts case study presented by a Big 4study presented by a Big 4
Cleades Robinson, a respected leader in Philadelphia's police force, is known for his diplomatic and tactful approach, fostering a strong community rapport.
3. Safe Harbor Statement
This communication contains certain statements related to future results, or states our intentions, beliefs and expectations or predictions for the future which are forward-looking
statements as that term is defined in the Private Securities Litigation Reform Act of 1995. These forward-looking statements are subject to certain risks and
uncertainties that could cause actual results to differ materially from either historical or anticipated results depending on a variety of factors. These forward-looking
statements include information about possible or assumed future results of our operations. All statements, other than statements of historical facts that address activities,
events or developments that we expect or anticipate may occur in the future, including such things as our outlook, future capital expenditures, growth in commissions and
fees, changes to the composition or level of our revenues, cash flow and liquidity, expected tax rates, business strategies, competitive strengths, goals, the benefits of new
initiatives, growth of our business and operations, plans and references to future successes, are forward-looking statements. Also, when we use the words such as
“anticipate”, “believe”, “estimate”, “expect”, “intend”, “plan”, “probably”, or similar expressions, we are making forward-looking statements.
The following factors, among others, could cause actual results to differ from those set forth in the forward looking statements: general economic conditions in different
countries in which Aon does business around the world; changes in the competitive environment; changes in global equity and fixed income markets that could affect the
return on invested assets; changes in the funding status of Aon's various defined benefit pension plans and the impact of any increased pension funding resulting from
those changes; rating agency actions that could affect Aon's ability to borrow funds; fluctuations in exchange and interest rates that could influence revenue and expense;
the impact of class actions, individual law suits and other contingent liabilities and loss contingencies arising from errors and omissions and other claims against Aon,
including client class actions, securities class actions, derivative actions and ERISA class actions; the impact of any investigations brought by regulatory authorities in the
U.S., U.K. and other countries; the failure to retain and attract qualified personnel; the impact of, and potential challenges in complying with, legislation and regulation in the
jurisdictions in which Aon operates, particularly given the global scope of Aon’s businesses and the possibility of conflicting regulatory requirements across jurisdictions in
which Aon does business; the effect of the change in global headquarters and jurisdiction of incorporation, including differences in the anticipated benefits; the extent to
which Aon retains existing clients and attracts new businesses and Aon’s ability to incentivize and retain key employees; the extent to which Aon manages certain risks
created in connection with the various services, including fiduciary and advisory services and business process outsourcing services, among others, that Aon currently
provides, or will provide in the future, to clients; Aon’s ability to implement restructuring initiatives and other initiatives intended to yield cost savings, and the ability to
achieve those cost savings; the potential of a system or network breach or disruption resulting in operational interruption or improper disclosure of personal data; changes
in commercial property and casualty markets and commercial premium rates that could impact revenues; any inquiries relating to compliance with the U.S. Foreign Corrupt
Practices Act and non-U.S. anti-corruption laws and with U.S. and non-U.S. trade sanctions regimes; failure to protect intellectual property rights or allegations that we
infringe on the intellectual property rights of others; the damage to our reputation among clients, markets or third parties; the actions taken by third parties that preform
aspects of our business operations and client services; changes in costs or assumptions associated with our HR Solutions operating segment’s outsourcing and consulting
arrangements that affect the profitability of these arrangements; and Aon’s ability to grow, develop and integrate companies that it acquires or new lines of business.
Further information concerning Aon and its business, including factors that potentially could materially affect Aon's financial results, is contained in Aon's filings with the
SEC. See Aon’s Annual Report on Form 10-K and its Quarterly Reports on Form 10-Q for a further discussion of these and other risks and uncertainties applicable to Aon’s
businesses. Aon does not undertake, and expressly disclaims, any duty to update any forward-looking statement whether as a result of new information, future events or
changes in their respective expectations, except as required by law.
Explanation of Non-GAAP Measures
This communication includes supplemental information related to organic revenue, free cash flow, adjusted operating margin and adjusted earnings per share, that exclude
the effects of restructuring charges, intangible asset amortization, capital expenditures, transaction and integration costs and certain other noteworthy items that affected
results for the comparable periods. Organic revenue excludes from reported revenues the impact of foreign exchange, acquisitions, divestitures, transfers between
business units, reimbursable expenses and unusual items. The impact of foreign exchange is determined by translating last year's revenue, expense or net income at this
year's foreign exchange rates. Reconciliations are provided in the attached schedules. Supplemental organic revenue information and additional measures that exclude
the effects of the restructuring charges and certain other items do not affect net income or any other GAAP reported amounts. Free cash flow is cash flow from operating
activity less capital expenditures. Management believes that these measures are important to make meaningful period-to-period comparisons and that this supplemental
information is helpful to investors. They should be viewed in addition to, not in lieu of, the Company’s Consolidated Financial Statements. Industry peers provide similar
supplemental information regarding their performance, although they may not make identical adjustments.
2
4. Key Metrics* – Continued Progress, On Track for a Strong Finish to 2014
Organic Revenue
Solid growth with organic revenue of +1% in Risk Solutions and +7%
3
in HR Solutions
Delivered strong organic revenue growth of +14% in HR Consulting
Operating Margin
Risk Solutions decreased -80 bps as $27 million, or -120 bps, of
unfavorable impacts in the quarter from the timing of certain
revenue, foreign currency translation and one-time transaction costs
more than offset modest organic revenue growth and expense
discipline
HR Solutions increased +110 bps driven by strong organic revenue
growth, an anticipated favorable impact from timing of revenue in
compensation consulting and a $9 million benefit from timing of
certain expenses, partially offset by an anticipated increase in
expense related to future growth in health care exchanges
EPS
Double-digit earnings growth driven by underlying operational
improvement, a lower effective tax rate and strong share repurchase
Includes a $0.01 unfavorable impact from foreign currency
translation
Repurchased approximately $500 million of ordinary shares
Free Cash Flow
Primarily reflects significant receivable collections in the prior year
period and higher than normal tax payments, partially offset by a
decline in pension contributions
We expect to deliver record free cash flow growth for the full year
Three Months Ended September 30
2013 2014
1. Organic Revenue1 3% 3%
2. Operating Margin2 17.6% 17.6%
Y-o-Y change 0 bps
3. Earnings per Share2 $1.13 $1.29
Y-o-Y change 14%
Nine Months Ended September 30
2013 2014
4. Free Cash Flow3 $810M $704M
Y-o-Y change -13%
* The results presented above are non-GAAP measures that are reconciled in the appendix of this presentation.
1 Organic revenue excludes the impact of foreign exchange, acquisitions, divestitures, transfers, reimbursable expenses and other unusual items. Change in
organic revenue, a non-GAAP measure, is reconciled to the corresponding U.S. GAAP change in revenue in Appendix A of this presentation.
2 Certain noteworthy items impacted operating margin and earnings per share in the third quarter of 2014 and 2013. A reconciliation of non-GAAP Measures for
operating margin and diluted earnings per share to the corresponding U.S. GAAP measure is in Appendix B of this presentation.
3 Free cash flow is defined as cash flow from operations less capital expenditures. This non-GAAP measure does not imply or represent a precise calculation of
residual cash flow available for discretionary expenditures. A reconciliation of free cash flow to the corresponding U.S. GAAP measure can be
found in Appendix A of this presentation.
5. 4
Organic Revenue¹ – Strong Growth in HR Solutions
Q3
Americas: Strong growth across Latin America and
US Affinity, partially offset by an $8 million
unfavorable impact from timing of certain revenue in
US Retail and Canada
International: Growth across Asia and New Zealand
and strong management of the renewal book portfolio
in continental Europe, partially offset by a $4 million
unfavorable impact from timing of certain revenue
Reinsurance: An unfavorable market impact in treaty,
a decline in capital markets transactions and advisory
business, and a $3 million unfavorable impact from
timing of certain revenue, partially offset by net new
business growth in treaty placements and growth in
facultative placements
Q3’13 Q3’14
Risk Solutions
Americas 5% 2%
International 2% 2%
Retail 4% 2%
Reinsurance 5% -4%
Total Risk Solutions +4% +1%
HR Solutions
Consulting 3% 14%
Outsourcing -1% 3%
Total HR Solutions +0% +7%
Total Aon +3% +3%
Q3
Consulting: Strong growth in investment consulting
and for project work in retirement consulting, in
addition to an anticipated favorable impact from timing
in compensation consulting
Outsourcing: Growth primarily driven by new client
wins and project related revenue in benefits
administration
1 Organic revenue excludes the impact of foreign exchange, acquisitions, divestitures, transfers, reimbursable expenses and other unusual items. Change in
organic revenue, a non-GAAP measure, is reconciled to the corresponding U.S. GAAP change in revenue in Appendix A of this presentation.
6. Investment in the Business – Positioned for Long-Term Growth
“Aon has a truly impressive track record of developing innovative solutions to help solve problems and create
differentiated value in response to specific client needs. Solid long-term operating performance, combined
with expense discipline and strong cash flow, continues to enable substantial investments that position the
firm for long-term growth.”
5
Risk Solutions HR Solutions
Roll-out of the Revenue Engine and Client Promise
internationally to drive greater retention and rollover rates
Global Risk Insight Platform (GRIP), which is the world’s
leading global repository of risk and insurance placement
information providing insight into $113 billion of global
premium flow
Aon Broking initiative to better match client needs with
insurer appetite for risk and to identify structured portfolio
solutions
Aligning our global health and benefits platform to
broaden our global distribution channel and strengthen
deep brokerage capabilities
Further development of data and analytics capability at
Aon Benfield to strengthen our already industry-leading
value proposition and client serving capability
Expansion of content and global footprint through tuck-in
acquisitions that increase scale in emerging markets or
expand capability to better serve clients, such as National
Flood Services and Lorica
Expanding in high-growth areas for both current clients
and new markets; focused on innovative solutions to de-risk
pension plans and providing a broader set of
advisory and advocacy solutions to our clients’
employees to enable greater choice and improve
decision-making on retirement and health care options
Expanding our industry-leading suite of private health
care exchange solutions for active employees and
retirees; enabling clients to transition their participants to
a market-based, defined contribution model for
healthcare, while addressing unsustainable healthcare
cost increases and decreasing population health
Expansion of our industry-leading benefits
administration solutions and technology platform,
including extensive mobile solutions and cloud-based
outsourcing solutions
Expansion of our international footprint to support a
global workforce, with investments in key talent and
capabilities across emerging markets
7. “Results reflect double-digit earnings growth in our seasonally weakest quarter driven by underlying
operational performance and effective capital management. We expect to deliver strong operating
performance across both Risk and HR Solutions in the fourth quarter, benefitting from our investments in
client serving capabilities such as our Global Risk Insight Platform and health care exchanges, resulting in a
solid year of operational improvement and record free cash flow generation."
($ millions) Q3’13 Q3’14
Net Income1 $352 $383
Y-o-Y change +9%
Earnings Per Share1 $1.13 $1.29
Y-o-Y change +14%
6
EPS* – Delivering Double-Digit Earnings Growth
$352 $383
Net Income¹
$1.13
* The results presented are non-GAAP measures that are reconciled in the appendix of this presentation.
1 Certain noteworthy items impacted net income and earnings per share in the third quarter of 2014 and 2013. A reconciliation of non-GAAP measures for net
income and diluted earnings per share to the corresponding U.S. GAAP measure is in Appendix B of this presentation.
$1.29
EPS¹
Q3’13 Q3’14
8. Operating Margins* – Underlying Progress Towards Annual Improvement
Q3
Positive Impact
Organic revenue growth of +1%
Restructuring savings of ~$6 million
Negative Impact
Unfavorable impact of $15 million, or -60 basis
points, from timing of certain revenue
Unfavorable impact from foreign currency
translation of $8 million, or -40 basis points
One-time transaction costs of $4 million, or -20
basis points, related to the acquisition of National
Flood Services
7
Q3’13 Q3’14
Risk Solutions
Operating Income1 $385 $372
Y-o-Y change -3%
Operating Margin1 21.1% 20.3%
Y-o-Y change -80 bps
HR Solutions
Operating Income1 $151 $174
Y-o-Y change +15%
Operating Margin1 15.4% 16.5%
Y-o-Y change +110 bps
Q3
Positive Impact
Organic revenue growth of +7%
Anticipated favorable impact from timing of revenue
in compensation consulting
$9 million benefit from timing of certain expenses
Restructuring savings of ~$7 million
Negative Impact
Anticipated increased expense related to growth in
health care exchanges
($ millions)
* The results presented are non-GAAP measures that are reconciled in the appendix of this presentation.
1 Certain noteworthy items impacted operating income and operating margin in the third quarter of 2014 and 2013. A reconciliation of non-GAAP measures for
operating income and operating margin to the corresponding U.S. GAAP measure is in Appendix B of this presentation.
9. 1. Deliver $5 million of remaining
restructuring savings by the end of 2014
2. Continued rollout of Revenue Engine
internationally
3. Aon Broking and GRIP related initiatives
4. Increases in short-term interest rates
5. Improvements in GDP or insurance
pricing
Long-Term Operating Margin Targets
Risk Solutions*
2006 2007 2008 2009 2010 2011 2012 2013 Target
restructuring savings by the end of 2014
2. Growth in the core business and return
on incremental investments including
health care exchanges
3. Improvement in HR Business Process
8
16.6%
HR Solutions*
5.8%
18.2% 18.7%
11.7%
14.9%
21.6%
22.4%
15.2% 15.3%
21.6% 21.7%
22.5%
17.6% 16.7%
22%
1. Deliver $2 million of remaining
Outsourcing
2006 2007 2008 2009 2010 2011 2012 2013 Target
* The results presented represent non-GAAP measures. See Appendix B and Appendix C for a reconciliation of non-GAAP measures for operating margin
to the corresponding U.S. GAAP measure.
26%
16.6%
10. Unallocated Expenses & Non-Operating Segment Information
9
Q3’13 Q3’14
Quarterly
Guidance
($ millions)
Unallocated Expenses1 ($43) ($39) ($45)
Interest Income $3 $3 $1
Interest Expense ($53) ($65) ($66)
Other Income $39 $35 -
Effective Tax Rate 25.1% 19.1% -
Minority interest ($8) ($6) ($9)
Actual common shares
outstanding at 9-30-14 N/A 285.1 -
Unallocated expenses primarily reflects expense
discipline in the quarter
Interest expense increased due to an increase in
the total debt outstanding and costs associated
with certain derivative hedging programs
Other Income primarily includes a gain on the
sale of the Company’s eSolutions business and
gains on certain long-term investments
Effective tax rate was favorably impacted by
changes in the geographic distribution of income,
partially offset by an unfavorable impact from
certain discrete items
Actual common shares outstanding declined
due to the Company’s share repurchase program.
The Company repurchased 5.8 million of ordinary
shares for approximately $500 million in the third
quarter. Estimated Q4’14 dilutive share count is
~295 million subject to share price movement,
share issuance and share repurchase
1 Certain noteworthy items impacted unallocated expenses in the third quarter of 2013. A reconciliation of non-GAAP measures for unallocated expenses to the
corresponding U.S. GAAP measure is in Appendix B of this presentation.
11. Free Cash Flow 1
($ mil)
$810
YTD'13 YTD'14
Cash Flow Commentary:
Cash flow from operations for the first nine months of 2014 decreased
10% driven primarily by significant receivable collections in the prior year
period and higher than normal tax payments, partially offset by a decline
in pension contributions
Free cash flow also includes a $5 million increase in capital expenditures
We expect to deliver record free cash flow growth for the full year
10
Solid Balance Sheet and Free Cash Flow Generation
Cash Flow from Operations
$984
$883
($ mil)
YTD'13 YTD'14
Balance Sheet
($ mil)
June 30,
2014
Sept 30,
2014
Cash $418 $382
Short-term
Investments $308 $217
Total Debt $5,954 $5,500
Total Aon
Shareholders’
Equity $7,700 $7,215
Total Debt to
Capital 43.6% 43.3%
Q4 is our seasonally strongest cash flow quarter
1 Free cash flow is defined as cash flow from operations less capital expenditures. This non-GAAP measure does not imply or represent a precise calculation of
residual cash flow available for discretionary expenditures. A reconciliation of free cash flow to the corresponding U.S. GAAP measure can be found in
Appendix A of this presentation.
$704
12. Uses of Free Cash Flow ($ mil)
$1,125 $1,102
Declining Required Uses of Cash ($ millions)
Increase of $603 million
in Free Cash Flow
$37 $18 $11 $7
11
Significantly Increasing Free Cash Flow*
$143
$638
$152
$523
$87
$385 $324 $302 $274
* Free cash flow is a non-GAAP measure that is defined as cash flow from operations less capital expenditures.
1 The Company has $1.1 billion of remaining authorization under its share repurchase program as of September 30, 2014.
2 Estimate based on current actuarial assumptions as of 12/31/13 measurement date.
$204 $162 $212
$54
2012 2013
Share Repurchase Dividends M&A
Aon expects to double free cash flow from $1.15 billion in 2012
to more than $2.3 billion annually over the next three to five
years driven by three key areas:
1. Operational improvement as the firm makes progress towards
its long-term operating margin targets
2. Declining required uses of cash for pension and restructuring
3. A lower effective tax rate over time
$180
$269 $229 $240 $245 $250 $255 $260
2012 2013 2014e 2015e 2016e 2017e 2018e
Capital Expenditures Pension Contributions Restructuring - Cash
annually
2
1
13. 12
Summary – Continued Long-Term Value Creation
Positioned for sustainable long-term growth
Significant leverage to an improving global economy and insurance pricing
Investing in colleagues and capabilities around the globe to better serve clients
Opportunity for long-term operating margin improvement
Strong balance sheet and free cash flow generation with declining uses of required cash outlays
Increased financial flexibility and effective capital allocation is expected to drive significant shareholder value