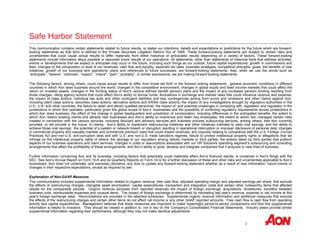
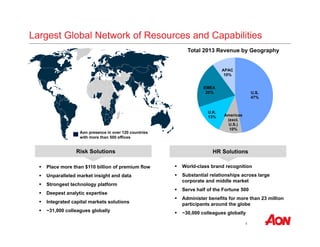
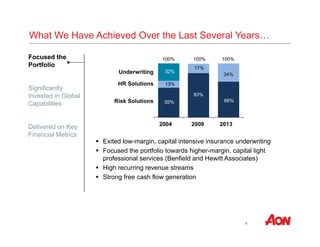
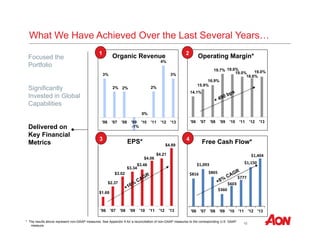
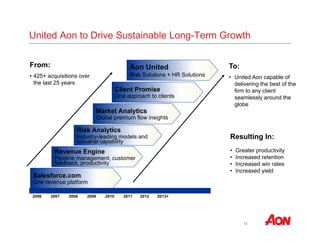
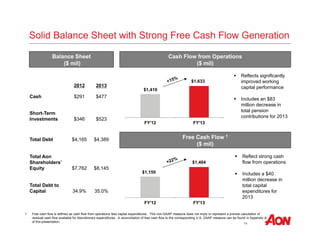
Aon plc is a global professional services firm focused on risk, retirement, and health solutions. It has achieved several goals in recent years, including focusing its portfolio, significantly investing in global capabilities, and delivering strong financial results. Going forward, Aon aims to unite its operations to drive sustainable long-term growth, continue meeting long-term operating margin targets, effectively allocate capital through strong free cash flow generation, and pursue strategies to further increase shareholder value over the long run.
- Aon plc reported third quarter 2016 results with solid organic revenue growth and free cash flow.
- Risk Solutions organic revenue grew 3% and HR Solutions grew 4%, with 5% growth in both Americas Retail Brokerage and Outsourcing.
- Operating margin for Risk Solutions increased slightly due to revenue growth and foreign exchange impact, while HR Solutions margin declined due to legacy contract costs and portfolio repositioning.
- Earnings per share improved 4% through effective capital management and operational improvements. Year-to-date free cash flow increased 24% on strong cash flow from operations and lower capital expenditures.
Aon plc provides an investor relations overview document that discusses its industry-leading franchise focused on risk, retirement, and health. It operates in growing markets and has positioned itself to create further shareholder value. Aon has focused its portfolio, invested in global capabilities, delivered strong financial results and free cash flow, and consistently outperformed peers in total shareholder returns. It sees opportunities to significantly increase free cash flow generation through operational improvements and has financial flexibility to effectively allocate capital.
This document provides an overview of Aon plc for investors. It discusses Aon's industry-leading risk, retirement, and health solutions franchise operating in growing global markets. It highlights how Aon has focused its portfolio, invested in global capabilities, and made progress towards long-term operational targets while delivering strong financial results and total shareholder returns that have outperformed peers and market indices. The document also outlines the substantial opportunity for further value creation through significantly increasing free cash flow generation given Aon's strong financial flexibility and ability to effectively allocate capital to maximize returns.
This document provides an overview of Aon plc for investors. It discusses Aon's industry-leading risk, retirement, and health solutions franchise operating in growing global markets. It highlights how Aon has focused its portfolio, invested in global capabilities, and made progress towards long-term operational targets while delivering strong financial results and total shareholder returns that have outperformed peers and market indices. The document also outlines the substantial opportunity for further value creation through significantly increasing free cash flow generation, having strong financial flexibility to effectively allocate growing free cash flows to maximize total shareholder return.
The document provides an overview of Aon plc, a global professional services firm focused on risk, retirement, and health solutions. It summarizes Aon's industry-leading position, global network of over 500 offices in 120 countries, and operations in growing insurance and HR consulting markets. The document also outlines steps Aon has taken to focus its portfolio, invest in capabilities, and deliver strong financial results including 3-4% annual organic revenue growth, 19-22% operating margins, and over $1 billion in annual free cash flow. Finally, it discusses opportunities for further value creation such as united growth efforts, continued margin expansion, effective capital allocation, and long-term shareholder returns.
Aon reported its second quarter 2018 results, with continued momentum across key metrics. Organic revenue grew 5% overall in Q2, driven by strong growth in Commercial Risk, Reinsurance, and Health solutions. Operating margin expanded 130 basis points in Q2, and earnings per share grew 31% year-over-year. Adjusted free cash flow grew 17% year-to-date, excluding impacts from restructuring initiatives. Aon is investing in innovation and a single operating model to drive further long-term growth and unlock significant shareholder value through increasing free cash flow and reducing shares outstanding.
Aon plc reported third quarter 2018 results that showed continued positive performance across key metrics. Organic revenue growth was 6% in Q3 and 4% year-to-date, an acceleration from the prior year. Operating margin expanded 190 basis points to 18.5% in Q3 and 210 basis points year-to-date. Earnings per share grew 34% in Q3 and 29% year-to-date. The company is well positioned for long-term value creation through mid-single digit organic revenue growth, continued operating margin expansion, and double-digit free cash flow growth.
Aon plc reported strong fourth quarter and full year 2015 results across key metrics such as organic revenue growth, operating margin, earnings per share (EPS), and free cash flow. Organic revenue grew 5% in Risk Solutions and 4% in HR Solutions. Operating margin increased in both segments driven by organic revenue growth and investments in data and analytics. EPS grew 20% through strong operating performance and capital management. Free cash flow reached a record high of $1.7 billion due to improved cash flow from operations and working capital.
Aon plc reported third quarter 2015 results with the following highlights:
- Solid organic revenue growth of 1% in Risk Solutions and 5% in HR Solutions despite macroeconomic challenges.
- Operating margin increased 50 basis points in Risk Solutions and 90 basis points in HR Solutions.
- EPS grew 9% excluding impacts of foreign exchange and a one-time gain in prior year, driven by operational improvements.
- Year-to-date free cash flow grew 22% from improved working capital and lower pension/restructuring payments, partly offset by higher capital expenditures.
This document provides an overview of Aon plc for investors. It begins with introductory information including leadership and a safe harbor statement. It then discusses Aon's industry-leading position in risk solutions and HR solutions. It highlights the company's global network and presence. The document reviews what Aon has achieved in recent years including focusing its portfolio, investing in capabilities, and delivering strong financial results. Finally, it outlines Aon's plans and targets for the next several years, which include continuing growth, margin expansion, strong free cash flow generation, and long-term value creation for shareholders.
Aon plc reported strong financial results for the fourth quarter and full year of 2016. Some key highlights include:
- Organic revenue growth of 3% in both segments for the fourth quarter driven by growth across regions and businesses.
- Record operating margins of 26.2% for Risk Solutions and 20.8% for HR Solutions in the fourth quarter due to organic revenue growth and expense discipline.
- Double digit earnings growth of 13% for the fourth quarter and 7% for the full year 2016 driven by strong operating performance and capital management initiatives.
- Record free cash flow of $2.1 billion for 2016, a 22% increase over 2015, demonstrating effective cash generation.
- Aon reported its first quarter 2018 results on May 4, 2018.
- Organic revenue growth was 4% in both 2017 and 2016, up from 3% in 2015 and 2014, showing accelerating growth.
- The divestiture of outsourcing businesses provided $3 billion in capital to invest in high-growth, high-margin areas and further aligns the portfolio around clients' priorities.
Aon reported strong results for the first quarter of 2017. Organic revenue grew 4%, operating margin expanded 220 basis points to 22.3%, earnings per share increased 20% to $1.45, and free cash flow grew 38% to $148 million. Aon is a leading global professional services firm that provides risk, retirement, and health solutions using proprietary data and analytics to help clients reduce volatility and improve performance.
This document contains an agenda and overview for an Aon plc presentation from October 2014. It discusses Aon's industry-leading positions in risk solutions and HR solutions, its largest global network of resources and capabilities, and the growing markets it operates in around the world. It notes that over the last several years, Aon has focused its portfolio, significantly invested in global capabilities, and delivered on key financial metrics. The presentation will provide further details on Aon's achievements and plans for the next several years.
- Aon plc reported its second quarter 2017 results on August 4, 2017, with Greg Case, CEO, and Christa Davies, CFO, presenting.
- Key metrics showed strong operational performance, with 3% organic revenue growth, a 110 basis point increase in operating margin to 22.4%, and 13% growth in earnings per share to $1.45.
- Aon is accelerating its strategy of providing risk, retirement, and health solutions using proprietary data and analytics to empower clients, having divested outsourcing businesses to focus on advice and solutions.
This document contains an agenda and presentation for Aon plc to discuss their industry-leading franchise focused on risk and people solutions, what they have achieved over the last several years, and what they will do over the next several years. It discusses that Aon is #1 in risk solutions and #1 in HR solutions, has the largest globally owned network of resources and capabilities, and operates in growing markets. It notes that over the last several years Aon focused its portfolio, significantly invested in global capabilities, and delivered on key financial metrics. It aims to outline what Aon will do to continue building on this in the coming years.
- Aon reported 2% organic revenue growth in Q2 2015 for both its Risk Solutions and HR Solutions segments.
- Risk Solutions saw 4% organic growth in the Americas and solid growth in Asia, while HR Solutions saw 3% growth in both Consulting and Outsourcing.
- Operating margins increased 150 bps for Risk Solutions due to organic revenue growth and investments in data/analytics, while HR Solutions margins were flat as growth offset continued investments.
- EPS grew 11% excluding currency impacts, driven by operational improvements and share repurchases totaling $300 million.
- Aon plc reported third quarter 2014 results with key metrics showing continued progress including 3% organic revenue growth, stable 17.6% operating margin year-over-year, and 14% earnings per share growth to $1.29.
- Risk Solutions grew 1% organically while HR Solutions grew 7% organically, driven by strong 14% growth in HR Consulting.
- Operating margins were impacted by $27 million of unfavorable items in Risk Solutions but increased 110 bps in HR Solutions.
- Double-digit earnings growth was achieved through underlying performance despite currency headwinds.
Aon plc reported first quarter 2015 results with the following highlights:
- Organic revenue growth of 3% in Risk Solutions and 4% in HR Solutions.
- Operating margins decreased in both segments due to foreign exchange impacts, though underlying operational improvements were achieved.
- EPS grew 7% to $1.37 despite a $0.15 unfavorable foreign exchange impact.
- Free cash flow improved significantly to $74 million compared to negative $66 million in Q1 2014.
Aon plc reported its third quarter 2017 results on October 27, 2017. Key metrics included 2% organic revenue growth, a 170 basis point increase in operating margin to 20.3%, and 18% growth in earnings per share to $1.29. Aon is accelerating its strategy of investing in high-growth, high-margin areas through the divestiture of outsourcing businesses and reinvesting the $3 billion in proceeds.
Impax provides a summary of its business and priorities for 2017. It has a specialty pharmaceutical division focused on branded CNS products including Rytary for Parkinson's disease. Its generics division has a diversified portfolio of 72 commercial products. For 2017, Impax aims to focus on quality, execute growth initiatives for specialty products, maximize profits from generics, launch new generics, and further diversify and reduce expenses.
First Quarter 2016 Results
- SemGroup reported adjusted EBITDA of $77.7 million for the first quarter of 2016, down slightly from $79.3 million in the fourth quarter of 2015.
- Rose Rock Midstream reported adjusted EBITDA of $49.0 million for the first quarter of 2016, up from $46.6 million in the fourth quarter of 2015.
- SemGroup maintained its 2016 adjusted EBITDA guidance of $270-320 million and Rose Rock Midstream maintained its 2016 adjusted EBITDA guidance of $165-185 million.
The document discusses SemGroup's use of non-GAAP financial measures like Adjusted EBITDA and Total Segment Profit to evaluate financial performance. It defines these measures and explains how they are calculated and why management finds them useful, while also noting their limitations. It also contains forward-looking statements about SemGroup's prospects, financial performance, growth plans and risks.
The document is an investor presentation by SciQuest, a provider of spend management software. It summarizes SciQuest's business, financial highlights, and growth opportunities. SciQuest has a large addressable market that is growing and underpenetrated. It provides a cloud-based software suite that delivers proven ROI and customer satisfaction. SciQuest has over 500 customers, high recurring revenue from multi-year subscriptions, and strong cash flow conversion.
- Q3 2015 highlights document from Aimia provides forward-looking statements and cautions that actual results may differ materially from projections.
- It outlines Aimia's non-GAAP financial measures including Adjusted EBITDA and Adjusted Net Earnings which are used to evaluate performance but are not comparable to GAAP measures.
- The document reports Q3 2015 consolidated Adjusted EBITDA of $49.1 million, down from $63.9 million in Q3 2014, and updates 2015 guidance for lower Gross Billings and Adjusted EBITDA compared to previous targets.
SemGroup reported fourth quarter and full-year 2017 results. Key highlights include $111 million in Adjusted EBITDA for Q4 and $328 million for the full year. SemGroup also executed several strategic transactions including a $350 million preferred equity raise, selling its interest in Glass Mountain Pipeline for $300 million, and estimated proceeds of $140 million from selling SemMaterials Mexico and SemLogistics assets. SemGroup provided 2018 Adjusted EBITDA guidance of $385-$415 million and capital expenditures guidance of $40 million for maintenance spending.
This document provides an overview of Aon plc for investors. It discusses Aon's industry-leading position in risk solutions and HR solutions, its global network of resources and capabilities, its achievements over the last several years including portfolio focus, global investment, and financial performance. It outlines Aon's plans to continue driving growth, delivering on operating margin targets, effectively allocating capital through strong free cash flow generation, and creating long-term shareholder value.
This document is from Aon plc and contains:
1) An overview of Aon's industry-leading positions as the #1 provider of risk solutions and HR solutions globally.
2) Details of Aon's global network of over 500 offices in 120 countries and 31,000 employees worldwide.
3) Discussion of the growing markets for risk and HR solutions due to increasing complexity, emerging markets, and rising healthcare costs.
This document provides an overview of Aon plc for investors. It summarizes that Aon is an industry-leading global professional services firm focused on risk, retirement, and health operating in growing markets. It operates two industry-leading segments, Aon Hewitt and Aon Risk Solutions, which serve clients in over 120 countries. The markets of risk, retirement, and health that Aon operates in are growing in both size and complexity long-term.
Aon plc provided an investor relations overview document that contained the following information:
1) Aon operates two industry-leading segments, Risk Solutions and HR Solutions, that focus on risk, retirement, and health. It has a global presence across over 120 countries.
2) The markets that Aon operates in, including risk insurance and retirement, are growing in both size and complexity long-term. Factors like GDP growth and emerging markets are driving increased demand for insurance.
3) Aon has positioned itself for growth by focusing its portfolio, making strategic acquisitions, and investing in global capabilities like data and analytics. It has made progress towards long-term operational targets and delivered strong financial results
This document provides an overview of Aon plc for investors. It discusses Aon's industry-leading franchise focused on risk, retirement, and health solutions. It operates in growing global markets in both the size and complexity of risk. The document outlines Aon's progress in positioning the firm against its strategic plan, including focusing its portfolio and investing in global capabilities. It made continued progress toward long-term operational targets and substantial opportunity remains for further value creation.
Aon plc reported its fourth quarter and full year 2017 results on February 2, 2018. Key metrics included organic revenue growth of 6% in Q4 2017 and 4% for the full year, driven by investment in high-growth areas. Operating margin in Q4 2017 was 27.5%, up 200 basis points year-over-year. Aon accelerated its strategy of focusing on risk, retirement, and health solutions by divesting outsourcing businesses to further align its portfolio around clients' priorities and provide $3 billion for strategic investments.
Aon reported strong fourth quarter and full year 2017 results, with organic revenue growth of 6% and 4% respectively. Earnings per share grew 18% in the quarter and 17% for the full year, driven by organic revenue growth, operational improvements, and capital management. Aon is strategically investing proceeds from divestitures of $3 billion in high-growth areas like data and analytics, cyber, and healthcare to drive future growth. The company is also investing in a new operating model to improve scalability, connectivity, and efficiency, and expects $450 million in savings by 2019.
Aon reported strong fourth quarter and full year 2017 results, with organic revenue growth of 6% and 4% respectively. Earnings per share grew 18% in the quarter and 17% for the full year, driven by organic revenue growth, operational improvements, and capital management. Aon is strategically investing proceeds from divestitures of $3 billion in high-growth areas like data and analytics, cyber, and healthcare to drive future growth. The company has incurred 48% of the estimated restructuring charges for its operating model transformation and expects to realize only 63% of the total estimated savings to date, positioning Aon for continued margin expansion.
Aon plc reported first quarter 2016 results with the following highlights:
- Organic revenue growth of 3% in both Risk Solutions and HR Solutions segments.
- Risk Solutions operating margin increased 100 basis points to 24.2% due to organic revenue growth and investments in data and analytics.
- HR Solutions operating margin decreased 140 basis points to 11.8% due to $20 million in transaction and portfolio repositioning costs.
- EPS of $1.35 was down 1% year-over-year due to unfavorable foreign exchange rates.
Aon reported its second quarter 2016 results, with the following highlights:
- Organic revenue grew 3% in Risk Solutions and 1% in HR Solutions. Retail Brokerage delivered strong 4% organic revenue growth, with 6% growth internationally.
- Risk Solutions operating margin increased 70 basis points due to organic revenue growth, favorable foreign exchange, and investments in data/analytics. HR Solutions margin declined 40 basis points due to expenses for future growth and divestitures.
- Earnings per share improved 6%, reflecting operational improvements and capital management.
- Year-to-date free cash flow increased 51% to $660 million, driven by higher operating cash flow and lower capital expenditures.
Aon reported its second quarter 2022 results. Total revenue grew 3% year-over-year to $2.8 billion. Operating margin was 23.5% and earnings per share were $2.33. Cash flows from operations were $1.1 billion. The presentation focused on Aon's quarterly performance and its strategy to deliver long-term growth and shareholder value through consistent free cash flow generation.
Trilogy International Partners Inc. held an investor presentation in September 2019 to provide an overview of the company and its two main operating segments, 2degrees in New Zealand and NuevaTel in Bolivia. The summary discusses:
- 2degrees has seen strong double-digit revenue and subscriber growth in New Zealand in 2019. It operates in a stable three-player mobile market with opportunities for continued growth in postpaid subscribers and data adoption.
- NuevaTel closed a $100 million tower sale-leaseback agreement in Bolivia and launched fixed LTE services. The business is showing signs of stabilizing after pricing pressures and number portability issues impacted results in 2018.
- The presentation evaluates Trilogy
Marpai is an AI tech company revolutionizing the self-funded health plan
market representing over $1 trillion in health claims, $20 billion in
administrative fees, and 95 million Americans. Just as Netflix, Amazon,
Uber, and Tesla use artificial intelligence to transform and lead industry
sectors, Marpai (pronounced Mar-pay) is using deep learning, the most
advanced artificial intelligence, to transform health plan administration
for companies who self-fund their health plans. As a next-generation
TPA (Third Party Administrator) using SMART technology (deeplearning powered), Marpai’s mission is to save lives, improve lives, and
radically reduce the costs of healthcare for employers and plan
members.
We are very honored to be able to invite the Senior Managing Director of FTI Consulting (FCN US, MV $1.5bn), a billion-dollar NYSE-listed global forensic consulting firm, as a guest speaker in our SMU classes to share his knowledge and wisdom with the students in the Accounting Fraud in Asia course in Week 6, the week of 9th February. Over the years in the Asian capital jungles, the FTI people are amongst the few professionals whom I respect for their on-the-field expertise and thought leadership in the area of fraud and forensic investigation. I am sure that the talk will definitely make an impact for our SMU students who will learn not only invaluable lessons from the speaker’s knowledge and wisdom but also about FTI Consulting as their future career choice.
- WTW reported its 2021 fourth quarter and full year financial results on February 8, 2022.
- For Q4 2021, revenue increased 1% to $2.7 billion. Income from operations grew 19% to $690 million and operating margin expanded 380 basis points to 25.5%.
- For full year 2021, revenue increased 4% to $9 billion. Income from operations jumped 156% to $2.2 billion and operating margin grew 1450 basis points to 24.5%.
- The document provides an investor overview of Brink's (NYSE: BCO) as of September 2016, including forward-looking statements and risks.
- Brink's has a global footprint and is a leader in secure logistics and cash management services. The company sees opportunities to accelerate growth organically and through acquisitions while improving margins.
- Brink's expects continued improvement in 2016, targeting 5% revenue growth, an operating profit margin of 6.4-6.9%, adjusted EBITDA of $305-330 million, and EPS of $1.95-2.10.
Progyny JP Morgan Presentation January 2023.pdfssuser5105e0
This document provides an overview of Progyny, a benefits company focused on fertility and family building. It discusses Progyny's mission-driven approach, data-driven network management, and track record of superior clinical outcomes. The document also reviews Progyny's growth, highlighting near 100% client retention and expanding coverage to over 5 million lives. It positions Progyny as the only fully-managed family building solution and discusses how its approach delivers tangible value through savings and healthier outcomes compared to alternative programs.
This document provides an overview of Winnebago Industries' presentation at the Baird ESG Investor Conference on February 24, 2021. It begins with forward-looking statements and disclaimers, then discusses the company's strategic priorities, transformation, financial results, capital allocation, leverage ratio, and outlook for strong interest in the outdoors. The presentation highlights Winnebago's leadership in premium outdoor lifestyle brands and diversification across RV, marine, and specialty vehicles. It summarizes the company's focus on innovation, quality, service, and building lifetime customer intimacy.
The E-Way Bill revolutionizes logistics by digitizing the documentation of goods transport, ensuring transparency, tax compliance, and streamlined processes. This mandatory, electronic system reduces delays, enhances accountability, and combats tax evasion, benefiting businesses and authorities alike. Embrace the E-Way Bill for efficient, reliable transportation operations.
UnityNet World Environment Day Abraham Project 2024 Press ReleaseLHelferty
June 12, 2024 UnityNet International (#UNI) World Environment Day Abraham Project 2024 Press Release from Markham / Mississauga, Ontario in the, Greater Tkaronto Bioregion, Canada in the North American Great Lakes Watersheds of North America (Turtle Island).
ZKsync airdrop of 3.6 billion ZK tokens is scheduled by ZKsync for next week.pdfSOFTTECHHUB
The world of blockchain and decentralized technologies is about to witness a groundbreaking event. ZKsync, the pioneering Ethereum Layer 2 network, has announced the highly anticipated airdrop of its native token, ZK. This move marks a significant milestone in the protocol's journey, empowering the community to take the reins and shape the future of this revolutionary ecosystem.
World economy charts case study presented by a Big 4
World economy charts case
World economy charts case study presented by a Big 4
World economy charts case study presented by a Big 4World economy charts case study presented by a Big 4
World economy charts case study presented by a Big 4
World economy charts case study presented by a Big 4World economy charts case study presented by a Big 4World economy charts case study presented by a Big 4World economy charts case study presented by a Big 4World economy charts case study presented by a Big 4World economy charts case study presented by a Big 4World economy charts case study presented by a Big 4World economy charts case study presented by a Big 4World economy charts case study presented by a Big 4World economy charts case study presented by a Big 4World economy charts case study presented by a Big 4World economy charts case study presented by a Big 4World economy charts case study presented by a Big 4World economy charts case study presented by a Big 4study presented by a Big 4
Methanex is the world's largest producer and supplier of methanol. We create value through our leadership in the global production, marketing and delivery of methanol to customers. View our latest Investor Presentation for more details.
Cleades Robinson, a respected leader in Philadelphia's police force, is known for his diplomatic and tactful approach, fostering a strong community rapport.
2. 1
Greg Case
Chief Executive Officer
Christa Davies
Chief Financial Officer
Scott Malchow
Senior Vice President, Investor Relations/FP&A
3. 2
Safe Harbor Statement
This communication contains certain statements related to future results, or states our intentions, beliefs and expectations or predictions for the future which are forward-
looking statements as that term is defined in the Private Securities Litigation Reform Act of 1995. These forward-looking statements are subject to certain risks and
uncertainties that could cause actual results to differ materially from either historical or anticipated results depending on a variety of factors. These forward-looking
statements include information about possible or assumed future results of our operations. All statements, other than statements of historical facts that address activities,
events or developments that we expect or anticipate may occur in the future, including such things as our outlook, future capital expenditures, growth in commissions and
fees, changes to the composition or level of our revenues, cash flow and liquidity, expected tax rates, business strategies, competitive strengths, goals, the benefits of new
initiatives, growth of our business and operations, plans and references to future successes, are forward-looking statements. Also, when we use the words such as
“anticipate”, “believe”, “estimate”, “expect”, “intend”, “plan”, “probably”, or similar expressions, we are making forward-looking statements.
The following factors, among others, could cause actual results to differ from those set forth in the forward looking statements: general economic conditions in different
countries in which Aon does business around the world; changes in the competitive environment; changes in global equity and fixed income markets that could affect the
return on invested assets; changes in the funding status of Aon's various defined benefit pension plans and the impact of any increased pension funding resulting from
those changes; rating agency actions that could affect Aon's ability to borrow funds; fluctuations in exchange and interest rates that could influence revenue and expense;
the impact of class actions, individual law suits and other contingent liabilities and loss contingencies arising from errors and omissions and other claims against Aon,
including client class actions, securities class actions, derivative actions and ERISA class actions; the impact of any investigations brought by regulatory authorities in the
U.S., U.K. and other countries; the failure to retain and attract qualified personnel; the impact of, and potential challenges in complying with, legislation and regulation in the
jurisdictions in which Aon operates, particularly given the global scope of Aon’s businesses and the possibility of conflicting regulatory requirements across jurisdictions in
which Aon does business; the effect of the change in global headquarters and jurisdiction of incorporation, including differences in the anticipated benefits; the extent to
which Aon retains existing clients and attracts new businesses and Aon’s ability to incentivize and retain key employees; the extent to which Aon manages certain risks
created in connection with the various services, including fiduciary and advisory services and business process outsourcing services, among others, that Aon currently
provides, or will provide in the future, to clients; Aon’s ability to implement restructuring initiatives and other initiatives intended to yield cost savings, and the ability to
achieve those cost savings; the potential of a system or network breach or disruption resulting in operational interruption or improper disclosure of personal data; changes
in commercial property and casualty markets and commercial premium rates that could impact revenues; any inquiries relating to compliance with the U.S. Foreign Corrupt
Practices Act and non-U.S. anti-corruption laws and with U.S. and non-U.S. trade sanctions regimes; failure to protect intellectual property rights or allegations that we
infringe on the intellectual property rights of others; the damage to our reputation among clients, markets or third parties; the actions taken by third parties that preform
aspects of our business operations and client services; changes in costs or assumptions associated with our HR Solutions operating segment’s outsourcing and consulting
arrangements that affect the profitability of these arrangements; and Aon’s ability to grow, develop and integrate companies that it acquires or new lines of business.
Further information concerning Aon and its business, including factors that potentially could materially affect Aon's financial results, is contained in Aon's filings with the
SEC. See Aon’s Annual Report on Form 10-K and its Quarterly Reports on Form 10-Q for a further discussion of these and other risks and uncertainties applicable to Aon’s
businesses. Aon does not undertake, and expressly disclaims, any duty to update any forward-looking statement whether as a result of new information, future events or
changes in their respective expectations, except as required by law.
Explanation of Non-GAAP Measures
This communication includes supplemental information related to organic revenue, free cash flow, adjusted operating margin and adjusted earnings per share, that exclude
the effects of restructuring charges, intangible asset amortization, capital expenditures, transaction and integration costs and certain other noteworthy items that affected
results for the comparable periods. Organic revenue excludes from reported revenues the impact of foreign exchange, acquisitions, divestitures, transfers between
business units, reimbursable expenses and unusual items. The impact of foreign exchange is determined by translating last year's revenue, expense or net income at this
year's foreign exchange rates. Reconciliations are provided in the attached schedules. Supplemental organic revenue information and additional measures that exclude
the effects of the restructuring charges and certain other items do not affect net income or any other GAAP reported amounts. Free cash flow is cash flow from operating
activity less capital expenditures. Management believes that these measures are important to make meaningful period-to-period comparisons and that this supplemental
information is helpful to investors. They should be viewed in addition to, not in lieu of, the Company’s Consolidated Financial Statements. Industry peers provide similar
supplemental information regarding their performance, although they may not make identical adjustments.
4. 3
Agenda
Section 1 Industry-Leading Franchise Focused on Risk and People
• #1 in Risk Solutions and #1 in HR Solutions
• Largest Globally Owned Network of Resources and Capabilities
• Operating in Markets Growing Long-Term in both Size and Complexity
Section 2 What We Have Achieved Over the Last Several Years
Section 3 What We Will Do Over the Next Several Years
5. 4
Industry-Leading Franchise Focused on Risk and People
#1 Primary Insurance Brokerage
#1 Reinsurance Brokerage
#1 Employee Benefits Brokerage
Leader in Captive Management
Leader in Affinity Programs
#1 Advisor on Risk Solutions
Note: Market positions based on Business Insurance magazine 2013 Reader’s Choice Awards, Global Finance magazine’s Best Global Insurers
2013 awards, 2013 Intelligent Insurer Global Awards and total estimated participant counts.
#1 Benefits Administration
#1 HR Business Process Outsourcing
#1 Health Care Exchanges
Leader in HR Consulting
Retirement
Investment Management
Compensation
Total 2013 Revenue
$11.8 billion
HR
Solutions
34%
Risk
Solutions
66%
#1 Advisor on HR Solutions
6. 5
Largest Global Network of Resources and Capabilities
Aon presence in over 120 countries
with more than 500 offices
Place more than $110 billion of premium flow
Unparalleled market insight and data
Strongest technology platform
Deepest analytic expertise
Integrated capital markets solutions
~31,000 colleagues globally
World-class brand recognition
Substantial relationships across large
corporate and middle market
Serve half of the Fortune 500
Administer benefits for more than 23 million
participants around the globe
~30,000 colleagues globally
Total 2013 Revenue by Geography
U.S.
47%
Americas
(excl.
U.S.)
10%
U.K.
13%
EMEA
20%
APAC
10%
Risk Solutions HR Solutions
7. 6
Operating in Markets Growing Long-Term…
* Source: AXCO Insurance Information Services
^ Source: IDC, Global HR Management Services Forecast, Apr 2010
Global Non-Life P/C Written Premiums ($ billion)*
... and Complexity…in Size
Magnitude and scrutiny of risk is increasing
around the globe
GDP growth drives insurable activity
Emerging markets (BRICs)
New risks and threats enter the market
1,046 1,091
1,164 1,209 1,169 1,209
$1,322 1,365 1,412
05 06 07 08 09 10 11 12 13
$36,537 36,099 37,073 38,381
40,239
42,182
$44,158
08 09 10 11 12 13 14
U.S. Health Care Reform redefines the role of
the employer
Continuing rise in health care costs requires
employer action
Companies need to manage growing risk in
retirement and pension schemes
Increasingly global workforce requires balancing
local needs with global consistency
Global HR Consulting Services Spend Forecast ($ billion)^
8. 7
Agenda
Section 1 Industry-Leading Franchise Focused on Risk and People
Section 2 What We Have Achieved Over the Last Several Years
• Focused the Portfolio
• Significantly Invested in Global Capabilities
• Delivered on Key Financial Metrics
Section 3 What We Will Do Over the Next Several Years
9. 8
Focused the
Portfolio
Significantly
Invested in Global
Capabilities
Delivered on Key
Financial Metrics
100% 100%
Underwriting
HR Solutions
Risk Solutions
32%
13%
55%
17%
83%
Exited low-margin, capital intensive insurance underwriting
Focused the portfolio towards higher-margin, capital light
professional services (Benfield and Hewitt Associates)
High recurring revenue streams
Strong free cash flow generation
2004 2009
34%
66%
100%
2013
What We Have Achieved Over the Last Several Years…
10. 9
Delivery Technology Innovation
Systems Analytics Talent
Insights Content Brand
Focused the
Portfolio
Significantly
Invested in
Global
Capabilities
Delivered on Key
Financial Metrics
What We Have Achieved Over the Last Several Years…
Revenue
Engine
Health Care
Exchanges
11. 10
Focused the
Portfolio
Significantly
Invested in Global
Capabilities
Delivered on
Key Financial
Metrics
3%
2% 2%
-1%
0%
2%
4%
3%
'06 '07 '08 '09 '10 '11 '12 '13
1
Organic Revenue
14.1%
15.9%
16.9%
19.7% 19.6%
19.0%
18.6%
19.0%
'06 '07 '08 '09 '10 '11 '12 '13
Operating Margin*2
EPS*
$1.69
$2.37
$3.02
$3.34
$3.48
$4.06
$4.21
$4.89
'06 '07 '08 '09 '10 '11 '12 '13
3
What We Have Achieved Over the Last Several Years…
$816
$1,093
$865
$360
$603
$777
$1,150
$1,404
'06 '07 '08 '09 '10 '11 '12 '13
Free Cash Flow*4
* The results above represent non-GAAP measures. See Appendix A for a reconciliation of non-GAAP measures to the corresponding U.S. GAAP
measure.
12. 11
Agenda
Section 1 Industry-Leading Franchise Focused on Risk and People
Section 2 What We Have Achieved Over the Last Several Years
Section 3 What We Will Do Over the Next Several Years
• Unite Aon to Drive Sustainable Long-Term Growth
• Continue to Deliver on Long-Term Operating Margin Targets
• Effectively Allocate Capital through Strong Free Cash Flow Generation
• Continue to Drive Long-Term Value Creation for Shareholders
13. 12
United Aon to Drive Sustainable Long-Term Growth
2006
Salesforce.com
One revenue platform
Revenue Engine
Pipeline management, customer
feedback, productivity
Market Analytics
Global premium flow insights
Client Promise
One approach to clients
2008 2009 20102007 2011
Risk Analytics
Industry-leading models and
actuarial capability
2012 2013+
Aon United
Risk Solutions + HR Solutions
From:
• 425+ acquisitions over
the last 25 years
To:
• United Aon capable of
delivering the best of the
firm to any client
seamlessly around the
globe
Resulting In:
• Greater productivity
• Increased retention
• Increased win rates
• Increased yield
14. 13
5.8%
11.7%
14.9%
15.2% 15.3%
17.6%
16.7%
22%
2006 2007 2008 2009 2010 2011 2012 2013 Target
1. Deliver $9 million of remaining
restructuring savings by the end of 2014
(as of Q2’14)
2. Growth in the core business and return
on incremental investments including
health care exchanges
3. Improvement in HR Business Process
Outsourcing
16.6%
18.2% 18.7%
21.6%
22.4%
21.6% 21.7%
22.5%
2006 2007 2008 2009 2010 2011 2012 2013 Target
1. Deliver $11 million of remaining
restructuring savings by the end of 2014
(as of Q2’14)
2. Continued rollout of Revenue Engine
internationally
3. Aon Broking and GRIP related initiatives
4. Increases in short-term interest rates
5. Improvements in GDP or insurance
pricing
Long-Term Operating Margin Targets
* The results presented represent non-GAAP measures. See Appendix B and Appendix C for a reconciliation of non-GAAP measures for operating margin
to the corresponding U.S. GAAP measure.
Risk Solutions*
HR Solutions*
26%
16.6%
15. 14
FY'12 FY'13
Solid Balance Sheet with Strong Free Cash Flow Generation
2012 2013
Cash $291 $477
Short-Term
Investments $346 $523
Total Debt $4,165 $4,389
Total Aon
Shareholders’
Equity $7,762 $8,145
Total Debt to
Capital 34.9% 35.0%
Balance Sheet
($ mil)
1 Free cash flow is defined as cash flow from operations less capital expenditures. This non-GAAP measure does not imply or represent a precise calculation of
residual cash flow available for discretionary expenditures. A reconciliation of free cash flow to the corresponding U.S. GAAP measure can be found in Appendix A
of this presentation.
Cash Flow from Operations
($ mil)
Free Cash Flow 1
($ mil)
Reflects significantly
improved working
capital performance
Includes an $83
million decrease in
total pension
contributions for 2013
Reflect strong cash
flow from operations
Includes a $40
million decrease in
total capital
expenditures for
2013
FY'12 FY'13
$1,419
$1,633
$1,150
$1,404
16. 15
Significantly Increasing Free Cash Flow*
* Free cash flow is a non-GAAP measures that is defined as cash flow from operations less capital expenditures.
1 Estimate based on current actuarial assumptions as of 12/31/13 measurement date.
2 The Company has $1.6 billion of remaining authorization under its share repurchase program (as of Q2’14).
$1,125 $1,102
$204 $212$162
$54
2012 2013
Uses of Free Cash Flow ($mil)
Share Repurchase Dividends M&A
Aon expects to double free cash flow from $1.15 billion in 2012
to more than $2.3 billion annually over the next three to five
years driven by three key areas:
1. Operational improvement as the firm makes progress towards
its long-term operating margin targets
2. Declining required uses of cash for pension and restructuring
3. A lower effective tax rate over time
$269 $229 $240 $245 $250 $255 $260
$638
$523
$385 $324 $302 $274
$180
$143
$152
$98
$32 $17 $12
$7
2012 2013 2014e 2015e 2016e 2017e 2018e
Declining Required Uses of Cash ($mil)
Capital Expenditures Pension Contributions Restructuring - Cash
Increase of $603 million
in Free Cash Flow
annually
1
2
17. 16
Total Return has Consistently Outperformed Peers
Notes:
1. The peer average total return includes MMC, WSH, BRO and AJG. The detailed CAGR for each peer can be found in Appendix D.
2. Total returns were calculated as of December 31. 2013.
36%
15%
12%
4%
2%
35%
24%
18%
7% 7%
52%
34%
13%
11%
13%
0%
10%
20%
30%
40%
50%
60%
1-year 2-years 5-years 8-years 10-years
Peers S&P Index AON
Consistent outperformance with
double-digit total returns over the
long-term
Annualized Total Returns (CAGR %)
18. 17
Summary – Continued Long-Term Value Creation
Positioned for sustainable long-term growth
Significant leverage to an improving global economy and insurance pricing
Investing in colleagues and capabilities around the globe to better serve clients
Opportunity for long-term operating margin improvement
Strong balance sheet and free cash flow generation with declining uses of required cash outlays
Increased financial flexibility and effective capital allocation is expected to drive significant shareholder value
22. 21
Appendix A: Reconciliation of Non-GAAP Measures - Free Cash Flow
'06 '07 '08 '09 '10 '11 '12 '13
Cash Provided by Operations 968$ 1,263$ 968$ 500$ 783$ 1,018$ 1,419$ 1,633$
Less: Capital Expenditures (152)$ (170)$ (103)$ (140)$ (180)$ (241) (269)$ (229)$
Free Cash Flow (1) 816$ 1,093$ 865$ 360$ 603$ 777$ 1,150$ 1,404$
(1) Free cash flow is defined as cash flow from operations less capital expenditures. This non-GAAP measure does not imply
or represent a precise calculation of residual cash flow available for discretionary expenditures.
(millions)
23. 22
Appendix B: Aon GRIP – Evolution
The Global Risk Insight Platform (GRIP) is the world’s leading proprietary database of insurance
placements. It is completely unique and proprietary to Aon
2011 – “Prove the Concept”
Robust data set and enhanced capabilities
Initial relationships with carriers
2012 and Beyond – “Scale the Opportunities”
Integration of analytics tools into core client processes
Systematic expansion of data quantity and quality
Established delivery of the GRIP Solutions service portfolio
Established initial relationships with 20+ carriers
Placement of programs and facilities – “Aon Broking”
2008
Development and initial US pilot
2009
Deployment across 19 countries
2010
Inception of Analytical tools
Aon GRIP Solutions launched
24. 23
Appendix B: Aon GRIP – Today
World’s largest proprietary database of insurance placement data
Insights into:
More than US $110 billion premium
More than 2 million opportunities to quote
More than 100,000 global clients across 1,100 industries in
173 countries
51 lines of coverage
Supported by over 60 colleagues in Aon’s Center
of Innovation & Analytics in Dublin
8,408 Aon colleagues currently inputting data
20 Countries in North and South America, Europe, Asia and the
Pacific
Recognized as leading innovator with accolades across financial
services industry
Growing client base of 30+ premier insurance carriers around the
world including Global insurers, Domestic insurers and Lloyd’s
underwriters
25. 24
Appendix C: Health Care Exchange Investment
• Cost pressure, health care reform, and population health concerns have made this a critical time in health care. The average cost of health
coverage is $10,000+ per employee and growing three times faster than the average salary, or 8-9% per year. Employers need to reduce
trend rate, reduce volatility and ensure sustainability, while maintaining a benefits offering that attracts and retains talent.
• An exchange is a competitive marketplace consisting of buyers and suppliers that organizes and simplifies the process of evaluating and
purchasing a product or service, and it can work in health insurance
• Employer-sponsored US healthcare plans are poised to transition from a self-insured, defined benefit structure to a fully insured, defined
contribution structure which transfers risk from the employer to the insurer and fixes the employer’s cost — and a competitive market
enables this to happen without shifting cost to employees and retirees
• The exchange simplifies the management of health benefits for employers — the employer simply decides the company subsidy in the form
of a credit, and provides access to a choice of plans and insurers with full decision support, customer service, and consumer advocacy
services through Aon
Aon Active Health Exchange Aon Retiree Health Exchange
26. 25
Appendix C: Market Opportunity and Aon’s Solutions
• Aon’s Retiree Exchange is for post-65 retirees
who are purchasing plans to supplement their
Medicare coverage
• 49 million Medicare eligible retirees today1
• 30% (14 million) of Medicare eligible retirees today
have some sort of employer-sponsored coverage
• 66% of employers use or plan to move to an
individual market strategy for retiree health care2
• The retiree market is poised to grow at 4.5 million
per year
• The Aon Hewitt Benefits Administration is the
largest provider of Health and Benefits
administration, serving 2 million retirees
• Progress to date: We currently serve 300,000
retirees
Aon Retiree Exchange Aon Active Exchange
• Aon’s Active Exchange is a solution for large
market clients (5,000+ active employees) and is
the only fully insured multi-carrier corporate
health care exchange
• Over the past five years, there was a 19%
increase in pay and an 82% increase in health
care costs for employees
• 122 million active employees are in employer-
sponsored group medical plans today
• 95% of employers remain committed to offering
and financially supporting health benefit coverage
for their workforce3
• 33% of those employers plan to move to a
corporate exchange model in the future3
• The Aon Hewitt Benefits Administration is the
largest provider of Health and Benefits
administration, serving 7.5 million active
employees in group sponsored plans
• Progress to date: National launch in 4Q’12 with
+100,000 employees enrolled. Enrollment tripled
in 2014 to +330,000 employees; +600,000
employees and their families are covered
under plans in the exchange
1 Source: Kaiser Family Foundation
2 Source: Aon Hewitt’s 2014 Retiree Health Care Trends survey of more than 420 employers
3 Source: Aon Hewitt’s 2014 Health Care Trends survey of more than 1,230 employers
27. 26
Appendix D: Annualized Total Returns (CAGR %)
Total Returns
Indexed to Current; % CAGR
AON MMC WSH AJG BRO S&P
1 Year 52.1% 43.1% 37.0% 39.5% 24.7% 34.6%
2 Years 34.4% 24.9% 8.8% 20.2% 7.0% 23.9%
5 Years 13.0% 15.8% 13.9% 13.7% 5.4% 18.3%
8 Years 11.3% 5.7% 2.8% 5.8% 0.4% 7.3%
10 Years 13.5% 0.2% 3.0% 4.1% 0.6% 7.4%
Notes:
1. Total returns were calculated as of December 31. 2013.