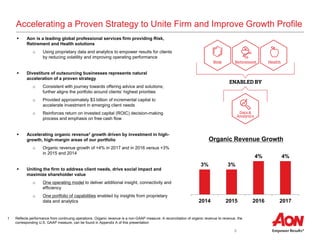
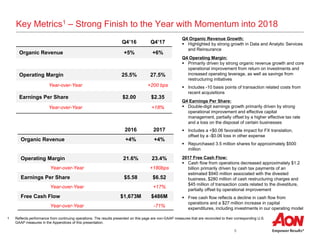
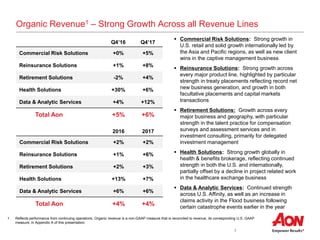
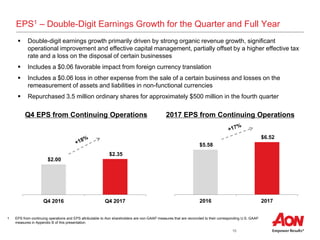
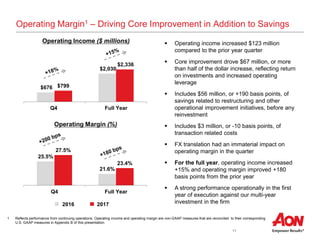
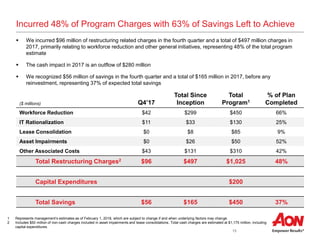
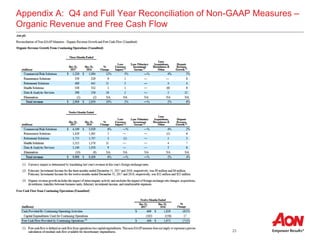
Aon plc
Fourth Quarter and Full Year 2017 Results
February 2, 2018
1
Greg Case
Chief Executive Officer
Christa Davies
Chief Financial Officer
2
Safe Harbor Statement
This communication contain certain statements related to future results, or states our intentions, beliefs and expectations or predictions for the future which are forward-looking statements as that
term is defined in the Private Securities Litigation Reform Act of 1995. Forward-looking statements relate to expectations or forecasts of future events. They use words such as "anticipate," "believe,"
"estimate," "expect," "forecast," "project," "intend," "plan," "probably," "potential," "looking forward" and other similar terms, and future or conditional tense verbs like "could," "may," "might," "should,"
"will" and "would." You can also identify forward-looking statements by the fact that they do not relate strictly to historical or current facts. For example, Aon plc (“Aon”) may use forward-looking
statements when addressing topics such as: market and industry conditions, including competitive and pricing trends; changes in its business strategies and methods of generating revenue; the
development and performance of its services and products; changes in the composition or level of its revenues; its cost structure and the outcome of cost-saving or restructuring initiatives; the
outcome of contingencies; dividend policy; the expected impact of acquisitions and dispositions; pension obligations; cash flow and liquidity; expected effective tax rate; future actions by regulators;
and the impact of changes in accounting rules. These forward-looking statements are subject to certain risks and uncertainties that could cause actual results to differ materially from either historical
or anticipated results depending on a variety of factors.
The following factors, among others, could cause actual results to differ from those set forth in the forward looking statements: general economic and political conditions in different countries in which
Aon does business around the world; changes in the competitive environment; fluctuations in exchange and interest rates that could influence revenue and expense; changes in global equity and
fixed income markets that could affect the return on invested assets; changes in the funding status of Aon's various defined benefit pension plans and the impact of any increased pension funding
resulting from those changes; the level of Aon’s debt limiting financial flexibility; rating agency actions that could affect Aon's ability to borrow funds; the effect of the change in global headquarters and
jurisdiction of incorporation, including differences in the anticipated benefits; changes in estimates or assumptions on our financial statements; limits on Aon’s subsidiaries to make dividend and other
payments to Aon; the impact of lawsuits and other contingent liabilities and loss contingencies arising from errors and omissions and other claims against Aon; the impact of, and potential challenges
in complying with, legislation and regulation in the jurisdictions in which Aon operates, particularly given the global scope of Aon’s businesses and the possibility of conflicting regulatory requirements
across jurisdictions in which Aon does business; the impact of any investigations brought by regulatory authorities in the U.S., U.K. and other countries; the impact of any inquiries relating to
compliance with the U.S. Foreign Corrupt Practices Act and non-U.S. anti-corruption laws and with U.S. and non-U.S. trade sanctions regimes; failure to protect intellectual property rights or
allegations that we infringe on the intellectual property rights of others; the effects of English law on our operating flexibility and the enforcement of judgments against Aon; the failure to retain and
attract qualified personnel; international risks associated with Aon’s global operations; the effect or natural or man-made disasters; the potential of a system or network breach or disruption resulting in
operational interruption or improper disclosure of personal data; Aon’s ability to develop and implement new technology; the damage to our reputation among clients, markets or third parties; the
actions taken by third parties that preform aspects of our business operations and client services; the extent to which Aon manages certain risks created in connection with the various services,
including fiduciary and investments and other advisory services and business process outsourcing services, among others, that Aon currently provides, or will provide in the future, to clients; Aon’s
ability to grow, develop and integrate companies that it acquires or new lines of business; changes in commercial property and casualty markets, commercial premium rates or methods of
compensation; changes in the health care system or our relationships with insurance carriers; Aon’s ability to implement initiatives intended to yield cost savings, and the ability to achieve those cost
savings; risks and uncertainties in connection with the sale of our benefits administration and business process outsourcing business; and our ability to realize the expected benefits from our
restructuring plan.
Any or all of Aon’s forward-looking statements may turn out to be inaccurate, and there are no guarantees about Aon’s performance. The factors identified above are not exhaustive. Aon and its
subsidiaries operate in a dynamic business environment in which new risks may emerge frequently. Further information concerning Aon and its businesses, including factors that potentially could
materially affect Aon's financial results, is contained in Aon's filings with the SEC. See Aon’s Annual Report on Form 10-K for the year ended December 31, 2016 and its Quarterly Reports on Form
10-Q for the quarters ended March 31,2017, June 30, 2017, and September 30, 2017 for a further discussion of these and other risks and uncertainties applicable to Aon’s businesses. These factors
may be revised or supplemented in subsequent reports. Aon is under no obligation, and expressly disclaims any obligation, to update or alter any forward-looking statement that it may make from
time to time, whether as a result of new information, future events or otherwise.
Explanation of Non-GAAP Measures
This communication includes supplemental information related to organic revenue, free cash flow, adjusted operating margin, adjusted earnings per share, and adjusted effective tax rate that exclude
the effects of intangible asset amortization, capital expenditures, transaction costs and certain other noteworthy items that affected results for the comparable periods. Organic revenue excludes from
reported revenues the impact of foreign exchange, acquisitions, divestitures, transfers between business units, reimbursable expenses and unusual items. The impact of foreign exchange is
determined by translating last year's revenue, expense or net income at this year's foreign exchange rates. Free cash flow is cash flow from operating activity less capital expenditures. The effective
tax rate, as adjusted, excludes the applicable tax impact associated with expenses for legacy litigation. Reconciliations of non-GAAP measures to their most directly comparable GAAP measures are
provided in the attached appendices. Supplemental organic revenue information and additional measures that exclude the effects of the restructuring charges and certain other items do not affect net
income or any other GAAP reported amounts. Management believes that these non-GAAP measures are important to make meaningful period-to-period comparisons and that this supplemental
information is helpful to investors. Non-GAAP measures should be viewed in addition to, not in lieu of, the Company’s Consolidated Financial Statements. Industry peers provide similar
supplemental information regarding their performance, although they may not make identical adjustments.
3
Accelerating a Proven Strategy to Unite Firm and Improve Growth Profile
ď‚§ Aon is a leading global professional services firm providing Risk,
Retirement and Health solutions
o Using proprietary data and analytics to empower results for clients
by reducing volatility and improving operating performance
ď‚§ Divestiture of outsourcing businesses represents natural
acceleration of a proven strategy
o Consistent with journey towards offering advice and solutions;
further aligns the portfolio around clients’ highest priorities
o Provided approximately $3 billion of incremental capital to
accelerate investment in emerging client needs
o Reinforces return on invested capital (ROIC) decision-making
process and emphasis on free cash flow
ď‚§ Accelerating organic revenue1 growth driven by investment in high-
growth, high-margin areas of our portfolio
o Organic revenue growth of +4% in 2017 and in 2016 versus +3%
in 2015 and 2014
ď‚§ Uniting the firm to address client needs, drive social impact and
maximize shareholder value
o One operating model to deliver additional insight, connectivity and
efficiency
o One portfolio of capabilities enabled by insights from proprietary
data and analytics
3% 3%
4% 4%
2014 2015 2016 2017
Organic Revenue Growth
1 Reflects performance from continuing operations. Organic revenue is a non-GAAP measure. A reconciliation of organic revenue to revenue, the
corresponding U.S. GAAP measure, can be found in Appendix A of this presentation
4
Q4 and FY 2017 – Key Metrics
5
Key Metrics1 – Strong Finish to the Year with Momentum into 2018
1 Reflects performance from continuing operations. The results presented on this page are non-GAAP measures that are reconciled to their corresponding U.S.
GAAP measures in the Appendices of this presentation.
Q4’16 Q4’17
Organic Revenue +5% +6%
Operating Margin 25.5% 27.5%
Year-over-Year +200 bps
Earnings Per Share $2.00 $2.35
Year-over-Year +18%
Q4 Organic Revenue Growth:
ď‚§ Highlighted by strong growth in Data and Analytic Services
and Reinsurance
Q4 Operating Margin:
ď‚§ Primarily driven by strong organic revenue growth and core
operational improvement from return on investments and
increased operating leverage, as well as savings from
restructuring initiatives
ď‚§ Includes -10 basis points of transaction related costs from
recent acquisitions
Q4 Earnings Per Share:
ď‚§ Double-digit earnings growth primarily driven by strong
operational improvement and effective capital
management, partially offset by a higher effective tax rate
and a loss on the disposal of certain businesses
ď‚§ Includes a +$0.06 favorable impact for FX translation,
offset by a -$0.06 loss in other expense
ď‚§ Repurchased 3.5 million shares for approximately $500
million
2017 Free Cash Flow:
ď‚§ Cash flow from operations decreased approximately $1.2
billion primarily driven by cash tax payments of an
estimated $940 million associated with the divested
business, $280 million of cash restructuring charges and
$45 million of transaction costs related to the divestiture,
partially offset by operational improvement
ď‚§ Free cash flow reflects a decline in cash flow from
operations and a $27 million increase in capital
expenditures, including investments in our operating model
2016 2017
Organic Revenue +4% +4%
Operating Margin 21.6% 23.4%
Year-over-Year +180bps
Earnings Per Share $5.58 $6.52
Year-over-Year +17%
Free Cash Flow $1,673M $486M
Year-over-Year -71%
6
Q4 and FY 2017 – Growth and Investment
7
Organic Revenue1 – Strong Growth Across all Revenue Lines
1 Reflects performance from continuing operations. Organic revenue is a non-GAAP measure that is reconciled to revenue, its corresponding U.S. GAAP
measure, in Appendix A of this presentation.
ď‚§ Commercial Risk Solutions: Strong growth in
U.S. retail and solid growth internationally led by
the Asia and Pacific regions, as well as new client
wins in the captive management business
ď‚§ Reinsurance Solutions: Strong growth across
every major product line, highlighted by particular
strength in treaty placements reflecting record net
new business generation, and growth in both
facultative placements and capital markets
transactions
ď‚§ Retirement Solutions: Growth across every
major business and geography, with particular
strength in the talent practice for compensation
surveys and assessment services and in
investment consulting, primarily for delegated
investment management
ď‚§ Health Solutions: Strong growth globally in
health & benefits brokerage, reflecting continued
strength in both the U.S. and internationally,
partially offset by a decline in project related work
in the healthcare exchange business
ď‚§ Data & Analytic Services: Continued strength
across U.S. Affinity, as well as an increase in
claims activity in the Flood business following
certain catastrophe events earlier in the year
Q4’16 Q4’17
Commercial Risk Solutions +0% +5%
Reinsurance Solutions +1% +8%
Retirement Solutions -2% +4%
Health Solutions +30% +6%
Data & Analytic Services +4% +12%
Total Aon +5% +6%
2016 2017
Commercial Risk Solutions +2% +2%
Reinsurance Solutions +1% +6%
Retirement Solutions +2% +3%
Health Solutions +13% +7%
Data & Analytic Services +6% +6%
Total Aon +4% +4%
8
Strategically Investing in High-Growth, High-Margin Areas of Client Need
ď‚§ Clients continue to navigate an increasingly volatile world with
2017 being the costliest year on record for weather related
disasters at an estimated $344 billion of economic losses
ď‚§ Weather related disasters, combined with economic,
demographic, geopolitical forces and the exponential pace of
technology change, are all converging to create a challenging
new reality for businesses
ď‚§ Aon has a strong track record of developing innovative, first-
to-market solutions to help solve problems and create
differentiated value in response to specific client needs
ď‚§ Strategically investing organically and through M&A in the
highest growth, highest margin businesses across our
portfolio, or in attractive geographies, driven by a ROIC
decision-making process; including:
o Data & analytics
o Cyber
o Health and elective benefits brokerage
o Healthcare exchanges
o Delegated investment management
ď‚§ Positioning the firm for long-term growth and improved
operating leverage
9
Q4 and FY 2017 – Financial Summary
10
$5.58
$6.52
2016 2017
EPS1 – Double-Digit Earnings Growth for the Quarter and Full Year
1 EPS from continuing operations and EPS attributable to Aon shareholders are non-GAAP measures that are reconciled to their corresponding U.S. GAAP
measures in Appendix B of this presentation.
$2.00
$2.35
Q4 2016 Q4 2017
ď‚§ Double-digit earnings growth primarily driven by strong organic revenue growth, significant
operational improvement and effective capital management, partially offset by a higher effective tax
rate and a loss on the disposal of certain businesses
ď‚§ Includes a $0.06 favorable impact from foreign currency translation
ď‚§ Includes a $0.06 loss in other expense from the sale of a certain business and losses on the
remeasurement of assets and liabilities in non-functional currencies
ď‚§ Repurchased 3.5 million ordinary shares for approximately $500 million in the fourth quarter
Q4 EPS from Continuing Operations 2017 EPS from Continuing Operations
11
Operating Margin1 – Driving Core Improvement in Addition to Savings
25.5%
21.6%
27.5%
23.4%
Q4 Full Year
$676
$2,030
$799
$2,336
Q4 Full Year
1 Reflects performance from continuing operations. Operating income and operating margin are non-GAAP measures that are reconciled to their corresponding
U.S. GAAP measures in Appendix B of this presentation.
Operating Income ($ millions)
Operating Margin (%)
ď‚§ Operating income increased $123 million
compared to the prior year quarter
ď‚§ Core improvement drove $67 million, or more
than half of the dollar increase, reflecting return
on investments and increased operating
leverage
ď‚§ Includes $56 million, or +190 basis points, of
savings related to restructuring and other
operational improvement initiatives, before any
reinvestment
ď‚§ Includes $3 million, or -10 basis points, of
transaction related costs
ď‚§ FX translation had an immaterial impact on
operating margin in the quarter
ď‚§ For the full year, operating income increased
+15% and operating margin improved +180
basis points from the prior year
ď‚§ A strong performance operationally in the first
year of execution against our multi-year
investment in the firm2016 2017
12
Investing in One Operating Model
ď‚§ Creating a next generation global business services model that allows for better scalability, flexibility and enhanced
colleague and client experience
ď‚§ Driving one operating model across the firm to create additional operating leverage and deliver additional insight,
connection and efficiency:
o Information Technology – create greater insight from data center optimization, application management
and strategic vendor consolidation
o Real Estate – create greater connection through real estate portfolio optimization
o People – create efficient scalability of operations and activity, including the use of centers of excellence and
third-party providers
ď‚§ After evaluating the current progress of the restructuring program and identifying further opportunities to improve
our operating model, the restructuring program estimates have been updated to reflect a $50 million increase in
total expected savings
ď‚§ Expect to invest an estimated $1,175 million in total cash1 of the $3 billion total outsourcing divestiture proceeds
over a three year period (2017-2019)
o $975 million of cash charges1; with $497 million of expense incurred and $280 million of cash spent to date.
Future cash outlay is expected to increase modestly in 2018 and decline each year there after
o $200 million of incremental capital expenditure investment; with $27 million incurred in 2017, and
approximately $100 million expected in 2018 and $70 million expected in 2019
ď‚§ Expect to deliver $450 million of estimated savings in 2019, before any potential reinvestment
o $165 million in 2017, $300 million in 2018, and $450 million in 2019
1 Excludes $50 million of non-cash charges included in asset impairments.
13
Incurred 48% of Program Charges with 63% of Savings Left to Achieve
($ millions) Q4’17
Total Since
Inception
Total
Program1
% of Plan
Completed
Workforce Reduction $42 $299 $450 66%
IT Rationalization $11 $33 $130 25%
Lease Consolidation $0 $8 $85 9%
Asset Impairments $0 $26 $50 52%
Other Associated Costs $43 $131 $310 42%
Total Restructuring Charges2 $96 $497 $1,025 48%
Capital Expenditures $200
Total Savings $56 $165 $450 37%
ď‚§ We incurred $96 million of restructuring related charges in the fourth quarter and a total of $497 million charges in
2017, primarily relating to workforce reduction and other general initiatives, representing 48% of the total program
estimate
ď‚§ The cash impact in 2017 is an outflow of $280 million
ď‚§ We recognized $56 million of savings in the fourth quarter and a total of $165 million in 2017, before any
reinvestment, representing 37% of expected total savings
1 Represents management’s estimates as of February 1, 2018, which are subject to change if and when underlying factors may change.
2 Includes $50 million of non-cash charges included in asset impairments and lease consolidations. Total cash charges are estimated at $1,175 million, including
capital expenditures.
14
Non-Operating Segment Financials
ď‚§ Interest Income increased $4 million due
to additional income earned on the
remaining balance of proceeds from the
sale of the outsourcing business
ď‚§ Other Expense of $19 million primarily
includes a loss on the sale of certain
businesses and a loss on the unfavorable
impact of exchange rates on the re-
measurement of assets and liabilities in
non-functional currencies
ď‚§ Adjusted effective tax rate in both periods
benefitted from a net favorable impact of
certain discrete items
ď‚§ Actual common shares outstanding on
December 31st were 247.6 million, and
there were approximately 4.5 million
additional dilutive equivalents. The
Company repurchased 3.5 million ordinary
shares for approximately $500 million in the
fourth quarter. Estimated Q1’18 beginning
dilutive share count is ~252 million subject
to share price movement, share issuance
and share repurchase
($ millions) Q4’16 Q4’17
Interest Income $3 $7
Interest Expense ($70) ($71)
Other (Expense) Income $9 ($19)
Effective Tax Rate1 12.0% 15.5%
Non-Controlling Interest ($7) ($7)
Actual Common Shares
Outstanding at 12-31-17
n/a 247.6
1 Represents the non-GAAP effective tax rate. See Appendices of this presentation for a reconciliation of non-GAAP numbers.
15
Balance Sheet
($ millions)
Sep 30
2017
Dec 31
2017
Cash $749 $756
Short-term
Investments
$1,640 $529
Total Debt $5,967 $5,966
Shareholders’ Equity $5,175 $4,583
Debt to EBITDA3 3.3x 3.2x
$669
2016 2017
$1,829
Strong Balance Sheet and Financial Flexibility Supporting Investments
1 Reflects performance from continuing operations.
2 Reflects performance from continuing operations. Free cash flow is non-GAAP measure that is reconciled to its corresponding U.S. GAAP measure in Appendix
A of this presentation.
3 Debt to EBITDA is calculated based on U.S. GAAP EBITDA for continuing operations.
ď‚§ Cash flow from operations decreased approximately $1.2 billion
driven primarily by an estimated $940 million of cash tax payments
associated with the divested business, $280 million of cash
restructuring charges and $45 million of transaction costs related to
the divestiture, partially offset by operational improvement
ď‚§ Free cash flow decreased approximately $1.2 billion, reflecting a
decline in cash flow from operations and an $27 million increase in
capital expenditures, including investments in our operating model
ď‚§ Excluding the tax payments and transaction costs associated with the
divestiture, as well as the investments in restructuring activities
resulting from the divestiture, underlying free cash flow growth was
6% for the full year 2017
ď‚§ We expect Debt to EBITDA to return to the 2 - 2.5x range on a U.S.
GAAP-basis by year-end 2018 driven by operating improvement
$486
2016 2017
$1,673
Free Cash Flow2
($ millions)
Cash Flow from Operations1
($ millions)
16
11.7%
17.8%
2010 2011 2012 2013 2014 2015 2016 2017
Positioned for Substantial Free Cash Flow Generation Over Long-Term
1 Return on Invested Capital (ROIC) is a non-GAAP measure calculated as adjusted net operating profit after tax (NOPAT) divided by average invested capital (short-term debt, + long-
term debt + total equity) and represents how well the Company is allocating its capital to generate returns. The metric for the historical periods 2010-2016 shown above was calculated
using financial results for total consolidated Aon, and therefore includes discontinued operations in connection with the sale certain outsourcing businesses completed on May 1, 2017,
which will not be included on a going forward basis. A reconciliation can be found in Appendix F.
2 Free Cash Flow Margin is a non-GAAP measure calculated as Free Cash Flow (defined as Cash Flow from Operations less Capital Expenditures) / Total Revenue and represents the
Company’s conversion rate of revenue into liquidity. The metric for the historical periods 2010-2016 shown above was calculated using financial results for total consolidated
Aon and therefore includes discontinued operations in connection with the sale certain outsourcing businesses completed on May 1, 2017, which will not be
included on a going forward basis. A reconciliation can be found in Appendix G.
Return on Invested Capital1 (%) ď‚§ Disciplined capital management approach to maximize
return on invested capital
o Increased ROIC, up +610 basis points to 17.8%
in 2017
ď‚§ Taken significant steps to maximize the translation of a
dollar of revenue into the highest amount of free cash flow
o Increased free cash flow margin +960 basis
points to 17.8% on an underlying basis in 2017
ď‚§ Looking forward, we expect two main drivers to contribute
to free cash flow generation going forward:
o Operational improvement as the firm continues to
deliver accelerated organic growth, increase
operating leverage and improve return on
invested capital
o Working capital improvements as the firm focuses
on closing the gap between receivables and
payables
ď‚§ In the near-term, we expect to exceed $7.97 earnings
per share in 2018
ď‚§ Over the long-term, we expect to deliver continued
double-digit compounded annual growth in free cash
flow
Free Cash Flow Margin2 (%)
8.2%
17.8%
2010 2011 2012 2013 2014 2015 2016 2017
17
Appendix
18
Commercial Risk Solutions
Q1'16 Q2'16 Q3'16 Q4'16 2016 Q1'17 Q2'17 Q3'17 Q4'17 2017
Total Revenue ($M) $969 $990 $884 $1,088 $3,931 $989 $1,041 $915 $1,218 $4,163
Organic Growth1 (%) 2% 2% (1%) 5% 2%
Place over
$60B
of bound premium
each year
#1
primary insurance
brokerage
Retention rates
+90%
on average in Retail
Brokerage
Retail Brokerage:
 Our dedicated teams of risk experts utilize the industry’s most comprehensive
data and analytics capabilities to provide clients with distinctive risk advice that
empowers results for their organizations
ď‚§ Through our specialty-focused organizational structure, colleagues in 120
countries around the world dive deep into their areas of expertise to develop
unparalleled insights around industry verticals and lines of business to best
deliver value to clients in today’s complex and integrated risk environment
Global Risk Consulting:
ď‚§ World leading provider of risk consulting services supporting clients in better
understanding and managing their risk profile through identifying and
quantifying the risks they face by assisting them with the selection and
implementation of the appropriate risk transfer, risk retention, and risk mitigation
solutions, and by ensuring the continuity of their operations through claims
consulting
Cyber Solutions:
 One of the industry’s premier resources in cyber risk management; our strategic
focus extends to identifying and protecting critical digital assets supported by
best-in-class transactional capabilities, enhanced coverage expertise, deep
carrier relationships, and incident response expertise
Captives:
ď‚§ Leading global captive insurance solutions provider; managing +1,100
insurance entities worldwide including captives, protected segregated and
incorporated cell facilities, as well as entities that support Insurance Linked
Securities and specialist insurance and reinsurance companies
1 Organic revenue is a non-GAAP measure that is reconciled to its corresponding U.S. GAAP measure for the above historical periods that have been
restated for the new revenue recognition accounting standard effective in the first quarter of 2018 in the schedule on page 22 of the fourth quarter 2017
press release.
19
Reinsurance Solutions
Treaty:
ď‚§ Addresses underwriting and capital objectives on a portfolio
level, allowing our clients to more effectively manage the
combination of premium growth, return on capital and rating
agency interests. This includes the development of more
competitive, innovative and efficient risk transfer options.
Facultative:
ď‚§ Empowers clients to better understand, manage and transfer risk
through innovative facultative solutions and the most efficient
access to the global facultative markets
Capital Markets:
ď‚§ Global investment bank with expertise in M&A, capital raising,
strategic advice, restructuring, recapitalization services, and
insurance–linked securities
ď‚§ Works with insurers, reinsurers, investment firms, banks, and
corporations to manage complex commercial issues through the
provision of corporate finance advisory services, capital markets
solutions, and innovative risk management products
Place over
$30B
of bound premium
each year
#1
treaty and facultative
brokerage
23
consecutive
quarters of net new
business in core
treaty
Place over
$30B
of bound premium
each year
#1
treaty and facultative
brokerage
27
consecutive
quarters of net new
business in core
treaty
Q1'16 Q2'16 Q3'16 Q4'16 2016 Q1'17 Q2'17 Q3'17 Q4'17 2017
Total Revenue ($M) $667 $335 $234 $131 $1,367 $671 $345 $257 $153 $1,426
Organic Growth1 (%) 4% 6% 10% 20% 6%
1 Organic revenue is a non-GAAP measure that is reconciled to its corresponding U.S. GAAP measure for the above historical periods that have been
restated for the new revenue recognition accounting standard effective in the first quarter of 2018 in the schedule on page 22 of the fourth quarter 2017
press release.
20
Retirement Solutions
Retirement & Investment:
ď‚§ The Retirement & Investment practice is dedicated to navigating the risk and
opportunities associated with retirement and investing to optimize performance
and financial security for institutions and individuals
ď‚§ Retirement Consulting specializes in providing organizations across the globe
with strategic design consulting on their retirement programs, actuarial services,
and risk management – including pension de-risking, governance, integrated
pension administration and legal and compliance consulting
Talent, Rewards & Performance:
ď‚§ We deliver advice and solutions that help clients accelerate business outcomes
by improving the performance of their people
ď‚§ We support the full employee lifecycle from assessment and selection of the
right talent, optimized deployment and engagement to the design, alignment
and benchmarking of compensation to business strategy and performance
outcomes
Investment Consulting:
ď‚§ Provides public and private companies and other institutions with advice on
developing and maintaining investment programs across a broad range of plan
types, including defined benefit plans, defined contribution plans, endowments
and foundations
ď‚§ Our delegated investment solutions offer ongoing management of investment
programs and fiduciary responsibilities either in a partial or full discretionary
model for multiple asset owners. We partner with clients to deliver our scale
and experience to help them effectively manage their investments, risk,
governance and potentially lower costs
As a global leader
1000’s
of companies trust
Aon with their
retirement plans
More than
$4T
of pension assets
under independent
advisory
Approximately
$150B
of assets under
delegated
management
Q1'16 Q2'16 Q3'16 Q4'16 2016 Q1'17 Q2'17 Q3'17 Q4'17 2017
Total Revenue ($M) $396 $405 $465 $441 $1,707 $385 $388 $492 $489 $1,754
Organic Growth1 (%) 2% 1% 6% 4% 3%
1 Organic revenue is a non-GAAP measure that is reconciled to its corresponding U.S. GAAP measure for the above historical periods that have been
restated for the new revenue recognition accounting standard effective in the first quarter of 2018 in the schedule on page 22 of the fourth quarter 2017
press release.
21
Health Solutions
Health & Benefits Brokerage:
ď‚§ Partners with employers to develop innovative, customized
benefits strategies to help manage risk, drive engagement,
and promote accountability
Healthcare Exchanges:
ď‚§ Our private health exchange solutions help employers
transform how they sponsor, structure, and deliver health
benefits by building and operating a cost-effective
alternative to traditional employee and retiree healthcare by
seeking outcomes of reduced employer costs, risk and
volatility, alongside greater coverage and plan choices for
individual participants
Place over
$30B
of health premium
with a full set of
solutions
#1
provider of fully and
self-insured health
care exchanges
More than
90%
client satisfaction on
Aon’s health care
exchanges
Q1'16 Q2'16 Q3'16 Q4'16 2016 Q1'17 Q2'17 Q3'17 Q4'17 2017
Total Revenue ($M) $338 $253 $245 $522 $1,358 $428 $281 $277 $526 $1,512
Organic Growth1 (%) 15% 4% 4% 6% 7%
1 Organic revenue is a non-GAAP measure that is reconciled to its corresponding U.S. GAAP measure for the above historical periods that have been
restated for the new revenue recognition accounting standard effective in the first quarter of 2018 in the schedule on page 22 of the fourth quarter 2017
press release.
22
Data & Analytic Services
Affinity:
ď‚§ Specializes in developing, marketing and administering
customized insurance programs and specialty market
solutions for Affinity organizations and their members or
affiliates
Aon InPoint:
 Draws on Aon’s proprietary database (Global Risk Insight
Platform) and is dedicated to making insurers more
competitive through providing data, analytics, engagement
and consulting
ReView:
 Draws on Aon’s proprietary database and broker market
knowledge to provide advisory services analysis and
benchmarking to help reinsurers more effectively meet the
needs of cedents through the development of more
competitive, innovative and efficient risk transfer options
+200
associations and
organizations
benefit from Aon’s
Affinity solutions
Invest nearly
$400M
annually in data and
analytics
Global Risk Insight
Platform captures
$196B
in bound premium
Q1'16 Q2'16 Q3'16 Q4'16 2016 Q1'17 Q2'17 Q3'17 Q4'17 2017
Total Revenue ($M) $263 $271 $260 $256 $1,050 $273 $281 $287 $299 $1,140
Organic Growth1 (%) 6% 4% 2% 12% 5%
1 Organic revenue is a non-GAAP measure that is reconciled to its corresponding U.S. GAAP measure for the above historical periods that have been
restated for the new revenue recognition accounting standard effective in the first quarter of 2018 in the schedule on page 22 of the fourth quarter 2017
press release.
23
Appendix A: Q4 and Full Year Reconciliation of Non-GAAP Measures –
Organic Revenue and Free Cash Flow
24
Appendix B: Q4 and Full Year Reconciliation of Non-GAAP Measures –
Operating Margin and Diluted Earnings per Share
25
Appendix C: Pro Forma Financials Under New Accounting Standards
Effective 1/1/2018 (ASC 606 and ASU No. 2017-07)
26
Beginning in Q1 of 2018, Aon will adopt a new accounting standard that will shift the financial components of net periodic
pension cost and net periodic postretirement benefit cost from above the line in compensation and benefits expense to
below the line in other income / expense.
The historical impact of adopting ASU No. 2017-07 is shown below in the pro forma financials for 2016 and 2017.
Based on current assumptions, we believe that approximately $10 million per quarter is the right run-rate to
model for other income / expense in 2018, excluding all other items we do not forecast that could be favorable
or unfavorable in any given period.
Appendix D: Pro Forma Other Income/Expense Breakout Under New
Pension Accounting Standard Effective 1/1/2018 (ASU No. 2017-07)
(millions) Q1'16 Q2'16 Q3'16 Q4'16 2016 Q1'17 Q2'17 Q3'17 Q4'17 2017
Pension Income / (Expense) $11 $11 $12 $13 $47 $8 $9 $9 $16 $42
All Other $15 $4 $11 $13 $43 ($12) ($9) ($11) ($18) ($50)
Total Other Income / (Expense) – as Adjusted $26 $15 $23 $26 $90 ($4) $0 ($2) ($2) ($8)
Pension Settlements - ($62) - ($158) ($220) - - - ($128) ($128)
Total Other Income / (Expense) – GAAP $26 ($47) $23 ($132) ($130) ($4) $0 ($2) ($130) ($136)
27
Appendix E: Intangible Asset Amortization Schedule
28
Appendix F: Reconciliation of Return on Invested Capital (ROIC)
Return on Invested Capital (ROIC) is a non-GAAP measure calculated as adjusted net operating profit after tax (NOPAT) divided
by average invested capital (short-term debt, + long-term debt + total equity) and represents how well the Company is allocating its
capital to generate returns. The metric for the historical periods shown below was calculated using financial results for total
consolidated Aon and therefore includes discontinued operations in connection with the sale of certain outsourcing businesses
completed on May 1, 2017, which will not be included on a going forward basis.
FY'10 FY'11 FY'12 FY'13 FY'14 FY'15 FY'16 FY'17
Revenue 8,512 11,287 11,514 11,815 12,045 11,682 11,627 9,998
Consolidated operating income - as reported 1,244 1,596 1,596 1,671 1,966 1,848 1,906 979
Restructuring 172 113 101 174 - - - 497
Pension adjustment 49 - - - - - - -
Hewitt related costs 40 47 - - - - - -
Transactions/Project costs - 3 24 5 - - 15 -
Legacy receivable write-off - 18 - - - - - -
Anti-bribery and compliance initiative 9 - - - - - - 28
Legacy Litigation - - - - 35 176 - -
Pension settlement - - - - - - 220 128
Amortization of Intangible Assets 154 362 423 395 352 314 277 704
Total Adjustments 424 543 548 574 387 490 512 1,357
Consolidated operating income - as adjusted 1,668$ 2,139$ 2,144$ 2,245$ 2,353$ 2,338$ 2,418$ 2,336$
Adjusted Effective tax rate (%) 28.9% 27.3% 26.1% 25.4% 18.9% 15.8% 16.8% 14.9%
NOPAT (Adj. OI*(1-Adj. Tax Rate)) 1,186$ 1,555$ 1,584$ 1,675$ 1,908$ 1,969$ 2,012$ 1,988$
Short-term debt and current portion of long-term debt 492 337 114 703 783 562 336 299
Long-term debt 4,014 4,155 4,051 3,686 4,799 5,138 5,869 5,667
Total Debt 4,506 4,492 4,165 4,389 5,582 5,700 6,205 5,966
Total Equity 8,251 8,078 7,762 8,145 6,571 6,002 5,475 4,583
Non-controlling interest 55 42 43 50 60 57 57 65
End of Period Total Invested Capital 12,812 12,612 11,970 12,584 12,213 11,759 11,737 10,614
Average Total Invested Capital 10,126 12,712 12,291 12,277 12,399 11,986 11,748 11,176
ROIC (NOPAT/Average Total Invested Capital) 11.7% 12.2% 12.9% 13.6% 15.4% 16.4% 17.1% 17.8%
29
Appendix G: Reconciliation of Free Cash Flow Margin
Free Cash Flow Margin is a non-GAAP measure calculated as Free Cash Flow (defined as Cash Flow from Operations less
Capital Expenditures) / Total Revenue and represents the Company’s conversion rate of revenue into liquidity. The metric for the
historical periods shown below was calculated using financial results for total consolidated Aon and therefore includes discontinued
operations in connection with the sale certain outsourcing businesses (“the divested business”) completed on May 1, 2017, which
will not be included on a going forward basis.
FY'10 FY'11 FY'12 FY'13 FY'14 FY'15 FY'16 FY'17
Revenue - as reported 8,512 11,287 11,514 11,815 12,045 11,682 11,627 9,998
Cash Flow from Operations 876 1,112 1,534 1,753 1,812 2,009 2,326 669
Capital Expenditures (180) (241) (269) (229) (256) (290) (222) (183)
Free Cash Flow - as Reported 696 871 1,265 1,524 1,556 1,719 2,104 486
Adjustments:
2017 Restructuring initiatives 307
Transactions costs related to the divested business 45
Tax payments related to the divested business 940
Underlying Free Cash Flow - as Adjusted 1,778
Free Cash Flow Margin 8.2% 7.7% 11.0% 12.9% 12.9% 14.7% 18.1% 17.8%
Investor Relations
Scott Malchow
scott.malchow@aon.com
Erika Shouldice
erika.shouldice@aon.com
Office: 312-381-5957
Adam Klauss
adam.klauss@aon.com
Office: 312-381-1801

4 q17 presentation final

  • 1.
    Aon plc Fourth Quarterand Full Year 2017 Results February 2, 2018
  • 2.
    1 Greg Case Chief ExecutiveOfficer Christa Davies Chief Financial Officer
  • 3.
    2 Safe Harbor Statement Thiscommunication contain certain statements related to future results, or states our intentions, beliefs and expectations or predictions for the future which are forward-looking statements as that term is defined in the Private Securities Litigation Reform Act of 1995. Forward-looking statements relate to expectations or forecasts of future events. They use words such as "anticipate," "believe," "estimate," "expect," "forecast," "project," "intend," "plan," "probably," "potential," "looking forward" and other similar terms, and future or conditional tense verbs like "could," "may," "might," "should," "will" and "would." You can also identify forward-looking statements by the fact that they do not relate strictly to historical or current facts. For example, Aon plc (“Aon”) may use forward-looking statements when addressing topics such as: market and industry conditions, including competitive and pricing trends; changes in its business strategies and methods of generating revenue; the development and performance of its services and products; changes in the composition or level of its revenues; its cost structure and the outcome of cost-saving or restructuring initiatives; the outcome of contingencies; dividend policy; the expected impact of acquisitions and dispositions; pension obligations; cash flow and liquidity; expected effective tax rate; future actions by regulators; and the impact of changes in accounting rules. These forward-looking statements are subject to certain risks and uncertainties that could cause actual results to differ materially from either historical or anticipated results depending on a variety of factors. The following factors, among others, could cause actual results to differ from those set forth in the forward looking statements: general economic and political conditions in different countries in which Aon does business around the world; changes in the competitive environment; fluctuations in exchange and interest rates that could influence revenue and expense; changes in global equity and fixed income markets that could affect the return on invested assets; changes in the funding status of Aon's various defined benefit pension plans and the impact of any increased pension funding resulting from those changes; the level of Aon’s debt limiting financial flexibility; rating agency actions that could affect Aon's ability to borrow funds; the effect of the change in global headquarters and jurisdiction of incorporation, including differences in the anticipated benefits; changes in estimates or assumptions on our financial statements; limits on Aon’s subsidiaries to make dividend and other payments to Aon; the impact of lawsuits and other contingent liabilities and loss contingencies arising from errors and omissions and other claims against Aon; the impact of, and potential challenges in complying with, legislation and regulation in the jurisdictions in which Aon operates, particularly given the global scope of Aon’s businesses and the possibility of conflicting regulatory requirements across jurisdictions in which Aon does business; the impact of any investigations brought by regulatory authorities in the U.S., U.K. and other countries; the impact of any inquiries relating to compliance with the U.S. Foreign Corrupt Practices Act and non-U.S. anti-corruption laws and with U.S. and non-U.S. trade sanctions regimes; failure to protect intellectual property rights or allegations that we infringe on the intellectual property rights of others; the effects of English law on our operating flexibility and the enforcement of judgments against Aon; the failure to retain and attract qualified personnel; international risks associated with Aon’s global operations; the effect or natural or man-made disasters; the potential of a system or network breach or disruption resulting in operational interruption or improper disclosure of personal data; Aon’s ability to develop and implement new technology; the damage to our reputation among clients, markets or third parties; the actions taken by third parties that preform aspects of our business operations and client services; the extent to which Aon manages certain risks created in connection with the various services, including fiduciary and investments and other advisory services and business process outsourcing services, among others, that Aon currently provides, or will provide in the future, to clients; Aon’s ability to grow, develop and integrate companies that it acquires or new lines of business; changes in commercial property and casualty markets, commercial premium rates or methods of compensation; changes in the health care system or our relationships with insurance carriers; Aon’s ability to implement initiatives intended to yield cost savings, and the ability to achieve those cost savings; risks and uncertainties in connection with the sale of our benefits administration and business process outsourcing business; and our ability to realize the expected benefits from our restructuring plan. Any or all of Aon’s forward-looking statements may turn out to be inaccurate, and there are no guarantees about Aon’s performance. The factors identified above are not exhaustive. Aon and its subsidiaries operate in a dynamic business environment in which new risks may emerge frequently. Further information concerning Aon and its businesses, including factors that potentially could materially affect Aon's financial results, is contained in Aon's filings with the SEC. See Aon’s Annual Report on Form 10-K for the year ended December 31, 2016 and its Quarterly Reports on Form 10-Q for the quarters ended March 31,2017, June 30, 2017, and September 30, 2017 for a further discussion of these and other risks and uncertainties applicable to Aon’s businesses. These factors may be revised or supplemented in subsequent reports. Aon is under no obligation, and expressly disclaims any obligation, to update or alter any forward-looking statement that it may make from time to time, whether as a result of new information, future events or otherwise. Explanation of Non-GAAP Measures This communication includes supplemental information related to organic revenue, free cash flow, adjusted operating margin, adjusted earnings per share, and adjusted effective tax rate that exclude the effects of intangible asset amortization, capital expenditures, transaction costs and certain other noteworthy items that affected results for the comparable periods. Organic revenue excludes from reported revenues the impact of foreign exchange, acquisitions, divestitures, transfers between business units, reimbursable expenses and unusual items. The impact of foreign exchange is determined by translating last year's revenue, expense or net income at this year's foreign exchange rates. Free cash flow is cash flow from operating activity less capital expenditures. The effective tax rate, as adjusted, excludes the applicable tax impact associated with expenses for legacy litigation. Reconciliations of non-GAAP measures to their most directly comparable GAAP measures are provided in the attached appendices. Supplemental organic revenue information and additional measures that exclude the effects of the restructuring charges and certain other items do not affect net income or any other GAAP reported amounts. Management believes that these non-GAAP measures are important to make meaningful period-to-period comparisons and that this supplemental information is helpful to investors. Non-GAAP measures should be viewed in addition to, not in lieu of, the Company’s Consolidated Financial Statements. Industry peers provide similar supplemental information regarding their performance, although they may not make identical adjustments.
  • 4.
    3 Accelerating a ProvenStrategy to Unite Firm and Improve Growth Profile  Aon is a leading global professional services firm providing Risk, Retirement and Health solutions o Using proprietary data and analytics to empower results for clients by reducing volatility and improving operating performance  Divestiture of outsourcing businesses represents natural acceleration of a proven strategy o Consistent with journey towards offering advice and solutions; further aligns the portfolio around clients’ highest priorities o Provided approximately $3 billion of incremental capital to accelerate investment in emerging client needs o Reinforces return on invested capital (ROIC) decision-making process and emphasis on free cash flow  Accelerating organic revenue1 growth driven by investment in high- growth, high-margin areas of our portfolio o Organic revenue growth of +4% in 2017 and in 2016 versus +3% in 2015 and 2014  Uniting the firm to address client needs, drive social impact and maximize shareholder value o One operating model to deliver additional insight, connectivity and efficiency o One portfolio of capabilities enabled by insights from proprietary data and analytics 3% 3% 4% 4% 2014 2015 2016 2017 Organic Revenue Growth 1 Reflects performance from continuing operations. Organic revenue is a non-GAAP measure. A reconciliation of organic revenue to revenue, the corresponding U.S. GAAP measure, can be found in Appendix A of this presentation
  • 5.
    4 Q4 and FY2017 – Key Metrics
  • 6.
    5 Key Metrics1 –Strong Finish to the Year with Momentum into 2018 1 Reflects performance from continuing operations. The results presented on this page are non-GAAP measures that are reconciled to their corresponding U.S. GAAP measures in the Appendices of this presentation. Q4’16 Q4’17 Organic Revenue +5% +6% Operating Margin 25.5% 27.5% Year-over-Year +200 bps Earnings Per Share $2.00 $2.35 Year-over-Year +18% Q4 Organic Revenue Growth:  Highlighted by strong growth in Data and Analytic Services and Reinsurance Q4 Operating Margin:  Primarily driven by strong organic revenue growth and core operational improvement from return on investments and increased operating leverage, as well as savings from restructuring initiatives  Includes -10 basis points of transaction related costs from recent acquisitions Q4 Earnings Per Share:  Double-digit earnings growth primarily driven by strong operational improvement and effective capital management, partially offset by a higher effective tax rate and a loss on the disposal of certain businesses  Includes a +$0.06 favorable impact for FX translation, offset by a -$0.06 loss in other expense  Repurchased 3.5 million shares for approximately $500 million 2017 Free Cash Flow:  Cash flow from operations decreased approximately $1.2 billion primarily driven by cash tax payments of an estimated $940 million associated with the divested business, $280 million of cash restructuring charges and $45 million of transaction costs related to the divestiture, partially offset by operational improvement  Free cash flow reflects a decline in cash flow from operations and a $27 million increase in capital expenditures, including investments in our operating model 2016 2017 Organic Revenue +4% +4% Operating Margin 21.6% 23.4% Year-over-Year +180bps Earnings Per Share $5.58 $6.52 Year-over-Year +17% Free Cash Flow $1,673M $486M Year-over-Year -71%
  • 7.
    6 Q4 and FY2017 – Growth and Investment
  • 8.
    7 Organic Revenue1 –Strong Growth Across all Revenue Lines 1 Reflects performance from continuing operations. Organic revenue is a non-GAAP measure that is reconciled to revenue, its corresponding U.S. GAAP measure, in Appendix A of this presentation.  Commercial Risk Solutions: Strong growth in U.S. retail and solid growth internationally led by the Asia and Pacific regions, as well as new client wins in the captive management business  Reinsurance Solutions: Strong growth across every major product line, highlighted by particular strength in treaty placements reflecting record net new business generation, and growth in both facultative placements and capital markets transactions  Retirement Solutions: Growth across every major business and geography, with particular strength in the talent practice for compensation surveys and assessment services and in investment consulting, primarily for delegated investment management  Health Solutions: Strong growth globally in health & benefits brokerage, reflecting continued strength in both the U.S. and internationally, partially offset by a decline in project related work in the healthcare exchange business  Data & Analytic Services: Continued strength across U.S. Affinity, as well as an increase in claims activity in the Flood business following certain catastrophe events earlier in the year Q4’16 Q4’17 Commercial Risk Solutions +0% +5% Reinsurance Solutions +1% +8% Retirement Solutions -2% +4% Health Solutions +30% +6% Data & Analytic Services +4% +12% Total Aon +5% +6% 2016 2017 Commercial Risk Solutions +2% +2% Reinsurance Solutions +1% +6% Retirement Solutions +2% +3% Health Solutions +13% +7% Data & Analytic Services +6% +6% Total Aon +4% +4%
  • 9.
    8 Strategically Investing inHigh-Growth, High-Margin Areas of Client Need ď‚§ Clients continue to navigate an increasingly volatile world with 2017 being the costliest year on record for weather related disasters at an estimated $344 billion of economic losses ď‚§ Weather related disasters, combined with economic, demographic, geopolitical forces and the exponential pace of technology change, are all converging to create a challenging new reality for businesses ď‚§ Aon has a strong track record of developing innovative, first- to-market solutions to help solve problems and create differentiated value in response to specific client needs ď‚§ Strategically investing organically and through M&A in the highest growth, highest margin businesses across our portfolio, or in attractive geographies, driven by a ROIC decision-making process; including: o Data & analytics o Cyber o Health and elective benefits brokerage o Healthcare exchanges o Delegated investment management ď‚§ Positioning the firm for long-term growth and improved operating leverage
  • 10.
    9 Q4 and FY2017 – Financial Summary
  • 11.
    10 $5.58 $6.52 2016 2017 EPS1 –Double-Digit Earnings Growth for the Quarter and Full Year 1 EPS from continuing operations and EPS attributable to Aon shareholders are non-GAAP measures that are reconciled to their corresponding U.S. GAAP measures in Appendix B of this presentation. $2.00 $2.35 Q4 2016 Q4 2017  Double-digit earnings growth primarily driven by strong organic revenue growth, significant operational improvement and effective capital management, partially offset by a higher effective tax rate and a loss on the disposal of certain businesses  Includes a $0.06 favorable impact from foreign currency translation  Includes a $0.06 loss in other expense from the sale of a certain business and losses on the remeasurement of assets and liabilities in non-functional currencies  Repurchased 3.5 million ordinary shares for approximately $500 million in the fourth quarter Q4 EPS from Continuing Operations 2017 EPS from Continuing Operations
  • 12.
    11 Operating Margin1 –Driving Core Improvement in Addition to Savings 25.5% 21.6% 27.5% 23.4% Q4 Full Year $676 $2,030 $799 $2,336 Q4 Full Year 1 Reflects performance from continuing operations. Operating income and operating margin are non-GAAP measures that are reconciled to their corresponding U.S. GAAP measures in Appendix B of this presentation. Operating Income ($ millions) Operating Margin (%)  Operating income increased $123 million compared to the prior year quarter  Core improvement drove $67 million, or more than half of the dollar increase, reflecting return on investments and increased operating leverage  Includes $56 million, or +190 basis points, of savings related to restructuring and other operational improvement initiatives, before any reinvestment  Includes $3 million, or -10 basis points, of transaction related costs  FX translation had an immaterial impact on operating margin in the quarter  For the full year, operating income increased +15% and operating margin improved +180 basis points from the prior year  A strong performance operationally in the first year of execution against our multi-year investment in the firm2016 2017
  • 13.
    12 Investing in OneOperating Model  Creating a next generation global business services model that allows for better scalability, flexibility and enhanced colleague and client experience  Driving one operating model across the firm to create additional operating leverage and deliver additional insight, connection and efficiency: o Information Technology – create greater insight from data center optimization, application management and strategic vendor consolidation o Real Estate – create greater connection through real estate portfolio optimization o People – create efficient scalability of operations and activity, including the use of centers of excellence and third-party providers  After evaluating the current progress of the restructuring program and identifying further opportunities to improve our operating model, the restructuring program estimates have been updated to reflect a $50 million increase in total expected savings  Expect to invest an estimated $1,175 million in total cash1 of the $3 billion total outsourcing divestiture proceeds over a three year period (2017-2019) o $975 million of cash charges1; with $497 million of expense incurred and $280 million of cash spent to date. Future cash outlay is expected to increase modestly in 2018 and decline each year there after o $200 million of incremental capital expenditure investment; with $27 million incurred in 2017, and approximately $100 million expected in 2018 and $70 million expected in 2019  Expect to deliver $450 million of estimated savings in 2019, before any potential reinvestment o $165 million in 2017, $300 million in 2018, and $450 million in 2019 1 Excludes $50 million of non-cash charges included in asset impairments.
  • 14.
    13 Incurred 48% ofProgram Charges with 63% of Savings Left to Achieve ($ millions) Q4’17 Total Since Inception Total Program1 % of Plan Completed Workforce Reduction $42 $299 $450 66% IT Rationalization $11 $33 $130 25% Lease Consolidation $0 $8 $85 9% Asset Impairments $0 $26 $50 52% Other Associated Costs $43 $131 $310 42% Total Restructuring Charges2 $96 $497 $1,025 48% Capital Expenditures $200 Total Savings $56 $165 $450 37%  We incurred $96 million of restructuring related charges in the fourth quarter and a total of $497 million charges in 2017, primarily relating to workforce reduction and other general initiatives, representing 48% of the total program estimate  The cash impact in 2017 is an outflow of $280 million  We recognized $56 million of savings in the fourth quarter and a total of $165 million in 2017, before any reinvestment, representing 37% of expected total savings 1 Represents management’s estimates as of February 1, 2018, which are subject to change if and when underlying factors may change. 2 Includes $50 million of non-cash charges included in asset impairments and lease consolidations. Total cash charges are estimated at $1,175 million, including capital expenditures.
  • 15.
    14 Non-Operating Segment Financials Interest Income increased $4 million due to additional income earned on the remaining balance of proceeds from the sale of the outsourcing business  Other Expense of $19 million primarily includes a loss on the sale of certain businesses and a loss on the unfavorable impact of exchange rates on the re- measurement of assets and liabilities in non-functional currencies  Adjusted effective tax rate in both periods benefitted from a net favorable impact of certain discrete items  Actual common shares outstanding on December 31st were 247.6 million, and there were approximately 4.5 million additional dilutive equivalents. The Company repurchased 3.5 million ordinary shares for approximately $500 million in the fourth quarter. Estimated Q1’18 beginning dilutive share count is ~252 million subject to share price movement, share issuance and share repurchase ($ millions) Q4’16 Q4’17 Interest Income $3 $7 Interest Expense ($70) ($71) Other (Expense) Income $9 ($19) Effective Tax Rate1 12.0% 15.5% Non-Controlling Interest ($7) ($7) Actual Common Shares Outstanding at 12-31-17 n/a 247.6 1 Represents the non-GAAP effective tax rate. See Appendices of this presentation for a reconciliation of non-GAAP numbers.
  • 16.
    15 Balance Sheet ($ millions) Sep30 2017 Dec 31 2017 Cash $749 $756 Short-term Investments $1,640 $529 Total Debt $5,967 $5,966 Shareholders’ Equity $5,175 $4,583 Debt to EBITDA3 3.3x 3.2x $669 2016 2017 $1,829 Strong Balance Sheet and Financial Flexibility Supporting Investments 1 Reflects performance from continuing operations. 2 Reflects performance from continuing operations. Free cash flow is non-GAAP measure that is reconciled to its corresponding U.S. GAAP measure in Appendix A of this presentation. 3 Debt to EBITDA is calculated based on U.S. GAAP EBITDA for continuing operations.  Cash flow from operations decreased approximately $1.2 billion driven primarily by an estimated $940 million of cash tax payments associated with the divested business, $280 million of cash restructuring charges and $45 million of transaction costs related to the divestiture, partially offset by operational improvement  Free cash flow decreased approximately $1.2 billion, reflecting a decline in cash flow from operations and an $27 million increase in capital expenditures, including investments in our operating model  Excluding the tax payments and transaction costs associated with the divestiture, as well as the investments in restructuring activities resulting from the divestiture, underlying free cash flow growth was 6% for the full year 2017  We expect Debt to EBITDA to return to the 2 - 2.5x range on a U.S. GAAP-basis by year-end 2018 driven by operating improvement $486 2016 2017 $1,673 Free Cash Flow2 ($ millions) Cash Flow from Operations1 ($ millions)
  • 17.
    16 11.7% 17.8% 2010 2011 20122013 2014 2015 2016 2017 Positioned for Substantial Free Cash Flow Generation Over Long-Term 1 Return on Invested Capital (ROIC) is a non-GAAP measure calculated as adjusted net operating profit after tax (NOPAT) divided by average invested capital (short-term debt, + long- term debt + total equity) and represents how well the Company is allocating its capital to generate returns. The metric for the historical periods 2010-2016 shown above was calculated using financial results for total consolidated Aon, and therefore includes discontinued operations in connection with the sale certain outsourcing businesses completed on May 1, 2017, which will not be included on a going forward basis. A reconciliation can be found in Appendix F. 2 Free Cash Flow Margin is a non-GAAP measure calculated as Free Cash Flow (defined as Cash Flow from Operations less Capital Expenditures) / Total Revenue and represents the Company’s conversion rate of revenue into liquidity. The metric for the historical periods 2010-2016 shown above was calculated using financial results for total consolidated Aon and therefore includes discontinued operations in connection with the sale certain outsourcing businesses completed on May 1, 2017, which will not be included on a going forward basis. A reconciliation can be found in Appendix G. Return on Invested Capital1 (%)  Disciplined capital management approach to maximize return on invested capital o Increased ROIC, up +610 basis points to 17.8% in 2017  Taken significant steps to maximize the translation of a dollar of revenue into the highest amount of free cash flow o Increased free cash flow margin +960 basis points to 17.8% on an underlying basis in 2017  Looking forward, we expect two main drivers to contribute to free cash flow generation going forward: o Operational improvement as the firm continues to deliver accelerated organic growth, increase operating leverage and improve return on invested capital o Working capital improvements as the firm focuses on closing the gap between receivables and payables  In the near-term, we expect to exceed $7.97 earnings per share in 2018  Over the long-term, we expect to deliver continued double-digit compounded annual growth in free cash flow Free Cash Flow Margin2 (%) 8.2% 17.8% 2010 2011 2012 2013 2014 2015 2016 2017
  • 18.
  • 19.
    18 Commercial Risk Solutions Q1'16Q2'16 Q3'16 Q4'16 2016 Q1'17 Q2'17 Q3'17 Q4'17 2017 Total Revenue ($M) $969 $990 $884 $1,088 $3,931 $989 $1,041 $915 $1,218 $4,163 Organic Growth1 (%) 2% 2% (1%) 5% 2% Place over $60B of bound premium each year #1 primary insurance brokerage Retention rates +90% on average in Retail Brokerage Retail Brokerage:  Our dedicated teams of risk experts utilize the industry’s most comprehensive data and analytics capabilities to provide clients with distinctive risk advice that empowers results for their organizations  Through our specialty-focused organizational structure, colleagues in 120 countries around the world dive deep into their areas of expertise to develop unparalleled insights around industry verticals and lines of business to best deliver value to clients in today’s complex and integrated risk environment Global Risk Consulting:  World leading provider of risk consulting services supporting clients in better understanding and managing their risk profile through identifying and quantifying the risks they face by assisting them with the selection and implementation of the appropriate risk transfer, risk retention, and risk mitigation solutions, and by ensuring the continuity of their operations through claims consulting Cyber Solutions:  One of the industry’s premier resources in cyber risk management; our strategic focus extends to identifying and protecting critical digital assets supported by best-in-class transactional capabilities, enhanced coverage expertise, deep carrier relationships, and incident response expertise Captives:  Leading global captive insurance solutions provider; managing +1,100 insurance entities worldwide including captives, protected segregated and incorporated cell facilities, as well as entities that support Insurance Linked Securities and specialist insurance and reinsurance companies 1 Organic revenue is a non-GAAP measure that is reconciled to its corresponding U.S. GAAP measure for the above historical periods that have been restated for the new revenue recognition accounting standard effective in the first quarter of 2018 in the schedule on page 22 of the fourth quarter 2017 press release.
  • 20.
    19 Reinsurance Solutions Treaty:  Addressesunderwriting and capital objectives on a portfolio level, allowing our clients to more effectively manage the combination of premium growth, return on capital and rating agency interests. This includes the development of more competitive, innovative and efficient risk transfer options. Facultative:  Empowers clients to better understand, manage and transfer risk through innovative facultative solutions and the most efficient access to the global facultative markets Capital Markets:  Global investment bank with expertise in M&A, capital raising, strategic advice, restructuring, recapitalization services, and insurance–linked securities  Works with insurers, reinsurers, investment firms, banks, and corporations to manage complex commercial issues through the provision of corporate finance advisory services, capital markets solutions, and innovative risk management products Place over $30B of bound premium each year #1 treaty and facultative brokerage 23 consecutive quarters of net new business in core treaty Place over $30B of bound premium each year #1 treaty and facultative brokerage 27 consecutive quarters of net new business in core treaty Q1'16 Q2'16 Q3'16 Q4'16 2016 Q1'17 Q2'17 Q3'17 Q4'17 2017 Total Revenue ($M) $667 $335 $234 $131 $1,367 $671 $345 $257 $153 $1,426 Organic Growth1 (%) 4% 6% 10% 20% 6% 1 Organic revenue is a non-GAAP measure that is reconciled to its corresponding U.S. GAAP measure for the above historical periods that have been restated for the new revenue recognition accounting standard effective in the first quarter of 2018 in the schedule on page 22 of the fourth quarter 2017 press release.
  • 21.
    20 Retirement Solutions Retirement &Investment:  The Retirement & Investment practice is dedicated to navigating the risk and opportunities associated with retirement and investing to optimize performance and financial security for institutions and individuals  Retirement Consulting specializes in providing organizations across the globe with strategic design consulting on their retirement programs, actuarial services, and risk management – including pension de-risking, governance, integrated pension administration and legal and compliance consulting Talent, Rewards & Performance:  We deliver advice and solutions that help clients accelerate business outcomes by improving the performance of their people  We support the full employee lifecycle from assessment and selection of the right talent, optimized deployment and engagement to the design, alignment and benchmarking of compensation to business strategy and performance outcomes Investment Consulting:  Provides public and private companies and other institutions with advice on developing and maintaining investment programs across a broad range of plan types, including defined benefit plans, defined contribution plans, endowments and foundations  Our delegated investment solutions offer ongoing management of investment programs and fiduciary responsibilities either in a partial or full discretionary model for multiple asset owners. We partner with clients to deliver our scale and experience to help them effectively manage their investments, risk, governance and potentially lower costs As a global leader 1000’s of companies trust Aon with their retirement plans More than $4T of pension assets under independent advisory Approximately $150B of assets under delegated management Q1'16 Q2'16 Q3'16 Q4'16 2016 Q1'17 Q2'17 Q3'17 Q4'17 2017 Total Revenue ($M) $396 $405 $465 $441 $1,707 $385 $388 $492 $489 $1,754 Organic Growth1 (%) 2% 1% 6% 4% 3% 1 Organic revenue is a non-GAAP measure that is reconciled to its corresponding U.S. GAAP measure for the above historical periods that have been restated for the new revenue recognition accounting standard effective in the first quarter of 2018 in the schedule on page 22 of the fourth quarter 2017 press release.
  • 22.
    21 Health Solutions Health &Benefits Brokerage:  Partners with employers to develop innovative, customized benefits strategies to help manage risk, drive engagement, and promote accountability Healthcare Exchanges:  Our private health exchange solutions help employers transform how they sponsor, structure, and deliver health benefits by building and operating a cost-effective alternative to traditional employee and retiree healthcare by seeking outcomes of reduced employer costs, risk and volatility, alongside greater coverage and plan choices for individual participants Place over $30B of health premium with a full set of solutions #1 provider of fully and self-insured health care exchanges More than 90% client satisfaction on Aon’s health care exchanges Q1'16 Q2'16 Q3'16 Q4'16 2016 Q1'17 Q2'17 Q3'17 Q4'17 2017 Total Revenue ($M) $338 $253 $245 $522 $1,358 $428 $281 $277 $526 $1,512 Organic Growth1 (%) 15% 4% 4% 6% 7% 1 Organic revenue is a non-GAAP measure that is reconciled to its corresponding U.S. GAAP measure for the above historical periods that have been restated for the new revenue recognition accounting standard effective in the first quarter of 2018 in the schedule on page 22 of the fourth quarter 2017 press release.
  • 23.
    22 Data & AnalyticServices Affinity:  Specializes in developing, marketing and administering customized insurance programs and specialty market solutions for Affinity organizations and their members or affiliates Aon InPoint:  Draws on Aon’s proprietary database (Global Risk Insight Platform) and is dedicated to making insurers more competitive through providing data, analytics, engagement and consulting ReView:  Draws on Aon’s proprietary database and broker market knowledge to provide advisory services analysis and benchmarking to help reinsurers more effectively meet the needs of cedents through the development of more competitive, innovative and efficient risk transfer options +200 associations and organizations benefit from Aon’s Affinity solutions Invest nearly $400M annually in data and analytics Global Risk Insight Platform captures $196B in bound premium Q1'16 Q2'16 Q3'16 Q4'16 2016 Q1'17 Q2'17 Q3'17 Q4'17 2017 Total Revenue ($M) $263 $271 $260 $256 $1,050 $273 $281 $287 $299 $1,140 Organic Growth1 (%) 6% 4% 2% 12% 5% 1 Organic revenue is a non-GAAP measure that is reconciled to its corresponding U.S. GAAP measure for the above historical periods that have been restated for the new revenue recognition accounting standard effective in the first quarter of 2018 in the schedule on page 22 of the fourth quarter 2017 press release.
  • 24.
    23 Appendix A: Q4and Full Year Reconciliation of Non-GAAP Measures – Organic Revenue and Free Cash Flow
  • 25.
    24 Appendix B: Q4and Full Year Reconciliation of Non-GAAP Measures – Operating Margin and Diluted Earnings per Share
  • 26.
    25 Appendix C: ProForma Financials Under New Accounting Standards Effective 1/1/2018 (ASC 606 and ASU No. 2017-07)
  • 27.
    26 Beginning in Q1of 2018, Aon will adopt a new accounting standard that will shift the financial components of net periodic pension cost and net periodic postretirement benefit cost from above the line in compensation and benefits expense to below the line in other income / expense. The historical impact of adopting ASU No. 2017-07 is shown below in the pro forma financials for 2016 and 2017. Based on current assumptions, we believe that approximately $10 million per quarter is the right run-rate to model for other income / expense in 2018, excluding all other items we do not forecast that could be favorable or unfavorable in any given period. Appendix D: Pro Forma Other Income/Expense Breakout Under New Pension Accounting Standard Effective 1/1/2018 (ASU No. 2017-07) (millions) Q1'16 Q2'16 Q3'16 Q4'16 2016 Q1'17 Q2'17 Q3'17 Q4'17 2017 Pension Income / (Expense) $11 $11 $12 $13 $47 $8 $9 $9 $16 $42 All Other $15 $4 $11 $13 $43 ($12) ($9) ($11) ($18) ($50) Total Other Income / (Expense) – as Adjusted $26 $15 $23 $26 $90 ($4) $0 ($2) ($2) ($8) Pension Settlements - ($62) - ($158) ($220) - - - ($128) ($128) Total Other Income / (Expense) – GAAP $26 ($47) $23 ($132) ($130) ($4) $0 ($2) ($130) ($136)
  • 28.
    27 Appendix E: IntangibleAsset Amortization Schedule
  • 29.
    28 Appendix F: Reconciliationof Return on Invested Capital (ROIC) Return on Invested Capital (ROIC) is a non-GAAP measure calculated as adjusted net operating profit after tax (NOPAT) divided by average invested capital (short-term debt, + long-term debt + total equity) and represents how well the Company is allocating its capital to generate returns. The metric for the historical periods shown below was calculated using financial results for total consolidated Aon and therefore includes discontinued operations in connection with the sale of certain outsourcing businesses completed on May 1, 2017, which will not be included on a going forward basis. FY'10 FY'11 FY'12 FY'13 FY'14 FY'15 FY'16 FY'17 Revenue 8,512 11,287 11,514 11,815 12,045 11,682 11,627 9,998 Consolidated operating income - as reported 1,244 1,596 1,596 1,671 1,966 1,848 1,906 979 Restructuring 172 113 101 174 - - - 497 Pension adjustment 49 - - - - - - - Hewitt related costs 40 47 - - - - - - Transactions/Project costs - 3 24 5 - - 15 - Legacy receivable write-off - 18 - - - - - - Anti-bribery and compliance initiative 9 - - - - - - 28 Legacy Litigation - - - - 35 176 - - Pension settlement - - - - - - 220 128 Amortization of Intangible Assets 154 362 423 395 352 314 277 704 Total Adjustments 424 543 548 574 387 490 512 1,357 Consolidated operating income - as adjusted 1,668$ 2,139$ 2,144$ 2,245$ 2,353$ 2,338$ 2,418$ 2,336$ Adjusted Effective tax rate (%) 28.9% 27.3% 26.1% 25.4% 18.9% 15.8% 16.8% 14.9% NOPAT (Adj. OI*(1-Adj. Tax Rate)) 1,186$ 1,555$ 1,584$ 1,675$ 1,908$ 1,969$ 2,012$ 1,988$ Short-term debt and current portion of long-term debt 492 337 114 703 783 562 336 299 Long-term debt 4,014 4,155 4,051 3,686 4,799 5,138 5,869 5,667 Total Debt 4,506 4,492 4,165 4,389 5,582 5,700 6,205 5,966 Total Equity 8,251 8,078 7,762 8,145 6,571 6,002 5,475 4,583 Non-controlling interest 55 42 43 50 60 57 57 65 End of Period Total Invested Capital 12,812 12,612 11,970 12,584 12,213 11,759 11,737 10,614 Average Total Invested Capital 10,126 12,712 12,291 12,277 12,399 11,986 11,748 11,176 ROIC (NOPAT/Average Total Invested Capital) 11.7% 12.2% 12.9% 13.6% 15.4% 16.4% 17.1% 17.8%
  • 30.
    29 Appendix G: Reconciliationof Free Cash Flow Margin Free Cash Flow Margin is a non-GAAP measure calculated as Free Cash Flow (defined as Cash Flow from Operations less Capital Expenditures) / Total Revenue and represents the Company’s conversion rate of revenue into liquidity. The metric for the historical periods shown below was calculated using financial results for total consolidated Aon and therefore includes discontinued operations in connection with the sale certain outsourcing businesses (“the divested business”) completed on May 1, 2017, which will not be included on a going forward basis. FY'10 FY'11 FY'12 FY'13 FY'14 FY'15 FY'16 FY'17 Revenue - as reported 8,512 11,287 11,514 11,815 12,045 11,682 11,627 9,998 Cash Flow from Operations 876 1,112 1,534 1,753 1,812 2,009 2,326 669 Capital Expenditures (180) (241) (269) (229) (256) (290) (222) (183) Free Cash Flow - as Reported 696 871 1,265 1,524 1,556 1,719 2,104 486 Adjustments: 2017 Restructuring initiatives 307 Transactions costs related to the divested business 45 Tax payments related to the divested business 940 Underlying Free Cash Flow - as Adjusted 1,778 Free Cash Flow Margin 8.2% 7.7% 11.0% 12.9% 12.9% 14.7% 18.1% 17.8%
  • 31.
    Investor Relations Scott Malchow scott.malchow@aon.com ErikaShouldice erika.shouldice@aon.com Office: 312-381-5957 Adam Klauss adam.klauss@aon.com Office: 312-381-1801