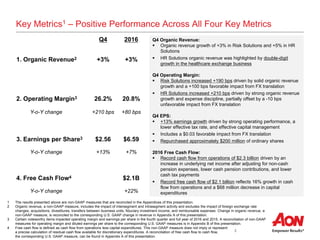
Aon plc reported strong financial results for the fourth quarter and full year of 2016. Some key highlights include:
- Organic revenue growth of 3% in both segments for the fourth quarter driven by growth across regions and businesses.
- Record operating margins of 26.2% for Risk Solutions and 20.8% for HR Solutions in the fourth quarter due to organic revenue growth and expense discipline.
- Double digit earnings growth of 13% for the fourth quarter and 7% for the full year 2016 driven by strong operating performance and capital management initiatives.
- Record free cash flow of $2.1 billion for 2016, a 22% increase over 2015, demonstrating effective cash generation.
3. 2
Safe Harbor Statement
This communication contain certain statements related to future results, or states our intentions, beliefs and expectations or predictions for the future which are forward-looking
statements as that term is defined in the Private Securities Litigation Reform Act of 1995. Forward-looking statements relate to expectations or forecasts of future events. They use
words such as "anticipate," "believe," "estimate," "expect," "forecast," "project," "intend," "plan," "probably," "potential," "looking forward" and other similar terms, and future or
conditional tense verbs like "could," "may," "might," "should," "will" and "would." You can also identify forward-looking statements by the fact that they do not relate strictly to historical or
current facts. For example, we may use forward-looking statements when addressing topics such as: market and industry conditions, including competitive and pricing trends; changes
in our business strategies and methods of generating revenue; the development and performance of our services and products; changes in the composition or level of our revenues; our
cost structure and the outcome of cost-saving or restructuring initiatives; the outcome of contingencies; dividend policy; the expected impact of acquisitions and dispositions; pension
obligations; cash flow and liquidity; expected effective tax rate; future actions by regulators; and the impact of changes in accounting rules. These forward-looking statements are
subject to certain risks and uncertainties that could cause actual results to differ materially from either historical or anticipated results depending on a variety of factors.
The following factors, among others, could cause actual results to differ from those set forth in the forward looking statements: general economic and political conditions in different
countries in which Aon does business around the world; changes in the competitive environment; fluctuations in exchange and interest rates that could influence revenue and expense;
changes in global equity and fixed income markets that could affect the return on invested assets; changes in the funding status of Aon's various defined benefit pension plans and the
impact of any increased pension funding resulting from those changes; the level of Aon’s debt limiting financial flexibility; rating agency actions that could affect Aon's ability to borrow
funds; the effect of the change in global headquarters and jurisdiction of incorporation, including differences in the anticipated benefits; changes in estimates or assumptions on our
financial statements; limits on Aon’s subsidiaries to make dividend and other payments to Aon; the impact of lawsuits and other contingent liabilities and loss contingencies arising from
errors and omissions and other claims against Aon; the impact of, and potential challenges in complying with, legislation and regulation in the jurisdictions in which Aon operates,
particularly given the global scope of Aon’s businesses and the possibility of conflicting regulatory requirements across jurisdictions in which Aon does business; the impact of any
investigations brought by regulatory authorities in the U.S., U.K. and other countries; the impact of any inquiries relating to compliance with the U.S. Foreign Corrupt Practices Act and
non-U.S. anti-corruption laws and with U.S. and non-U.S. trade sanctions regimes; failure to protect intellectual property rights or allegations that we infringe on the intellectual property
rights of others; the effects of English law on our operating flexibility and the enforcement of judgments against Aon; the failure to retain and attract qualified personnel; international
risks associated with Aon’s global operations; the effect or natural or man-made disasters; the potential of a system or network breach or disruption resulting in operational interruption
or improper disclosure of personal data; Aon’s ability to develop and implement new technology; the damage to our reputation among clients, markets or third parties; the actions taken
by third parties that preform aspects of our business operations and client services; the extent to which Aon manages certain risks created in connection with the various services,
including fiduciary and investments and other advisory services and business process outsourcing services, among others, that Aon currently provides, or will provide in the future, to
clients; Aon’s ability to grow, develop and integrate companies that it acquires or new lines of business; changes in commercial property and casualty markets, commercial premium
rates or methods of compensation; changes in the health care system or our relationships with insurance carriers; and Aon’s ability to implement initiatives intended to yield cost
savings, and the ability to achieve those cost savings.
Any or all of Aon’s forward-looking statements may turn out to be inaccurate, and there are no guarantees about Aon’s performance. The factors identified above are not
exhaustive. Aon and its subsidiaries operate in a dynamic business environment in which new risks may emerge frequently. Further information concerning Aon and its businesses,
including factors that potentially could materially affect Aon's financial results, is contained in Aon's filings with the SEC. See Aon’s Annual Report on Form 10-K and its Quarterly
Reports on Form 10-Q for a further discussion of these and other risks and uncertainties applicable to Aon’s businesses. These factors may be revised or supplemented in subsequent
reports. Aon is under no obligation, and expressly disclaims any obligation, to update or alter any forward-looking statement that it may make from time to time, whether as a result of
new information, future events or otherwise.
Explanation of Non-GAAP Measures
This communication includes supplemental information related to organic revenue, free cash flow, adjusted operating margin, adjusted earnings per share, and adjusted effective tax
rate that exclude the effects of intangible asset amortization, capital expenditures, transaction costs and certain other noteworthy items that affected results for the comparable
periods. Organic revenue excludes from reported revenues the impact of foreign exchange, acquisitions, divestitures, transfers between business units, reimbursable expenses and
unusual items. The impact of foreign exchange is determined by translating last year's revenue, expense or net income at this year's foreign exchange rates. Reconciliations are
provided in the attached schedules. Supplemental organic revenue information and additional measures that exclude the effects of the restructuring charges and certain other items do
not affect net income or any other GAAP reported amounts. Free cash flow is cash flow from operating activity less capital expenditures. The effective tax rate, as adjusted, excludes
the applicable tax impact associated with expenses for legacy litigation. Management believes that these measures are important to make meaningful period-to-period
comparisons and that this supplemental information is helpful to investors. They should be viewed in addition to, not in lieu of, the Company’s Consolidated Financial
Statements. Industry peers provide similar supplemental information regarding their performance, although they may not make identical adjustments.
4. 3
Key Metrics1 – Positive Performance Across All Four Key Metrics
Q4 Organic Revenue:
Organic revenue growth of +3% in Risk Solutions and +5% in HR
Solutions
HR Solutions organic revenue was highlighted by double-digit
growth in the healthcare exchange business
Q4 Operating Margin:
Risk Solutions increased +190 bps driven by solid organic revenue
growth and a +100 bps favorable impact from FX translation
HR Solutions increased +210 bps driven by strong organic revenue
growth and expense discipline, partially offset by a -10 bps
unfavorable impact from FX translation
Q4 EPS:
+13% earnings growth driven by strong operating performance, a
lower effective tax rate, and effective capital management
Includes a $0.03 favorable impact from FX translation
Repurchased approximately $200 million of ordinary shares
2016 Free Cash Flow:
Record cash flow from operations of $2.3 billion driven by an
increase in underlying net income after adjusting for non-cash
pension expenses, lower cash pension contributions, and lower
cash tax payments
Record free cash flow of $2.1 billion reflects 16% growth in cash
flow from operations and a $68 million decrease in capital
expenditures
1 The results presented above are non-GAAP measures that are reconciled in the Appendices of this presentation.
2 Organic revenue, a non-GAAP measure, includes the impact of intersegment and intrasegment activity and excludes the impact of foreign exchange rate
changes, acquisitions, divestitures, transfers between business units, fiduciary investment income, and reimbursable expenses. Change in organic revenue, a
non-GAAP measure, is reconciled to the corresponding U.S. GAAP change in revenue in Appendix A of this presentation.
3 Certain noteworthy items impacted operating margin and earnings per share in the fourth quarter and full year of 2016 and 2015. A reconciliation of non-GAAP
measures for operating margin and diluted earnings per share to the corresponding U.S. GAAP measures is in Appendix B of this presentation.
4 Free cash flow is defined as cash flow from operations less capital expenditures. This non-GAAP measure does not imply or represent
a precise calculation of residual cash flow available for discretionary expenditures. A reconciliation of free cash flow to cash flow,
the corresponding U.S. GAAP measure, can be found in Appendix A of this presentation.
Q4 2016
1. Organic Revenue2 +3% +3%
2. Operating Margin3 26.2% 20.8%
Y-o-Y change +210 bps +80 bps
3. Earnings per Share3 $2.56 $6.59
Y-o-Y change +13% +7%
4. Free Cash Flow4 $2.1B
Y-o-Y change +22%
5. 4
Organic Revenue¹ – Growth Across Both Segments
Q4 Risk Solutions:
Americas: Strong growth in Affinity, as well as
continued record new business generation in US Retail
International: Solid growth across every major region,
including double-digit growth in health and benefits
brokerage in Asia and EMEA and strength in the Pacific
driven by strong new business generation
Reinsurance: Net new business generation in treaty
and growth in facultative placements, partially offset by
a decline in capital market transactions and advisory
business, as well as a modest unfavorable market
impact globally
Q4 2016
Risk Solutions
Americas 3% 4%
International 2% 3%
Retail 3% 4%
Reinsurance 2% 1%
Total Risk Solutions +3% +3%
HR Solutions
Consulting 0% 2%
Outsourcing 8% 4%
Total HR Solutions +5% +3%
Total Aon +3% +3%
Q4 HR Solutions:
Consulting: Solid growth in retirement solutions,
particularly for investment consulting, offset by a decline
in project related work and a modest decline in talent
and compensation consulting
Outsourcing: Strong double-digit growth in health care
exchanges and continued strength in HR BPO for cloud-
based solutions, partially offset by an anticipated
modest decline in benefits administration
1 Organic revenue, a non-GAAP measure, includes the impact of intersegment and intrasegment activity and excludes the impact of foreign exchange rate
changes, acquisitions, divestitures, transfers between business units, fiduciary investment income, and reimbursable expenses. Organic revenue is reconciled
to revenue, the corresponding U.S. GAAP measure in revenue in Appendix A of this presentation.
6. 5
Investing to Maximize Return on Invested Capital and Long-Term Value
“Aon has a truly impressive track record of developing innovative solutions to help solve problems and create
differentiated value in response to specific client needs. We are driving a set of initiatives to maximize return on
invested capital and making strategic investments to position the firm for long-term growth, improved operating
leverage, and further shareholder value creation.”
Risk Solutions HR Solutions
Roll-out of Aon Client Promise and the Revenue Engine
globally to drive greater retention and penetration with
existing clients
Aon InPoint, a growing business that empowers carriers
to become more competitive, effective, and operationally
efficient by integrating our market leading data and
analytics (Global Risk Insight Platform and ReView) with
strategic consulting
Further development of data and analytics capability at
Aon Benfield to strengthen our already industry-leading
value proposition and client serving capability
Aon Broking to better match client needs with insurer
appetite for risk and to identify structured portfolio or
treaty solutions, such as Aon Client Treaty
Investing in high-growth businesses, such as Health &
Benefits brokerage, Cyber, and Affinity
Expansion of content and global footprint through tuck-in
acquisitions that increase scale in emerging markets or
expand capability to better serve clients
Innovative solutions to de-risk pension plans and
support increasing needs for delegated investment and
defined-contribution solutions to fulfill clients’ needs for
effective execution of their investment and retirement
benefit strategies
Strengthening our industry-leading portfolio of health
solutions; including our suite of private health care
exchanges for active employees and retirees, enabling
clients to transition their participants to a market-based,
consumer-driven model, while addressing unsustainable
healthcare cost increases
Investments in data and analytics in our Health and
Retirement & Investment practices, to provide superior
advice and drive better outcomes for our clients and our
clients’ employees
7. 6
$22
$46
$112
2005 2010 2016
$6.4
$8.5
$11.6
2005 2010 2016
Strengthens Position as Preeminent Professional Services Firm
Signed definitive agreement to sell certain outsourcing assets
including benefits administration and HR business process
outsourcing
Transaction further unites Aon as a preeminent professional
services firm and creates catalyst for next step of significant
shareholder value creation
Sharpens focus on delivering advice and solutions related to risk,
retirement and health, enabled by proprietary data and analytics
o $85B of risk premium supported by Inpoint / ReView
technology
o $30B of health premium with full set of health solutions
o $4T of pension assets under independent advisory, with
$90B under delegation
Free cash flow and transaction proceeds to accelerate firm’s
investment in high growth and return on invested capital
opportunities
o Recent examples: cyber risk advisory, health & benefits
brokerage
Stock Price ($)
Total Revenue ($ billions)
8. 7
11.7 12.2 12.9 13.6
15.4 16.4 17.1
2010 2011 2012 2013 2014 2015 2016
$186 $696
$2,104
2005 2010 2016
Significant Capital to Drive ROIC and Shareholder Value Creation
Generates expected gross cash proceeds up to $4.8 billion,
including $4.3 billion of gross cash at closing and additional
consideration up to $500 million based on performance. After-tax
cash proceeds expected to be $3.0 billion:
o Reflects 12.1x 2016 EBITDA of $396 million, which
includes intercompany, corporate allocations and other
expense adjustments
Reinforces proven historical track record of disciplined
management approach to improving return on invested capital
(ROIC)
Expect transaction to be accretive to 2018 adjusted EPS1:
o Deployment of substantial free cash flow and transaction
proceeds
o Savings from operating model integration
o Lower effective tax rate
Increased share repurchase program by $5.0 billion, bringing the
total amount currently authorized for repurchase to approximately
$7.7 billion as of February 10, 2017
Transaction is expected to close by the end of the second quarter
2017, and results of the assets will be placed into discontinued
operations beginning in the first quarter of 2017
Return on Invested Capital2 (%)
Free Cash Flow ($ millions)
1 Accretive to 2018 FactSet consensus analyst estimates of $7.97 per share on February 9, 2017.
2 ROIC calculated as net operating profit after tax (NOPAT) divided by average invested capital (short-term debt, + long-term debt + total equity).
9. 8
$633
$686
Net Income¹
EPS1 – Delivered Double-Digit Earnings Growth to Finish the Year
($ millions) Q4 2016
Net Income2 $686 $1,780
Y-o-Y change +8% +2%
Earnings Per Share2 $2.56 $6.59
Y-o-Y change +13% +7%
1 The results presented are non-GAAP measures that are reconciled in the Appendices of this presentation.
2 Certain noteworthy items impacted net income and earnings per share in the fourth quarter and full year of 2016 and 2015. A reconciliation of non-GAAP
measures for net income and diluted earnings per share to the corresponding U.S. GAAP measure is in Appendix B of this presentation.
$2.27
$2.56
EPS¹
Q4’15 Q4’16
“In summary, we delivered solid organic growth across both segments, strengthened our overall
operational performance, and delivered record free cash flow of more than $2.1 billion for the year,
while continuing to make an unmatched level of strategic investments that align the firm around
advisory and analytical capabilities and improved return on invested capital.”
10. 9
Operating Margins1 – Record Operating Margins in Both Segments
Q4 Risk Solutions Operating Margin:
Positive Impact:
Organic revenue growth of +3%
Return on investments
Favorable impact of $12 million, or +100 bps,
due to foreign currency translation
Negative Impact:
$6 million, or -30 bps, of transaction costs
related to acquisitions
Q4 2016
Risk Solutions
Operating Income2 $566 $1,836
Y-o-Y change +9% +5%
Operating Margin2 27.6% 24.5%
Y-o-Y change +190 bps +90 bps
HR Solutions
Operating Income2 $363 $770
Y-o-Y change +7% -1%
Operating Margin2 28.3% 18.4%
Y-o-Y change +210 bps +30 bps
Q4 HR Solutions Operating Margin:
Positive Impact:
Organic revenue growth of +5%
Expense discipline
Negative Impact:
Unfavorable impact of $8 million, or -10 bps,
due to foreign currency translation
($ millions)
1 The results presented are non-GAAP measures that are reconciled in the Appendices of this presentation.
2 Certain noteworthy items impacted operating income and operating margin in the fourth quarter and full year of 2016 and 2015. A reconciliation of non-GAAP
measures for operating income and operating margin to the corresponding U.S. GAAP measure is in Appendix B of this presentation.
11. 10
Unallocated Expense & Non-Operating Segment Financials
Q4’15 Q4’16
Quarterly
Guidance
Unallocated Expense1 ($61) ($57) ($45)
Interest Income $4 $3 $3
Interest Expense ($68) ($70) ($70)
Other Income (Expense) $49 $9 -
Effective Tax Rate2 17.9% 14.9% -
Minority interest ($6) ($7) ($9)
Actual common shares
outstanding at 12-31-16
N/A 262.0 -
Interest expense increased $2 million to $70
million due to an increase in total debt
outstanding
Other Income of $9 million primarily includes
gains due to the favorable impact of exchange
rates on the remeasurement of assets and
liabilities in non-functional currencies
Adjusted effective tax rate, excluding the
applicable tax impact associated with certain
non-cash pension expenses, was 14.9%
primarily reflecting certain favorable discrete tax
adjustments against our underlying operating
rate of 19%
Actual common shares outstanding on
December 31st were 262.0 million, and there
were approximately 5 million additional dilutive
equivalents. The Company repurchased 1.8
million ordinary shares for approximately $200
million in the fourth quarter. Estimated Q1’17
beginning dilutive share count is ~267 million
subject to share price movement, share
issuance and share repurchase
($ millions)
1 Certain noteworthy items impacted earnings per share in the fourth quarter and full year of 2016 and 2015. A reconciliation of non-GAAP measures for
diluted earnings per share to the corresponding U.S. GAAP measure is in Appendix B of this presentation.
2 The effective tax rate used in the U.S. GAAP financial statements were 10.9% and 15.8% for the three months ended December 31, 2016 and 2015,
respectively, and 14.3% and 15.8% for the twelve months ended December 31, 2016 and 2015, respectively. Reconciling items are generally taxed at the
effective tax rate. However, after adjusting to exclude the applicable tax impact associated with non-cash pension expenses, the adjusted effective tax rates
for the fourth quarter and twelve months ended December 31, 2016 were 14.9% and 16.8%, respectively.
12. 11
2015 2016
$2,009
$2,326
Solid Balance Sheet and Record Free Cash Flow Generation
Sept 30,
2016
Dec 31,
2016
Cash $483 $431
Short-term
Investments
$463 $290
Total Debt $6,160 $6,205
Total Aon
Shareholders’
Equity
$5,434 $5,470
Debt to EBITDA 2.4x 2.5x
Balance Sheet
($ millions)
1 Free cash flow is defined as cash flow from operations less capital expenditures. This non-GAAP measure does not imply or represent a precise calculation of
residual cash flow available for discretionary expenditures. A reconciliation of free cash flow to cash flow, the corresponding U.S. GAAP measure, can be found
in Appendix A of this presentation.
Cash Flow from Operations
($ millions)
Free Cash Flow 1
($ millions)
Cash Flow Commentary:
Record cash flow from operations of $2.3 billion driven by an increase in
underlying net income after adjusting for non-cash pension expenses,
lower cash pension contributions, and lower cash tax payments
Record free cash flow of $2.1 billion reflects higher cash flow from
operations and a $68 million decrease in capital expenditures
In 2016, we delivered strong double-digit free cash flow growth, reflecting
momentum behind a number of initiatives we continue to drive as we
focus on converting a dollar of revenue into a dollar of free cash flow
2015 2016
$1,719 $2,104
13. 12
Double-Digit Free Cash Flow1 Growth Over the Long-Term
1 Free cash flow is defined as cash flow from operations less capital expenditures. This non-GAAP measure does not imply or represent a precise calculation of
residual cash flow available for discretionary expenditures. A reconciliation of free cash flow to cash flow, the corresponding U.S. GAAP measure, can be
found in Appendix A of this presentation.
Free Cash Flow ($ millions)
$442
$696
$871
$1,265
$1,524 $1,556
$1,719
$2,104
2009 2010 2011 2012 2013 2014 2015 2016
Substantial progress since introducing free cash flow as a key financial metric in 2012 and continue to
take significant steps to position the firm for double-digit free cash flow growth over the long-term
Three primary areas that we expect to contribute to free cash flow generation going forward:
1. Operational improvement as the firm continues to deliver growth and improve return on invested capital
2. Working capital improvements as the firm focuses on closing the gap between receivables and payables
3. Lower cash tax payments reflecting the lower effective tax rate
16. 15
Appendix B: Reconciliation of Non-GAAP Measures – Operating Margin
and Diluted Earnings per Share
Three Months Ended December 31, 2016 Twelve Months Ended December31, 2016
(millions)
Risk
Solutions
HR
Solutions
Unallocated
Income &
Expense Total
Risk
Solutions
HR
Solutions
Unallocated
Income &
Expense Total
Revenue $ 2,051 $ 1,281 $ (9) $ 3,323 $ 7,485 $ 4,183 $ (41) $ 11,627
Operating income (loss) - as reported $ 455 $ 281 $ (107) $ 629 $ 1,587 $ 557 $ (238) $ 1,906
Intangible asset amortization 28 42 — 70 105 172 — 277
Pension Settlements 83 25 50 158 144 26 50 220
Transaction Costs $ 15 $ 15 $ 15 $ 15
Operating income (loss) - as adjusted $ 566 $ 363 $ (57) $ 872 $ 1,836 $ 770 $ (188) $ 2,418
Operating margins - as adjusted 27.6% 28.3% N/A 26.2% 24.5% 18.4% N/A 20.8%
Three Months Ended December 31, 2015 Twelve Months Ended December 31, 2015
(millions)
Risk
Solutions
HR
Solutions
Unallocated
Income &
Expense Total
Risk
Solutions
HR
Solutions
Unallocated
Income &
Expense Total
Revenue $ 2,009 $ 1,290 $ (11) $ 3,288 $ 7,426 $ 4,303 $ (47) $ 11,682
Operating income (loss) - as reported $ 491 $ 287 $ (61) $ 717 $ 1,506 $ 536 $ (194) $ 1,848
Intangible asset amortization 26 51 — 77 109 205 — 314
Legacy litigation — — — — 137 39 — 176
Operating income (loss) - as adjusted $ 517 $ 338 $ (61) $ 794 $ 1,752 $ 780 $ (194) $ 2,338
Operating margins - as adjusted 25.7% 26.2% N/A 24.1% 23.6% 18.1% N/A 20.0%
Three Months Ended December 31, Twelve Months Ended December 31,
(millions except per share data) 2016 2015 2016 2015
Operating income - as adjusted $ 872 $ 794 $ 2,418 $ 2,338
Interest income 3 4 9 14
Interest expense (70) (68) (282) (273)
Other income 9 49 36 100
Income before income taxes - as adjusted 814 779 2,181 2,179
Income taxes (2) 121 140 367 389
Net income - as adjusted 693 639 1,814 1,790
Less: Net income attributable to noncontrolling interests 7 6 34 37
Net income attributable to Aon shareholders- as adjusted $ 686 $ 633 $ 1,780 $ 1,753
Diluted earnings per share- as adjusted $ 2.56 $ 2.27 $ 6.59 $ 6.18
Weighted average ordinary shares outstanding- diluted 268.3 279.3 270.3 283.8
(1) Certain noteworthy items impacting operating income in 2016 and 2015 are described in this schedule. The items shown with thecaption
"as adjusted" are non-GAAP measures.
(2) The effective tax rate used in the U.S. GAAP financial statements were 10.9% and 15.8% for the three months ended December 31,
2016 and 2015, respectively, and 14.3% and 15.8% for the twelve months ended December31, 2016 and 2015, respectively.
Reconciling items are generally taxed at the effective tax rate. However, after adjusting to exclude the applicable tax impact associated
with non-cash pension expenses, the adjusted effective tax rates for the fourth quarter and twelve months ended December 31, 2016
were 14.9% and 16.8%, respectively. After adjusting the underlying annual tax rate to exclude the impact associated with expenses for
legacy litigation in the second quarter, the adjusted effective tax rates for both the fourth quarter and twelve months of 2015 was 17.9%.