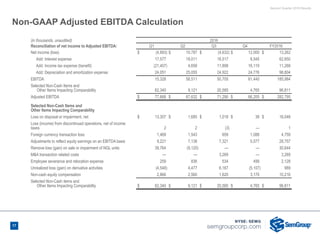
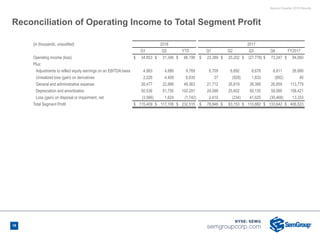
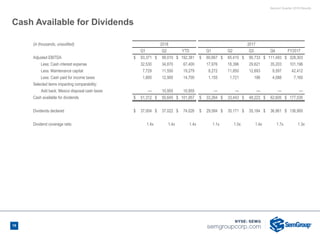
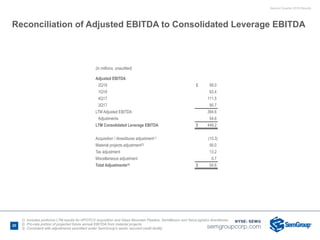
2. Second Quarter 2018 Results
2
Non-GAAP Financial Measures
SemGroup’s non-GAAP measures, Adjusted EBITDA, Cash Available for Dividends (CAFD) and Total Segment Profit, are not GAAP measures and are not
intended to be used in lieu of GAAP presentation of their most closely associated GAAP measures, net income (loss) for Adjusted EBITDA and CAFD and
operating income for Total Segment Profit.
Adjusted EBITDA represents earnings before interest, taxes, depreciation and amortization, adjusted for selected items that SemGroup believes impact the
comparability of financial results between reporting periods. In addition to non-cash items, we have selected items for adjustment to EBITDA which management
feels decrease the comparability of our results among periods. These items are identified as those which are generally outside of the results of day to day
operations of the business. These items are not considered non-recurring, infrequent or unusual, but do erode comparability among periods in which they occur
with periods in which they do not occur or occur to a greater or lesser degree. Historically, we have selected items such as gains on the sale of NGL Energy
Partners LP common units, costs related to our predecessor’s bankruptcy, significant business development related costs, significant legal settlements,
severance and other similar costs. Management believes these types of items can make comparability of the results of day to day operations among periods
difficult and have chosen to remove these items from our Adjusted EBITDA. We expect to adjust for similar types of items in the future. Although we present
selected items that we consider in evaluating our performance, you should be aware that the items presented do not represent all items that affect comparability
between the periods presented. Variations in our operating results are also caused by changes in volumes, prices, mechanical interruptions and numerous other
factors. We do not adjust for these types of variances.
CAFD is based on Adjusted EBITDA, as defined above, and reduced for cash income taxes, cash interest expense, preferred stock cash dividends and
maintenance capital expenditures, as adjusted for selected items which management feels decrease the comparability of results among periods. CAFD is a
performance measure utilized by management to analyze our performance after the payment of cash taxes, servicing debt obligations and making sustaining
capital expenditures.
Total Segment Profit represents revenue, less cost of products sold (exclusive of depreciation and amortization) and operating expenses, plus equity earnings
and is adjusted to remove unrealized gains and losses on commodity derivatives and to reflect equity earnings on an EBITDA basis. Reflecting equity earnings
on an EBITDA basis is achieved by adjusting equity earnings to exclude our percentage of interest, taxes, depreciation and amortization from equity earnings for
operated equity method investees. For our investment in NGL Energy, we exclude equity earnings and include cash distributions received. Segment profit is the
measure by which management assess the performance of our reportable segments.
These measures may be used periodically by management when discussing our financial results with investors and analysts and are presented as management
believes they provide additional information and metrics relative to the performance of our businesses. These non-GAAP financial measures have important
limitations as analytical tools because they exclude some, but not all, items that affect the most directly comparable GAAP financial measures. You should not
consider non-GAAP measures in isolation or as substitutes for analysis of our results as reported under GAAP. Management compensates for the limitations of
our non-GAAP measures as analytical tools by reviewing the comparable GAAP measures, understanding the differences between the non-GAAP measure and
the most comparable GAAP measure and incorporating this knowledge into its decision-making processes. We believe that investors benefit from having access
to the same financial measures that our management uses in evaluating our operating results. Because all companies do not use identical calculations, our
presentations of non-GAAP measures may be different from similarly titled measures of other companies, thereby diminishing their utility.
SemGroup does not provide guidance for net income, the GAAP financial measure most directly comparable to the non-GAAP financial measure Adjusted
EBITDA, because Net Income includes items such as unrealized gains or losses on derivative activities or similar items which, because of their nature, cannot
be accurately forecasted. We do not expect that such amounts would be significant to Adjusted EBITDA as they are largely non-cash items.
3. Second Quarter 2018 Results
3
Certain matters contained in this Presentation include “forward-looking statements” within the meaning of Section 27A of the Securities Act of 1933, as amended,
and Section 21E of the Securities Exchange Act of 1934, as amended. We make these forward-looking statements in reliance on the safe harbor protections
provided under the Private Securities Litigation Reform Act of 1995.
All statements, other than statements of historical fact, included in this presentation including the prospects of our industry, our anticipated financial performance,
our anticipated annual dividend growth rate, management's plans and objectives for future operations, planned capital expenditures, business prospects, outcome
of regulatory proceedings, market conditions and other matters, may constitute forward-looking statements. Although we believe that the expectations reflected in
these forward-looking statements are reasonable, we cannot assure you that these expectations will prove to be correct. These forward-looking statements are
subject to certain known and unknown risks and uncertainties, as well as assumptions that could cause actual results to differ materially from those reflected in
these forward-looking statements. Factors that might cause actual results to differ include, but are not limited to, our ability to generate sufficient cash flow from
operations to enable us to pay our debt obligations and our current and expected dividends or to fund our other liquidity needs; any sustained reduction in demand
for, or supply of, the petroleum products we gather, transport, process, market and store; the effect of our debt level on our future financial and operating flexibility,
including our ability to obtain additional capital on terms that are favorable to us; our ability to access the debt and equity markets, which will depend on general
market conditions and the credit ratings for our debt obligations and equity; the failure to realize the anticipated benefits of our acquisition of 100 percent of the
equity interests in Buffalo Parent Gulf Coast Terminals LLC, the parent company of Buffalo Gulf Coast Terminals LLC and HFOTCO LLC, doing business as
Houston Fuel Oil Terminal Company (“HFOTCO”); the loss of, or a material nonpayment or nonperformance by, any of our key customers; the amount of cash
distributions, capital requirements and performance of our investments and joint ventures; the consequences of any divestitures of non-strategic operating assets or
divestitures of interests in some of our operating assets through partnerships and/or join ventures; the amount of collateral required to be posted from time to time in
our commodity purchase, sale or derivative transactions; the impact of operational and developmental hazards and unforeseen interruptions; our ability to obtain
new sources of supply of petroleum products; competition from other midstream energy companies; our ability to comply with the covenants contained in our credit
agreements, continuing covenant agreement, and the indentures governing our notes, including requirements under our credit agreements and continuing covenant
agreement to maintain certain financial ratios; our ability to renew or replace expiring storage, transportation and related contracts; the overall forward markets for
crude oil, natural gas and natural gas liquids; the possibility that the construction or acquisition of new assets may not result in the corresponding anticipated
revenue increases; any future impairment of goodwill resulting from the loss of customers or business; changes in currency exchange rates; weather and other
natural phenomena, including climate conditions; a cyber attack involving our information systems and related infrastructure, or that of our business associates; the
risks and uncertainties of doing business outside of the U.S., including political and economic instability and changes in local governmental laws, regulations and
policies; costs of, or changes in, laws and regulations and our failure to comply with new or existing laws or regulations, particularly with regard to taxes, safety and
protection of the environment; the possibility that our hedging activities may result in losses or may have a negative impact on our financial results; general
economic, market and business conditions; as well as other risk factors discussed from time to time in our each of our documents and reports filed with the SEC.
Readers are cautioned not to place undue reliance on any forward-looking statements contained in this press release, which reflect management’s opinions only as
of the date hereof. Except as required by law, we undertake no obligation to revise or publicly release the results of any revision to any forward-looking statements.
We use our Investor Relations website and social media outlets as channels of distribution of material company information. Such information is routinely posted
and accessible on our Investor Relations website at ir.semgroupcorp.com. We are present on Twitter and LinkedIn: SemGroup Twitter and LinkedIn
Forward-Looking Information
4. Second Quarter 2018 Results
4
Ñ Secure Cash Flows Drive Earnings
• 2Q Adjusted EBITDA $99 million, up 6% over prior quarter, on higher crude and gas volumes
in the Mid-Continent
• On target with full-year 2018 guidance of $385 to $415 million
• Dividend Coverage of 1.4x
Ñ Balance Sheet Focus and Prudent CAPEX Spending
• $800 million raised to date in capital plan; additional capital raise remains a high priority
• Refinanced HFOTCO term loan, lowered interest rate and extended maturity
• Year-to-date capex spend: $217 million, full-year 2018 guidance of $350 million
Ñ Project Execution and Asset Utilization in Key Regions
• Gulf Coast: Completed new ship dock and 1.45 mmbbls crude storage tanks
• Mid-Continent: Optimizing White Cliffs Pipeline with NGL conversion; and capturing growing
STACK and Mississippi Lime liquid-rich gas
• Canada: Wapiti Plant expected online in early 2019; Smoke Lake Plant expected completion
2H 2019
Continued Execution of Strategic Transformation
Note: Non-GAAP Financial Data Reconciliations are included in the Appendix to this presentation
Focused on Strengthening Balance Sheet and Completing High-Return Projects
5. Second Quarter 2018 Results
5 Note: Non-GAAP Financial Data Reconciliations are included in the Appendix to this presentation
($ in millions, except per share)
Net Income (loss) $(33.0) $(2.7) $(35.7)
Adjusted EBITDA 93.4 99.0 192.4
Cash Available for Dividends 51.3 50.6 101.9
Common Dividend declared per share $0.4725 $0.4725
Dividend Coverage Ratio 1.4x 1.4x 1.4x
Consolidated Leverage Ratio 4.1x 5.6x
Ñ Key Highlights
• Net loss improved quarter over quarter primarily due to lower income tax and interest expense
pertaining to non-recurring items recognized during the first quarter
• Adjusted EBITDA increased 6% over the prior quarter due to stronger crude volumes and margins, as
well as the absence of a one-time insurance claim write-off recognized during the first quarter
• Declared common stock dividend of $0.4725 per share, dividend coverage of 1.4x
• Elected non-cash, payment-in-kind (PIK) preferred stock dividend
• Targeting consolidated leverage of 5.0x or lower by year-end 2019
Second Quarter 2018 Results
2Q181Q18 YTD
6. Second Quarter 2018 Results
6
($ in millions)
Crude Transportation $34.3 $37.9 $72.2
Crude Facilities 9.3 9.7 19.0
Crude Supply and Logistics (6.6) (2.0) (8.6)
HFOTCO 31.0 34.8 65.8
SemGas 14.3 15.4 29.7
SemCAMS 22.1 21.4 43.5
Corporate/Other 11.0 (0.1) 10.9
Total Segment Profit $115.4 $117.1 $232.5
Segment Profit
Ñ Second Quarter vs First Quarter 2018
• Crude Transportation increased $3.6 million driven by higher White Cliffs Pipeline volumes
• Crude Facilities was relatively flat as storage and throughput volumes remained consistent
• Crude Supply and Logistics improved due to location differentials
• HFOTCO increased due to the absence of a $4 million write-off of an insurance claim during 1Q
• SemGas increased primarily due to higher STACK volumes
• SemCAMS results were flat; volumes decreased due to planned KA plant turnaround
• Corporate/Other down due to the absence of divested assets, SemLogistics and SemMexico
2Q181Q18 YTD
7. Second Quarter 2018 Results
7
Execution as promised:
• Funded final HFOTCO payment
• Completed sale of SemLogistics and SemMexico
• Announced White Cliffs Pipeline NGL re-purposing
• Completed new ship dock and crude tanks at HFOTCO
• Refinanced HFOTCO term loan, lowered interest rate and extended maturity
• Wapiti and Smoke Lake Plant projects on track
• Making progress on de-levering plans
Transforming
Portfolio
Executing
Opportunities
Delivering
Shareholder
Value
7
Driving Shareholder Value
Clear Path to Long-Term Growth
9. Second Quarter 2018 Results
9
($inmillions)
2016 2017 2018E
$283
$328
$385 - $415
2016 - 2018 CAGR of ~20%
2018 Adjusted EBITDA Guidance
($ in millions)
2018 Adjusted EBITDA $385 - $415
Continuing Portfolio Transformation through 2018 for Long-Term Financial Strength
Ñ Growing earnings while improving quality of earnings
Ñ Divestments contributed $34 million of 2017 Adjusted EBITDA
Ñ Additional EBITDA to come online in 2019 already contracted
Key Guidance Assumptions
Crude
White Cliffs Pipeline Average Volumes (mbbl/d) 100-110
Average Cushing Terminal Utilization 95-100%
SemGas
Average Processing Volumes (mmcf/d) 375-400
SemCAMS
Average Throughput Volumes (mmcf/d) 425-440
HFOTCO
Average Terminal Utilization 95-100%
Ñ 2018 divestments contribute ~$9 million of 2018 Adjusted EBITDA
Ñ SemCAMS - KA plant turnaround in 2Q18
Ñ Expect no U.S. cash taxes
10. Second Quarter 2018 Results
10
Key Projects Driving Financial Growth 2018, 2019 and beyond
2018 Capital Expenditures Guidance
Projects 2Q18 3Q18 4Q18 1H19 2H19 2020+
HFOTCO Ship Dock 5 & Crude Storage Tanks: $120mm(1)
~7x EBITDA multiple
Wapiti Plant: $250mm ~6x EBITDA multiple
Smoke Lake Plant: $50mm ~6x EBITDA multiple
White Cliffs Pipeline, 12" NGL Pipeline Conversion: $32mm(2)
< 4x EBITDA multiple
Maintenance Growth
Total Capital Expenditures
($inmillions)
2016 2017 2018e
$52 $45 $40
$255
$307
$447
$492
$310
$350
Canada
Mid-Continent
Gulf Coast
Maintenance
2018 Capex Guidance - $350 million
Spending by Strategic Area
$193
55%
$50
14%
$67
19%
$40
11%
1) Expected SemGroup project spend on HFOTCO projects; excludes ~$65 million spent prior to close. The 7x
multiple is based on the total project cost of $185 million
2) Represents SemGroup's 51% expected spend; total project spend of $60-66 million, minimal capital in 2018
12%
11. Second Quarter 2018 Results
11
Leverage and Liquidity
($ in millions, unaudited)
6/30/2018
SemGroup (B2 / B+)
Revolving Credit Facility - $1.0 Billion due 2021 $ 375
5.625% Senior unsecured notes due 2022 400
5.625% Senior unsecured notes due 2023 350
6.375% Senior unsecured notes due 2025 325
7.250% Senior unsecured notes due 2026 300
Total SEMG Debt $ 1,750
HFOTCO (Ba3 / BB-)
Term Loan due 2025 600
Hurricane Ike Bonds due 2050 225
Total HFOTCO Debt $ 825
SemGroup Net Leverage Ratio (max 5.5x)(1)
4.6x
Consolidated Net Leverage Ratio(2)
5.6x
Consolidated Available Liquidity(3)
$ 652
1) SemGroup's net leverage ratio calculated per the senior secured credit facility definitions, which includes a pro-rata portion of projected
future annual EBITDA from material projects
2) Calculated as consolidated net debt to LTM consolidated leverage EBITDA, see additional information on slide 20
3) Available liquidity is reduced for outstanding letters of credit
Ñ HFOTCO Term Loan Refinancing
• $600 million
• LIBOR + 2.75%, reduction of 75 bps
• Maturity extended to 2025
• Covenant-lite
• Proceeds fully paid and canceled revolver
Ñ Preferred Equity Offering - 1Q18
• Offering size - $350 million
• Dividend - 7%
• Conversion Price - $33.00 per share
Ñ Targeting consolidated leverage of 5.0x
or lower by year-end 2019
Ñ No significant debt maturities until 2021
12. Second Quarter 2018 Results
12
Operational Summary
1Q17 2Q17 3Q17 4Q17 1Q18 2Q18
Crude Transportation
Transportation Volumes (mbbl/d) 179 182 190 193 182 188
White Cliffs Pipeline Volumes (mbbl/d) 111 107 105 92 107 135
Crude Facilities
Average Cushing Terminal Utilization 100% 94% 94% 100% 98% 97%
HFOTCO(1)
Average Terminal Utilization n/a n/a 98% 98% 97% 97%
SemGas(2)
Total Average Processing Volumes (mmcf/d) 287 277 265 252 305 367
SemCAMS(3)
Total Average Throughput Volumes (mmcf/d) 414 349 414 452 441 382
1) HFOTCO acquisition closed July 17, 2017
2) SemGas volumes include total processed volumes - Oklahoma and Texas plants
3) SemCAMS volumes include total processed volumes - K3, KA and West Fox Creek facilities
4) LTM June 30, 2018, pro forma for full-year HFOTCO acquisition and Maurepas Pipeline
Over 95% of total LTM gross margin
from fee based cash flows
Take-or-Pay Fixed Fee POP/Marketing
2014 2015 2016 2017 2018
23% 30% 38%
49% 57%
64% 59% 51%
46%
40%
13% 11% 11%
(4)
5% 3%
13. Second Quarter 2018 Results
13
Consolidated Balance Sheets
(in thousands, unaudited, condensed) June 30,
2018
December 31,
2017
ASSETS
Current assets $ 695,864 $ 902,899
Property, plant and equipment, net 3,415,505 3,315,131
Goodwill and other intangible assets 639,142 655,945
Equity method investments 276,120 285,281
Other noncurrent assets, net 145,044 132,600
Noncurrent assets held for sale — 84,961
Total assets $ 5,171,675 $ 5,376,817
LIABILITIES, PREFERRED STOCK AND OWNERS' EQUITY
Current liabilities:
Current portion of long-term debt $ 6,000 $ 5,525
Other current liabilities 608,196 761,036
Total current liabilities 614,196 766,561
Long-term debt, excluding current portion 2,534,894 2,853,095
Other noncurrent liabilities 90,937 85,080
Noncurrent liabilities held for sale — 13,716
Total liabilities 3,240,027 3,718,452
Preferred stock 347,130 —
Owners' equity 1,584,518 1,658,365
Total liabilities, preferred stock and owners' equity $ 5,171,675 $ 5,376,817
14. Second Quarter 2018 Results
14
Consolidated Statements of Operations and Comprehensive Income (Loss)
(in thousands, except per share amounts, unaudited, condensed) 2018 2017
Q1 Q2 YTD Q1 Q2 Q3 Q4 FY2017
Revenues $ 661,609 $ 595,794 $ 1,257,403 $ 456,100 $ 473,089 $ 545,922 $ 606,806 $ 2,081,917
Expenses:
Costs of products sold, exclusive of depreciation and
amortization shown below 496,132 412,089 908,221 348,998 340,107 398,252 427,534 1,514,891
Operating 69,791 90,245 160,036 52,083 73,346 62,666 66,669 254,764
General and administrative 26,477 22,886 49,363 21,712 26,819 38,389 26,859 113,779
Depreciation and amortization 50,536 51,755 102,291 24,599 25,602 50,135 58,085 158,421
Loss (gain) on disposal or impairment, net (3,566) 1,824 (1,742) 2,410 (234) 41,625 (30,468) 13,333
Total expenses 639,370 578,799 1,218,169 449,802 465,640 591,067 548,679 2,055,188
Earnings from equity method investments 12,614 14,351 26,965 17,091 17,753 17,367 15,120 67,331
Operating income (loss) 34,853 31,346 66,199 23,389 25,202 (27,778) 73,247 94,060
Other expenses, net 44,805 37,685 82,490 33,571 11,966 28,574 39,487 113,598
Income (loss) from continuing operations before income taxes (9,952) (6,339) (16,291) (10,182) 13,236 (56,352) 33,760 (19,538)
Income tax expense (benefit) 23,083 (3,613) 19,470 95 3,625 (37,249) 31,141 (2,388)
Net income (loss) (33,035) (2,726) (35,761) (10,277) 9,611 (19,103) 2,619 (17,150)
Less: cumulative preferred stock dividends 4,832 6,211 11,043 — — — — —
Net income (loss) attributable to common shareholders $ (37,867) $ (8,937) $ (46,804) $ (10,277) $ 9,611 $ (19,103) $ 2,619 $ (17,150)
Net income (loss) $ (33,035) $ (2,726) $ (35,761) $ (10,277) $ 9,611 $ (19,103) $ 2,619 $ (17,150)
Other comprehensive income (loss), net of income taxes 18,171 6,180 24,351 6,033 8,952 9,230 (4,102) 20,113
Comprehensive income (loss) $ (14,864) $ 3,454 $ (11,410) $ (4,244) $ 18,563 $ (9,873) $ (1,483) $ 2,963
Net income (loss) per common share:
Basic $ (0.48) $ (0.11) $ (0.60) $ (0.16) $ 0.15 $ (0.25) $ 0.03 $ (0.24)
Diluted $ (0.48) $ (0.11) $ (0.60) $ (0.16) $ 0.15 $ (0.25) $ 0.03 $ (0.24)
Weighted average shares (thousands):
Basic 78,198 78,319 78,259 65,692 65,749 75,974 78,189 71,418
Diluted 78,198 78,319 78,259 65,692 66,277 75,974 78,749 71,418
15. Second Quarter 2018 Results
15
Non-GAAP Adjusted EBITDA Calculation
(in thousands, unaudited) 2018 2017
Reconciliation of net income to Adjusted EBITDA: Q1 Q2 YTD Q1 Q2 Q3 Q4 FY2017
Net income (loss) $ (33,035) $ (2,726) $ (35,761) $ (10,277) $ 9,611 $ (19,103) $ 2,619 $ (17,150)
Add: Interest expense 42,461 35,904 78,365 13,867 13,477 32,711 42,954 103,009
Add: Income tax expense (benefit) 23,083 (3,613) 19,470 95 3,625 (37,249) 31,141 (2,388)
Add: Depreciation and amortization expense 50,536 51,755 102,291 24,599 25,602 50,135 58,085 158,421
EBITDA 83,045 81,320 164,365 28,284 52,315 26,494 134,799 241,892
Selected Non-Cash Items and
Other Items Impacting Comparability 10,326 17,690 28,016 32,383 13,095 64,239 (23,306) 86,411
Adjusted EBITDA $ 93,371 $ 99,010 $ 192,381 $ 60,667 $ 65,410 $ 90,733 $ 111,493 $ 328,303
Selected Non-Cash Items and
Other Items Impacting Comparability
Loss (gain) on disposal or impairment, net $ (3,566) $ 1,824 $ (1,742) $ 2,410 $ (234) $ 41,625 $ (30,468) $ 13,333
Foreign currency transaction loss (gain) 3,294 2,314 5,608 — (1,011) (747) (2,951) (4,709)
Adjustments to reflect equity earnings on an EBITDA basis 4,883 4,886 9,769 6,709 6,692 6,678 6,811 26,890
M&A transaction related costs 1,156 648 1,804 — 5,453 14,886 1,649 21,988
Pension plan curtailment loss (gain) — — — — — (3,097) 89 (3,008)
Employee severance and relocation expense 137 211 348 558 312 104 720 1,694
Unrealized loss (gain) on derivative activities 2,226 4,409 6,635 27 (928) 1,833 (892) 40
Non-cash equity compensation 2,196 3,398 5,594 2,757 2,803 2,957 1,736 10,253
Loss on early extinguishment of debt — — — 19,922 8 — — 19,930
Selected Non-Cash items and
Other Items Impacting Comparability $ 10,326 $ 17,690 $ 28,016 $ 32,383 $ 13,095 $ 64,239 $ (23,306) $ 86,411