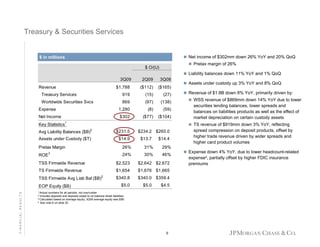
EOP Loans & Leases
Avg Deposits
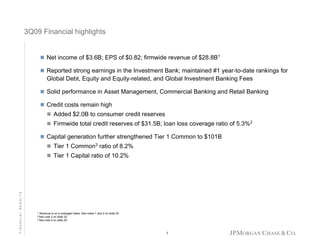
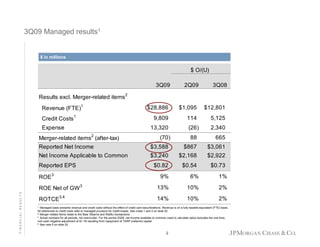
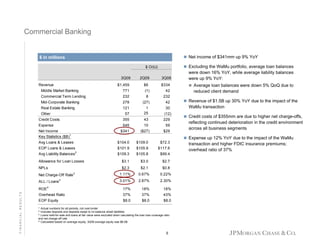
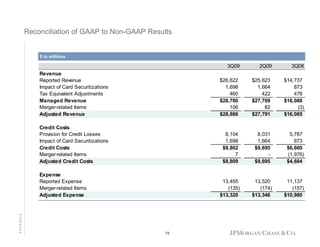
FINANCIAL RESULTS
1
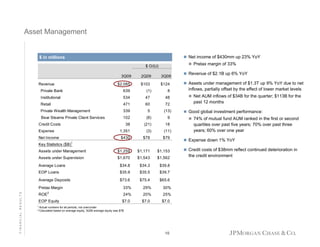
Actual numbers for all periods, not over/under
2 Calculated based on average equity; 3Q09 average equity was $2B
3 Excludes loans held-for-sale and loans at fair value
4 Calculated based on average equity; 3Q09 average equity was $2B
8
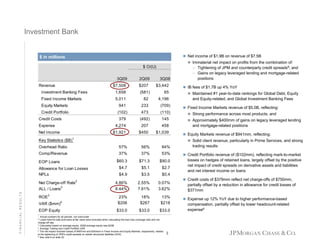
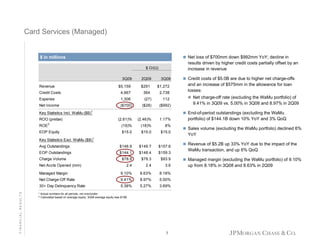
Total revenue of $1.5B up 4% YoY driven by growth in
Middle Market Banking and Real Estate Banking, partially
offset by lower Commercial Term Lending revenue
Credit costs of $43mm reflect higher net charge-offs
Expense up 10


![]](https://cdn.slidesharecdn.com/ss_thumbnails/random-131208211325-phpapp02-thumbnail.jpg?width=640&height=640&fit=bounds)