Download to read offline

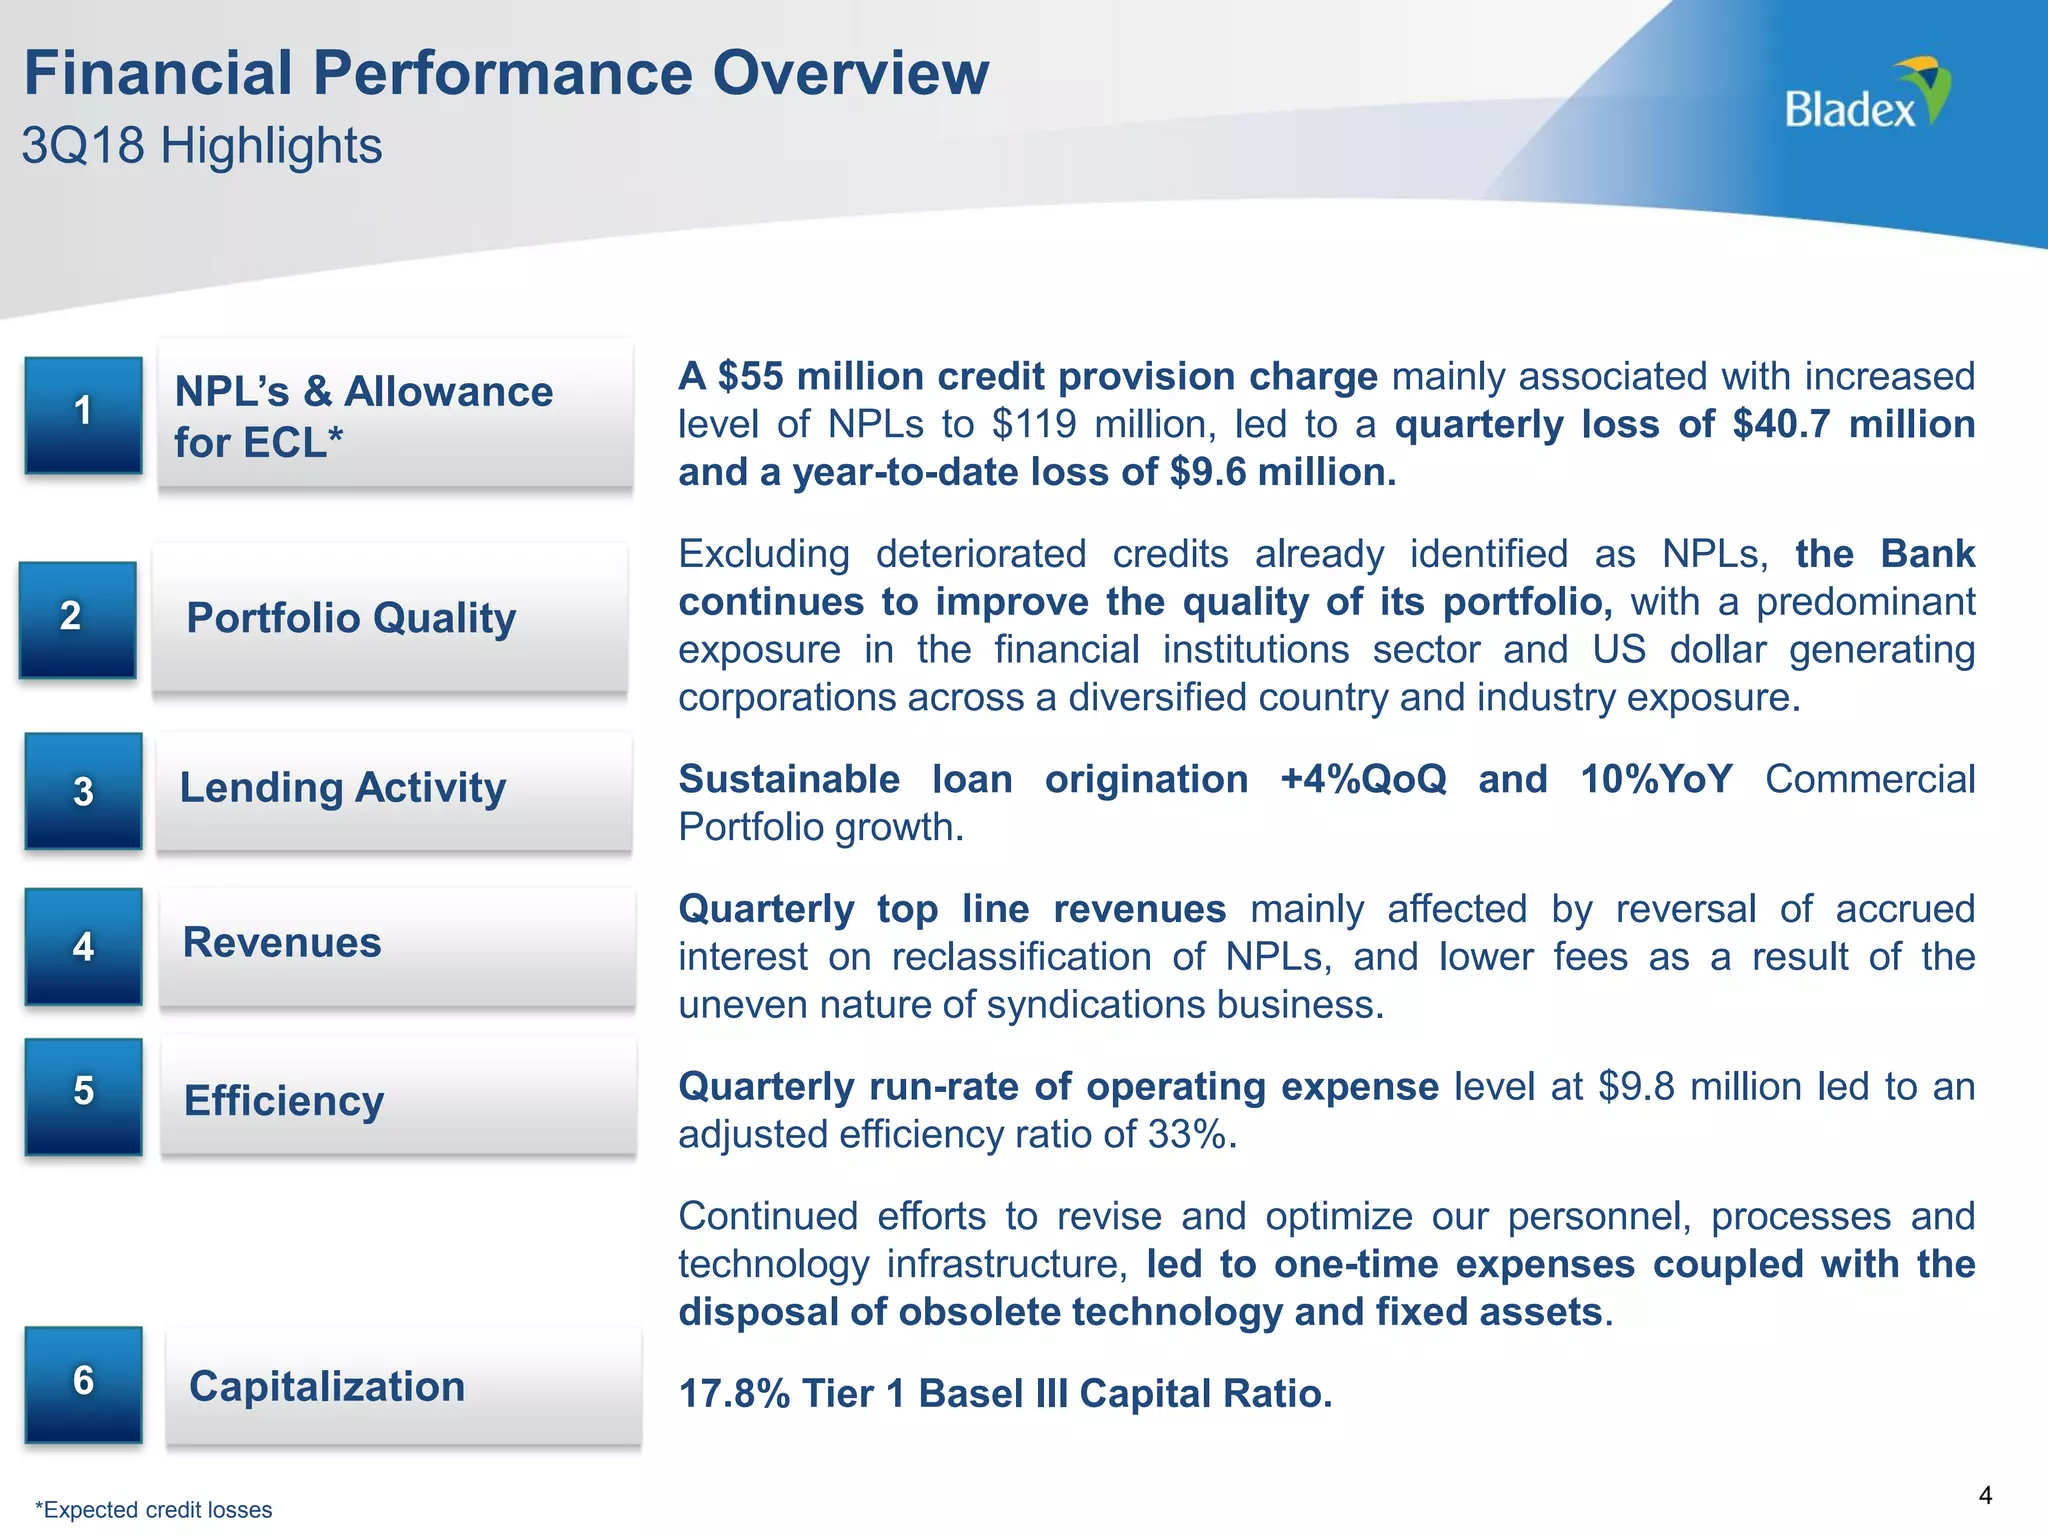
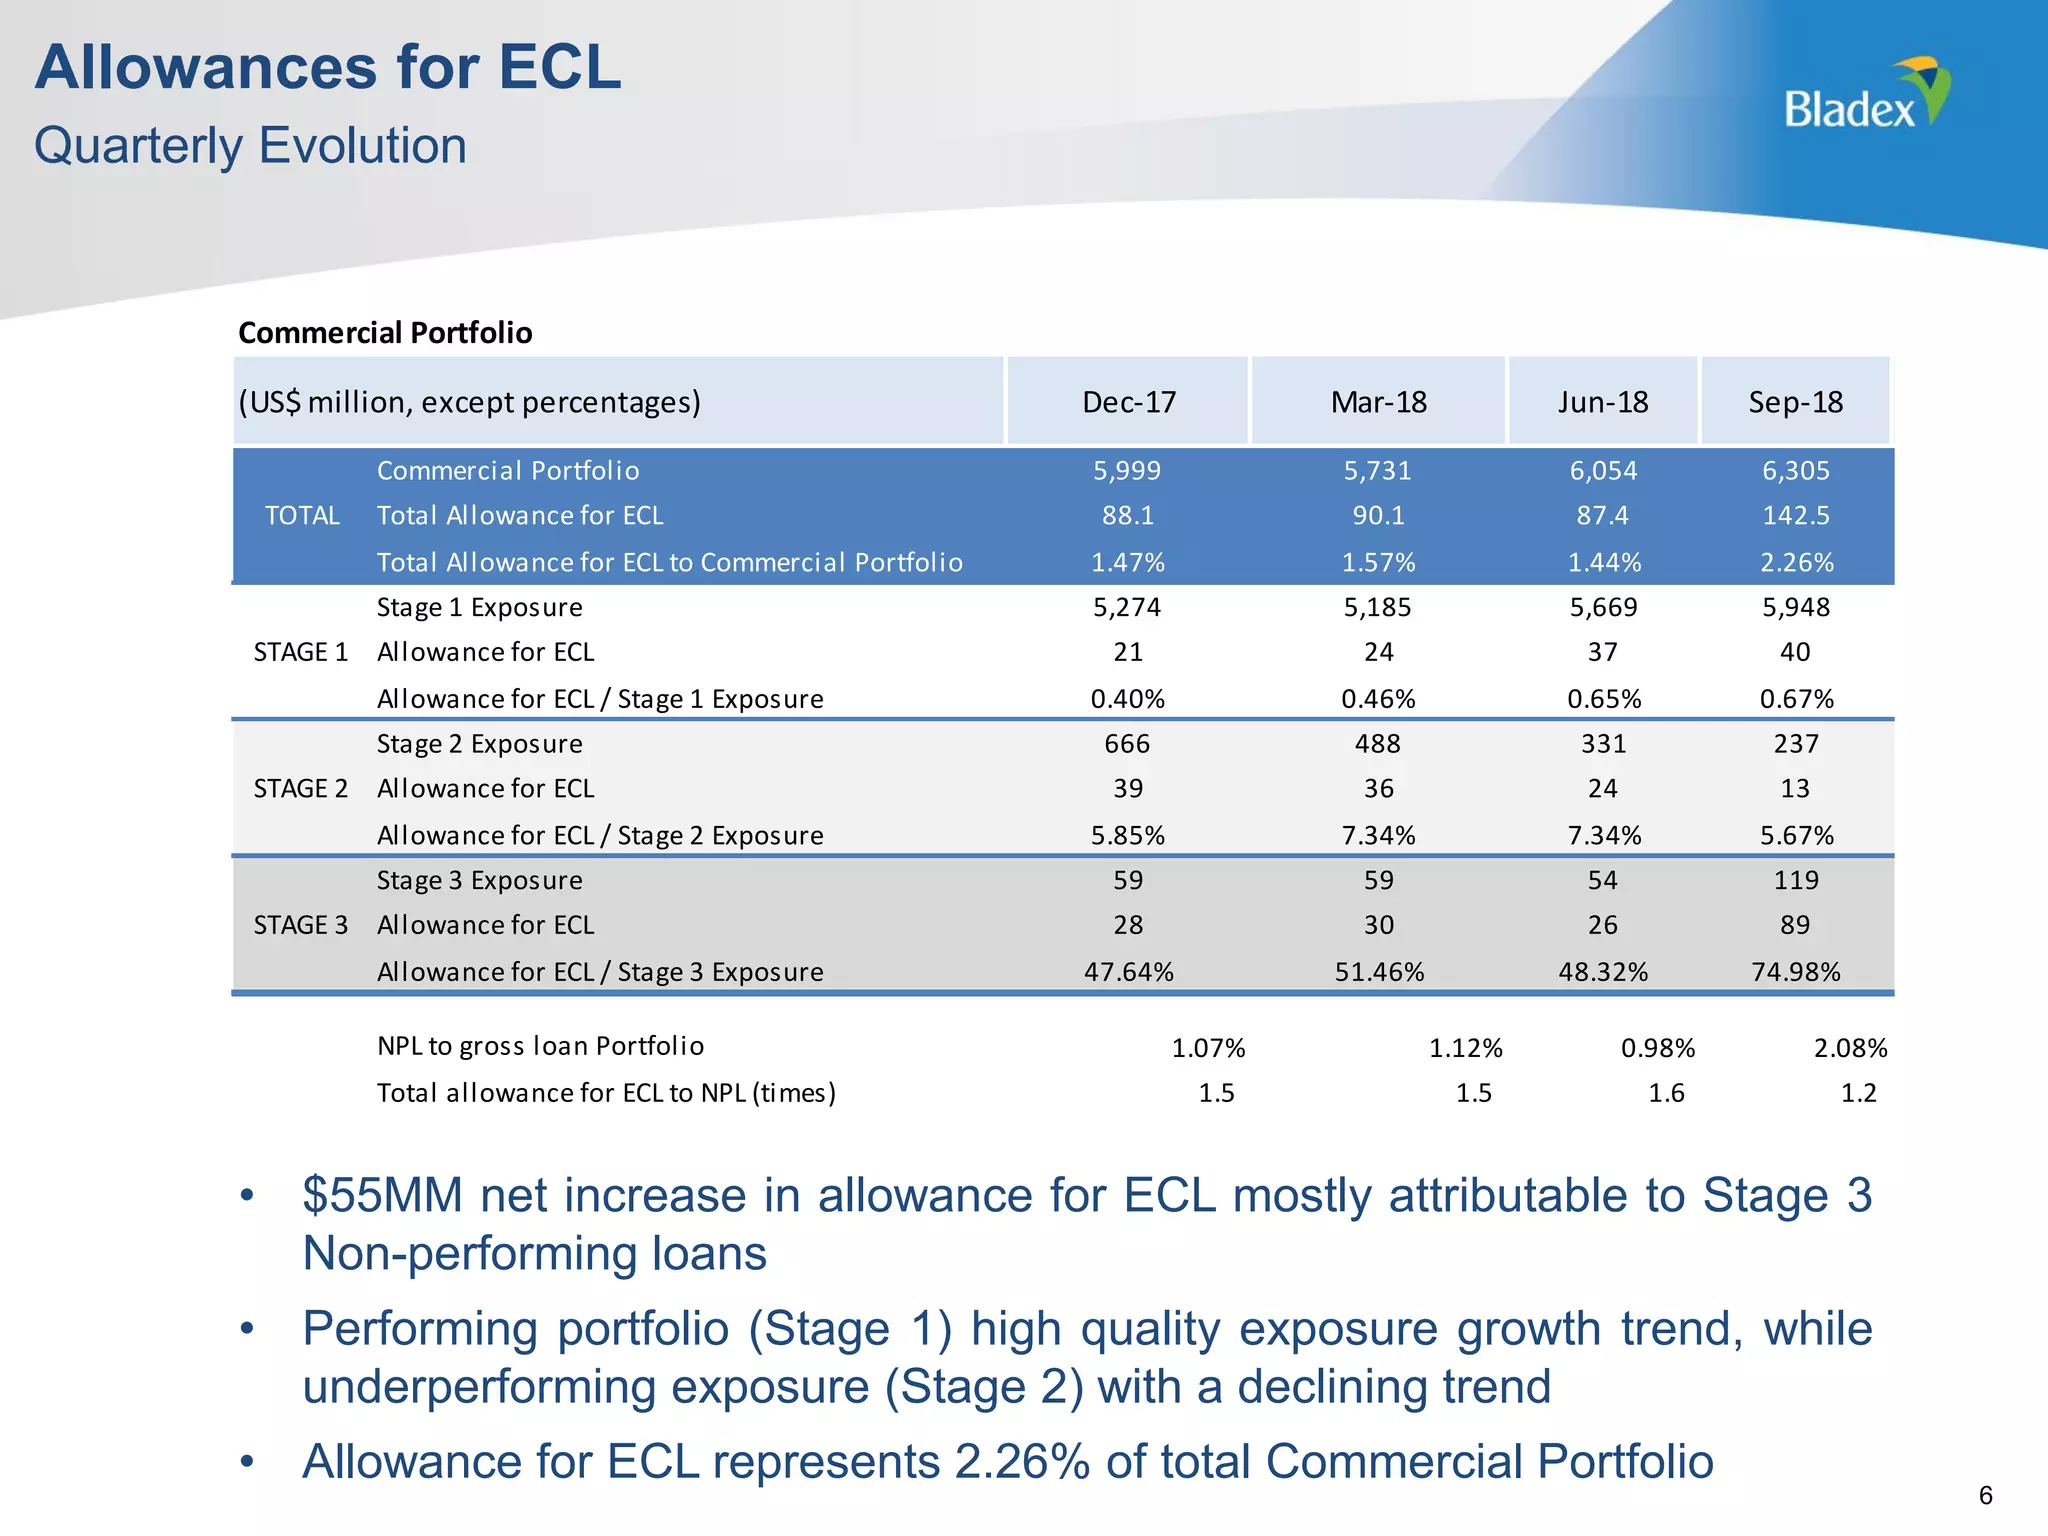
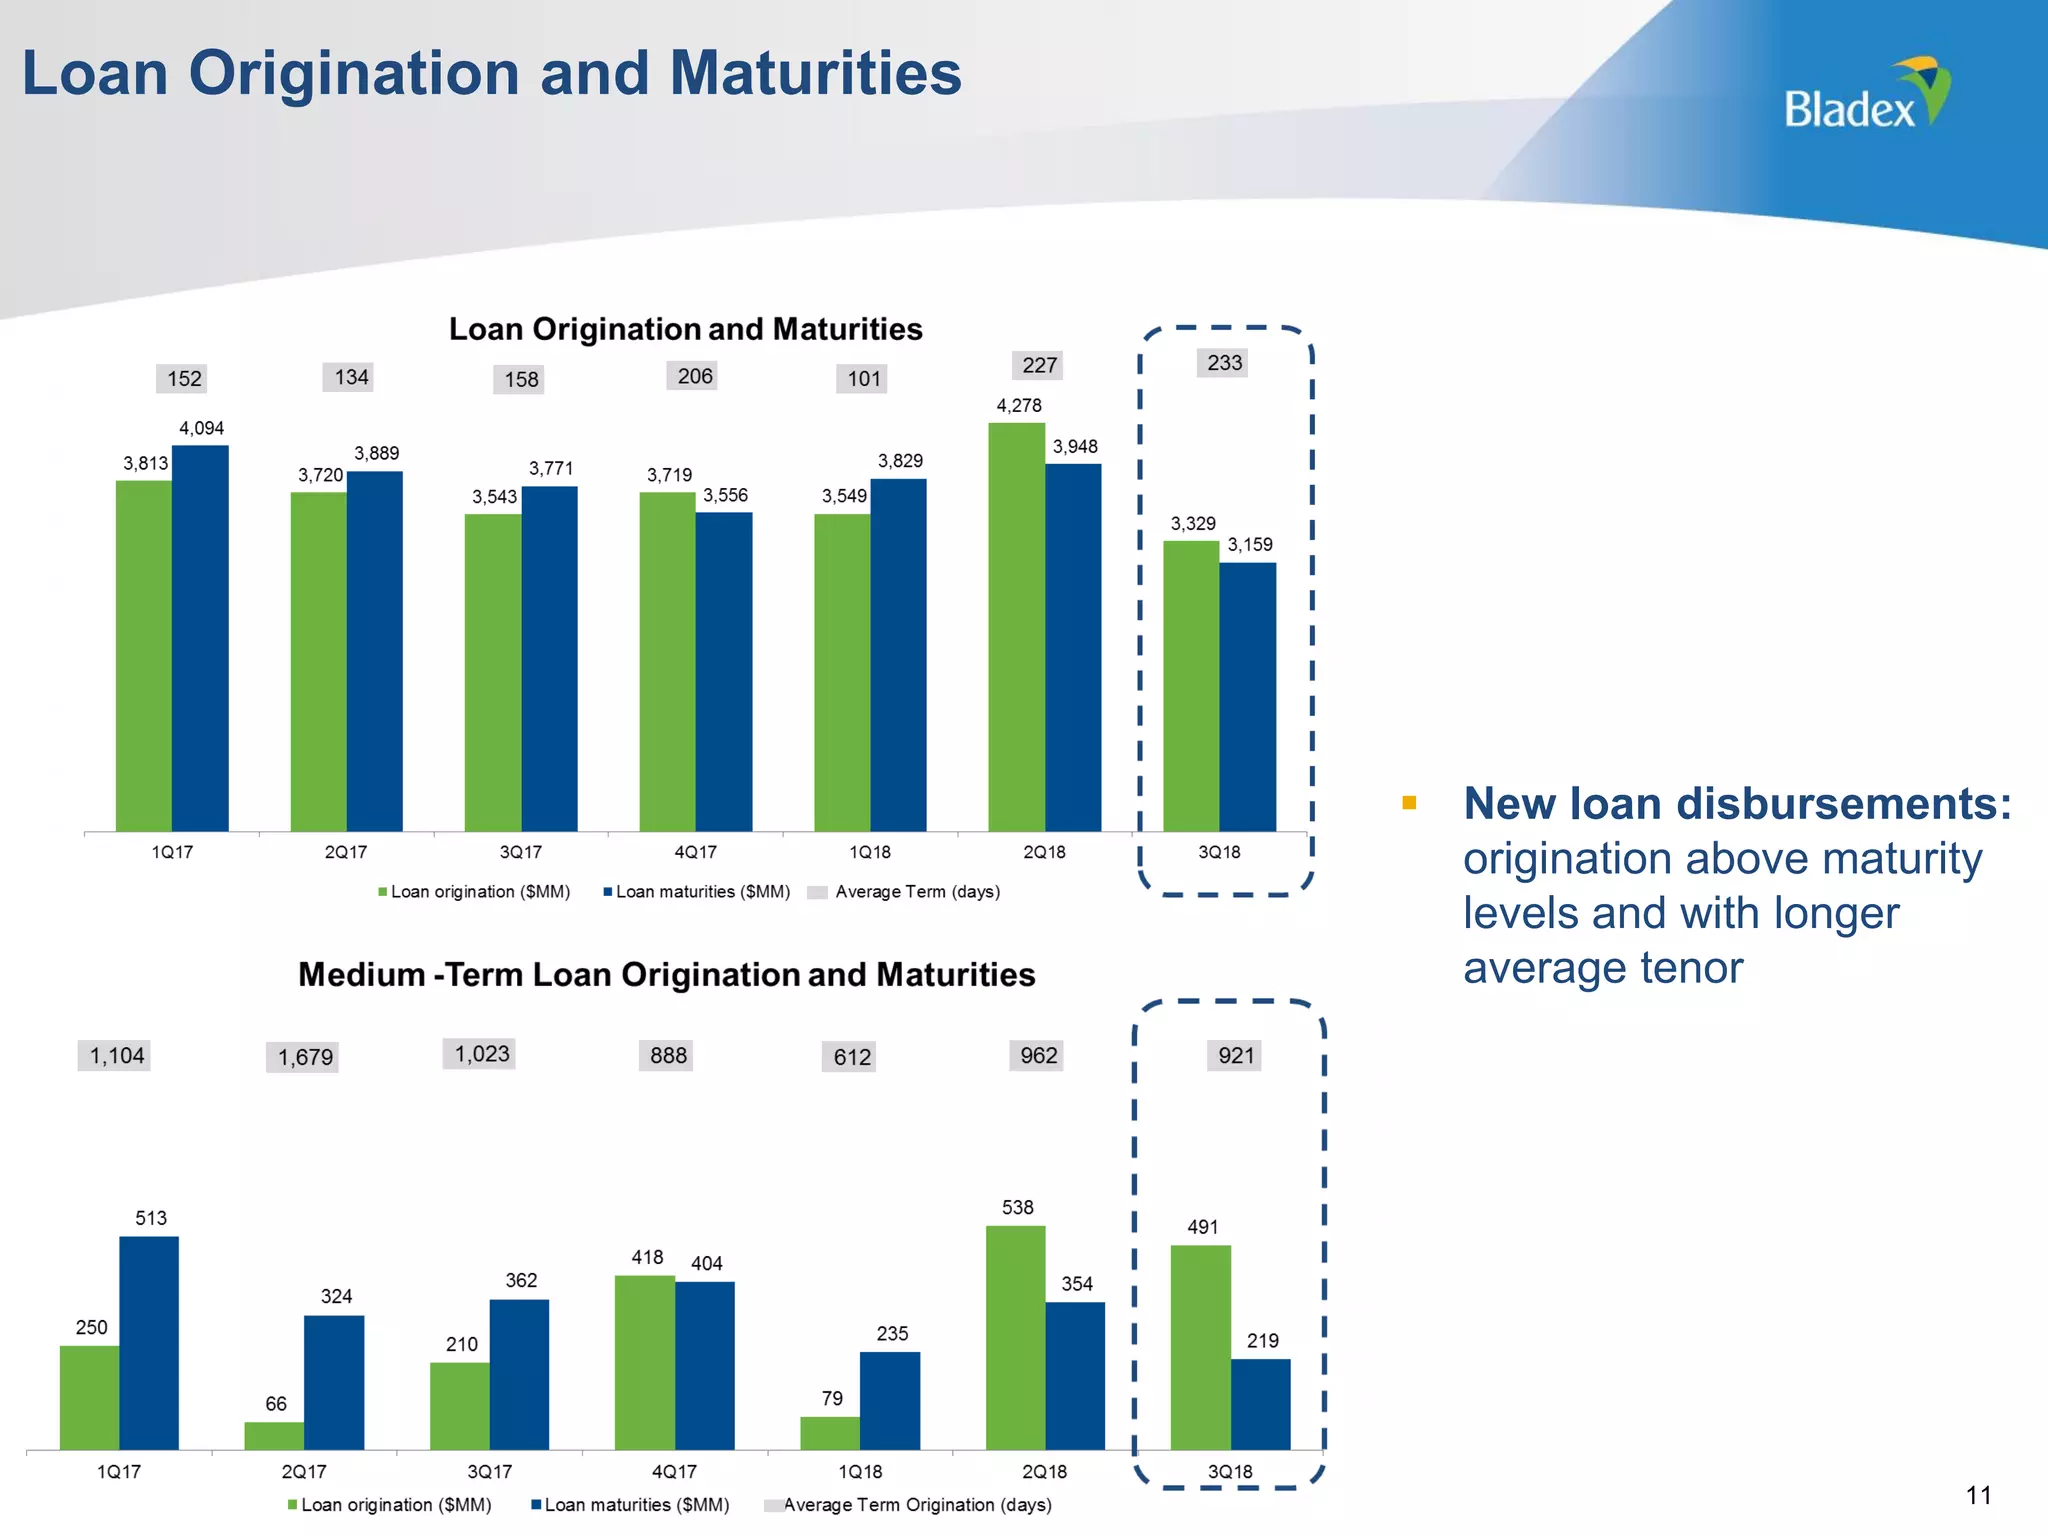
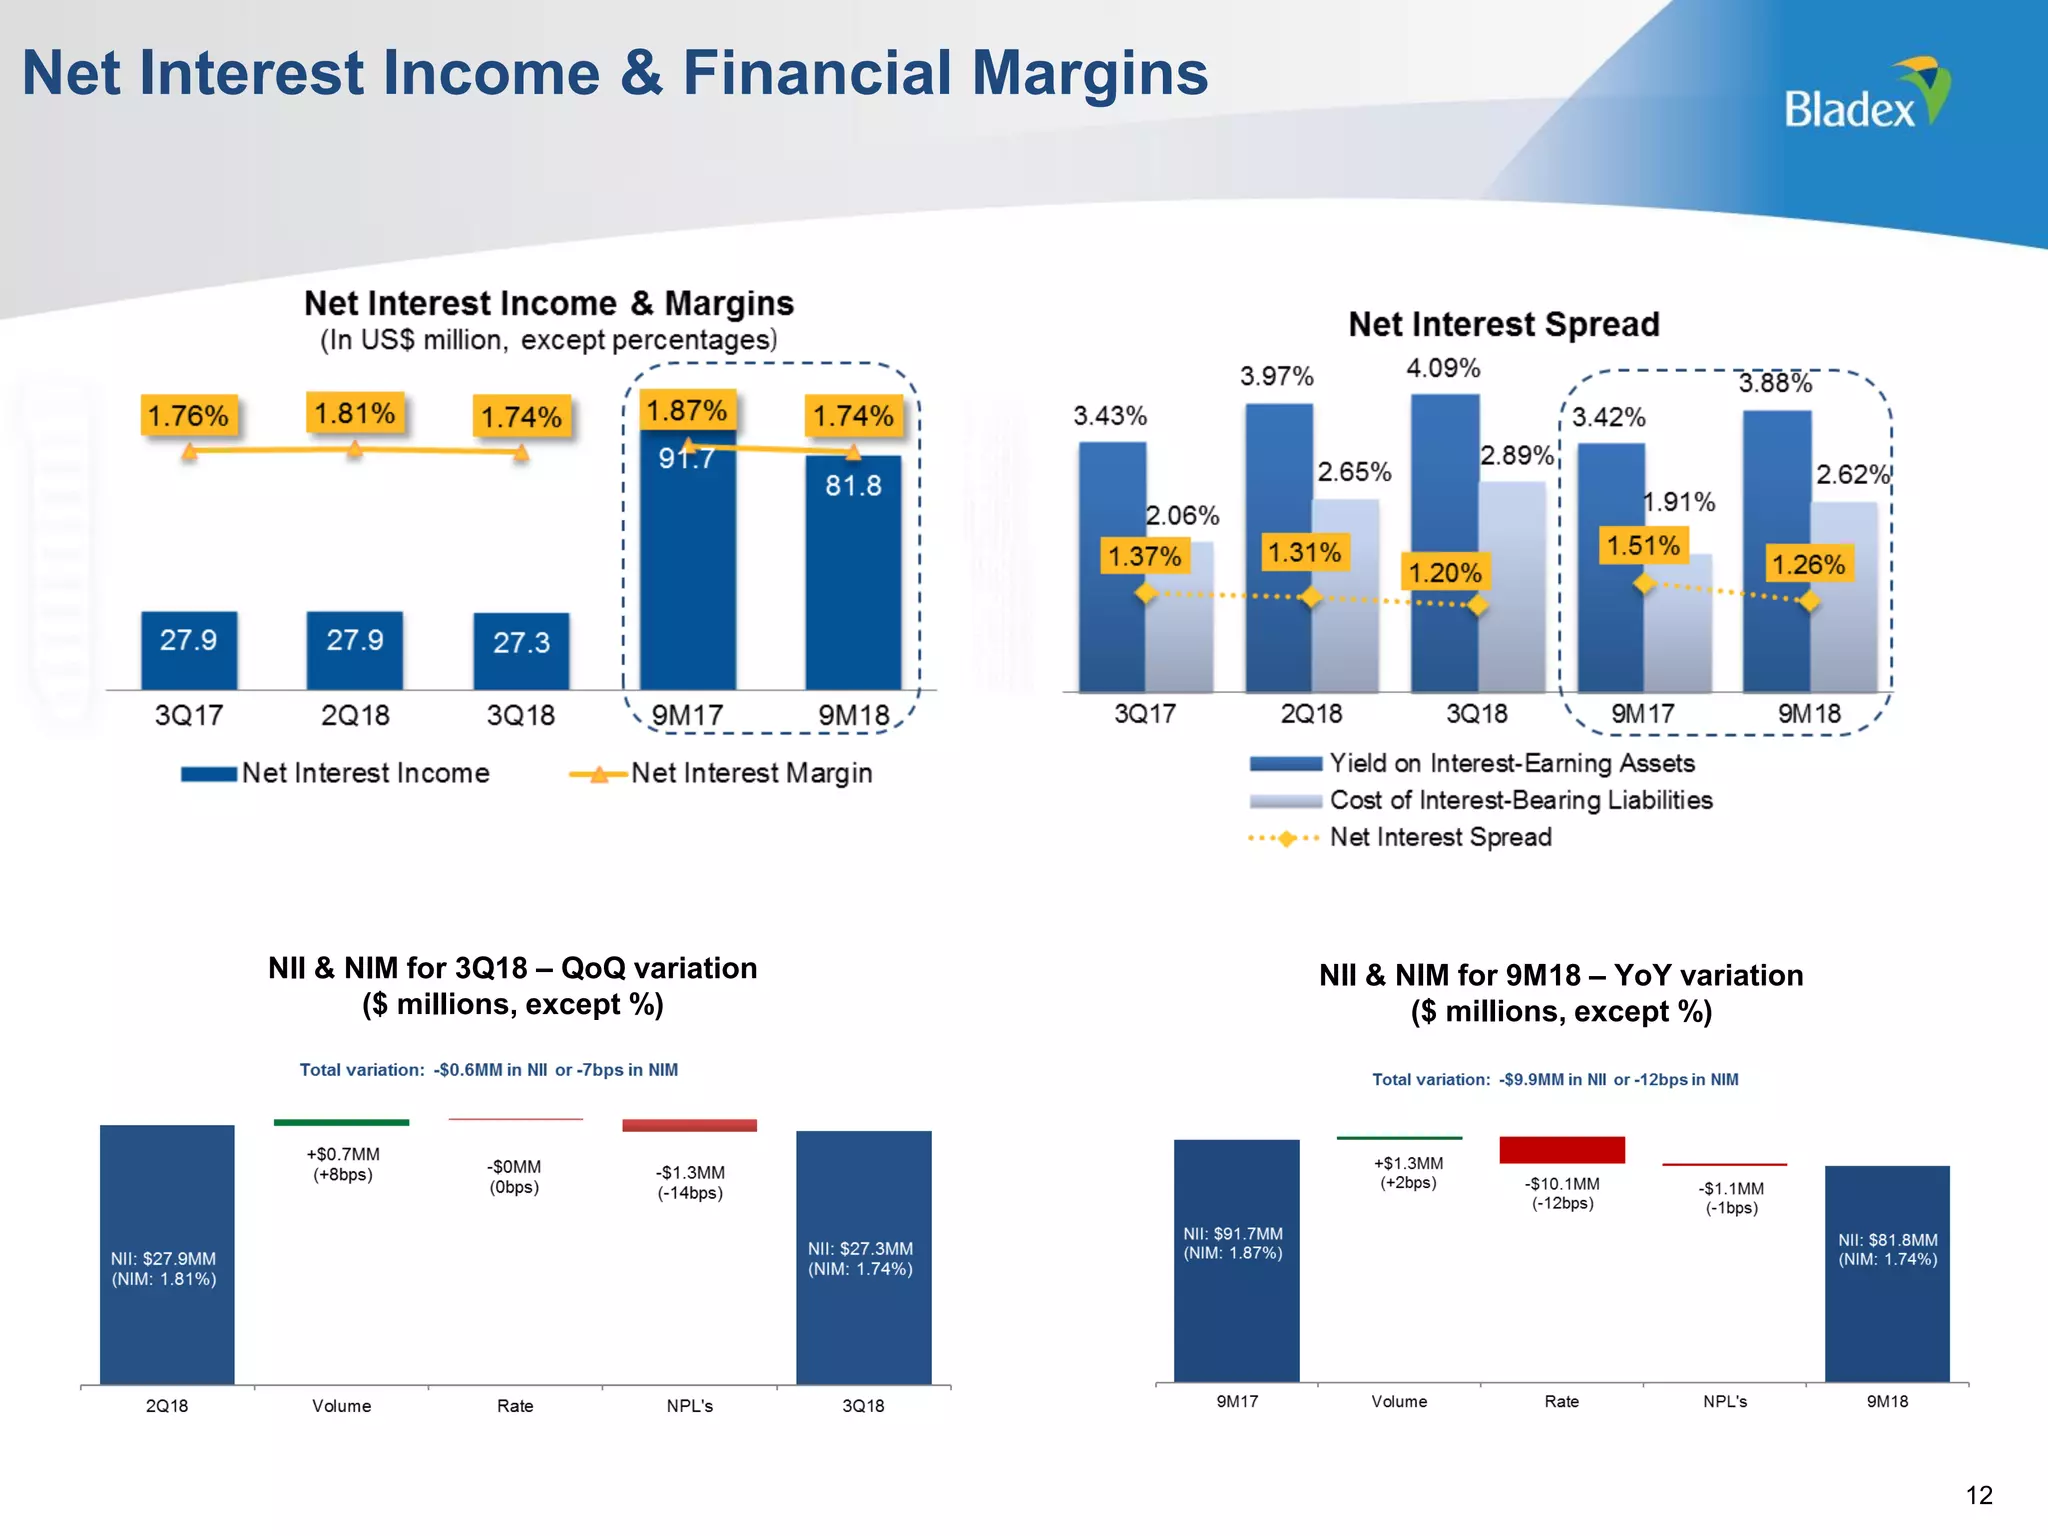
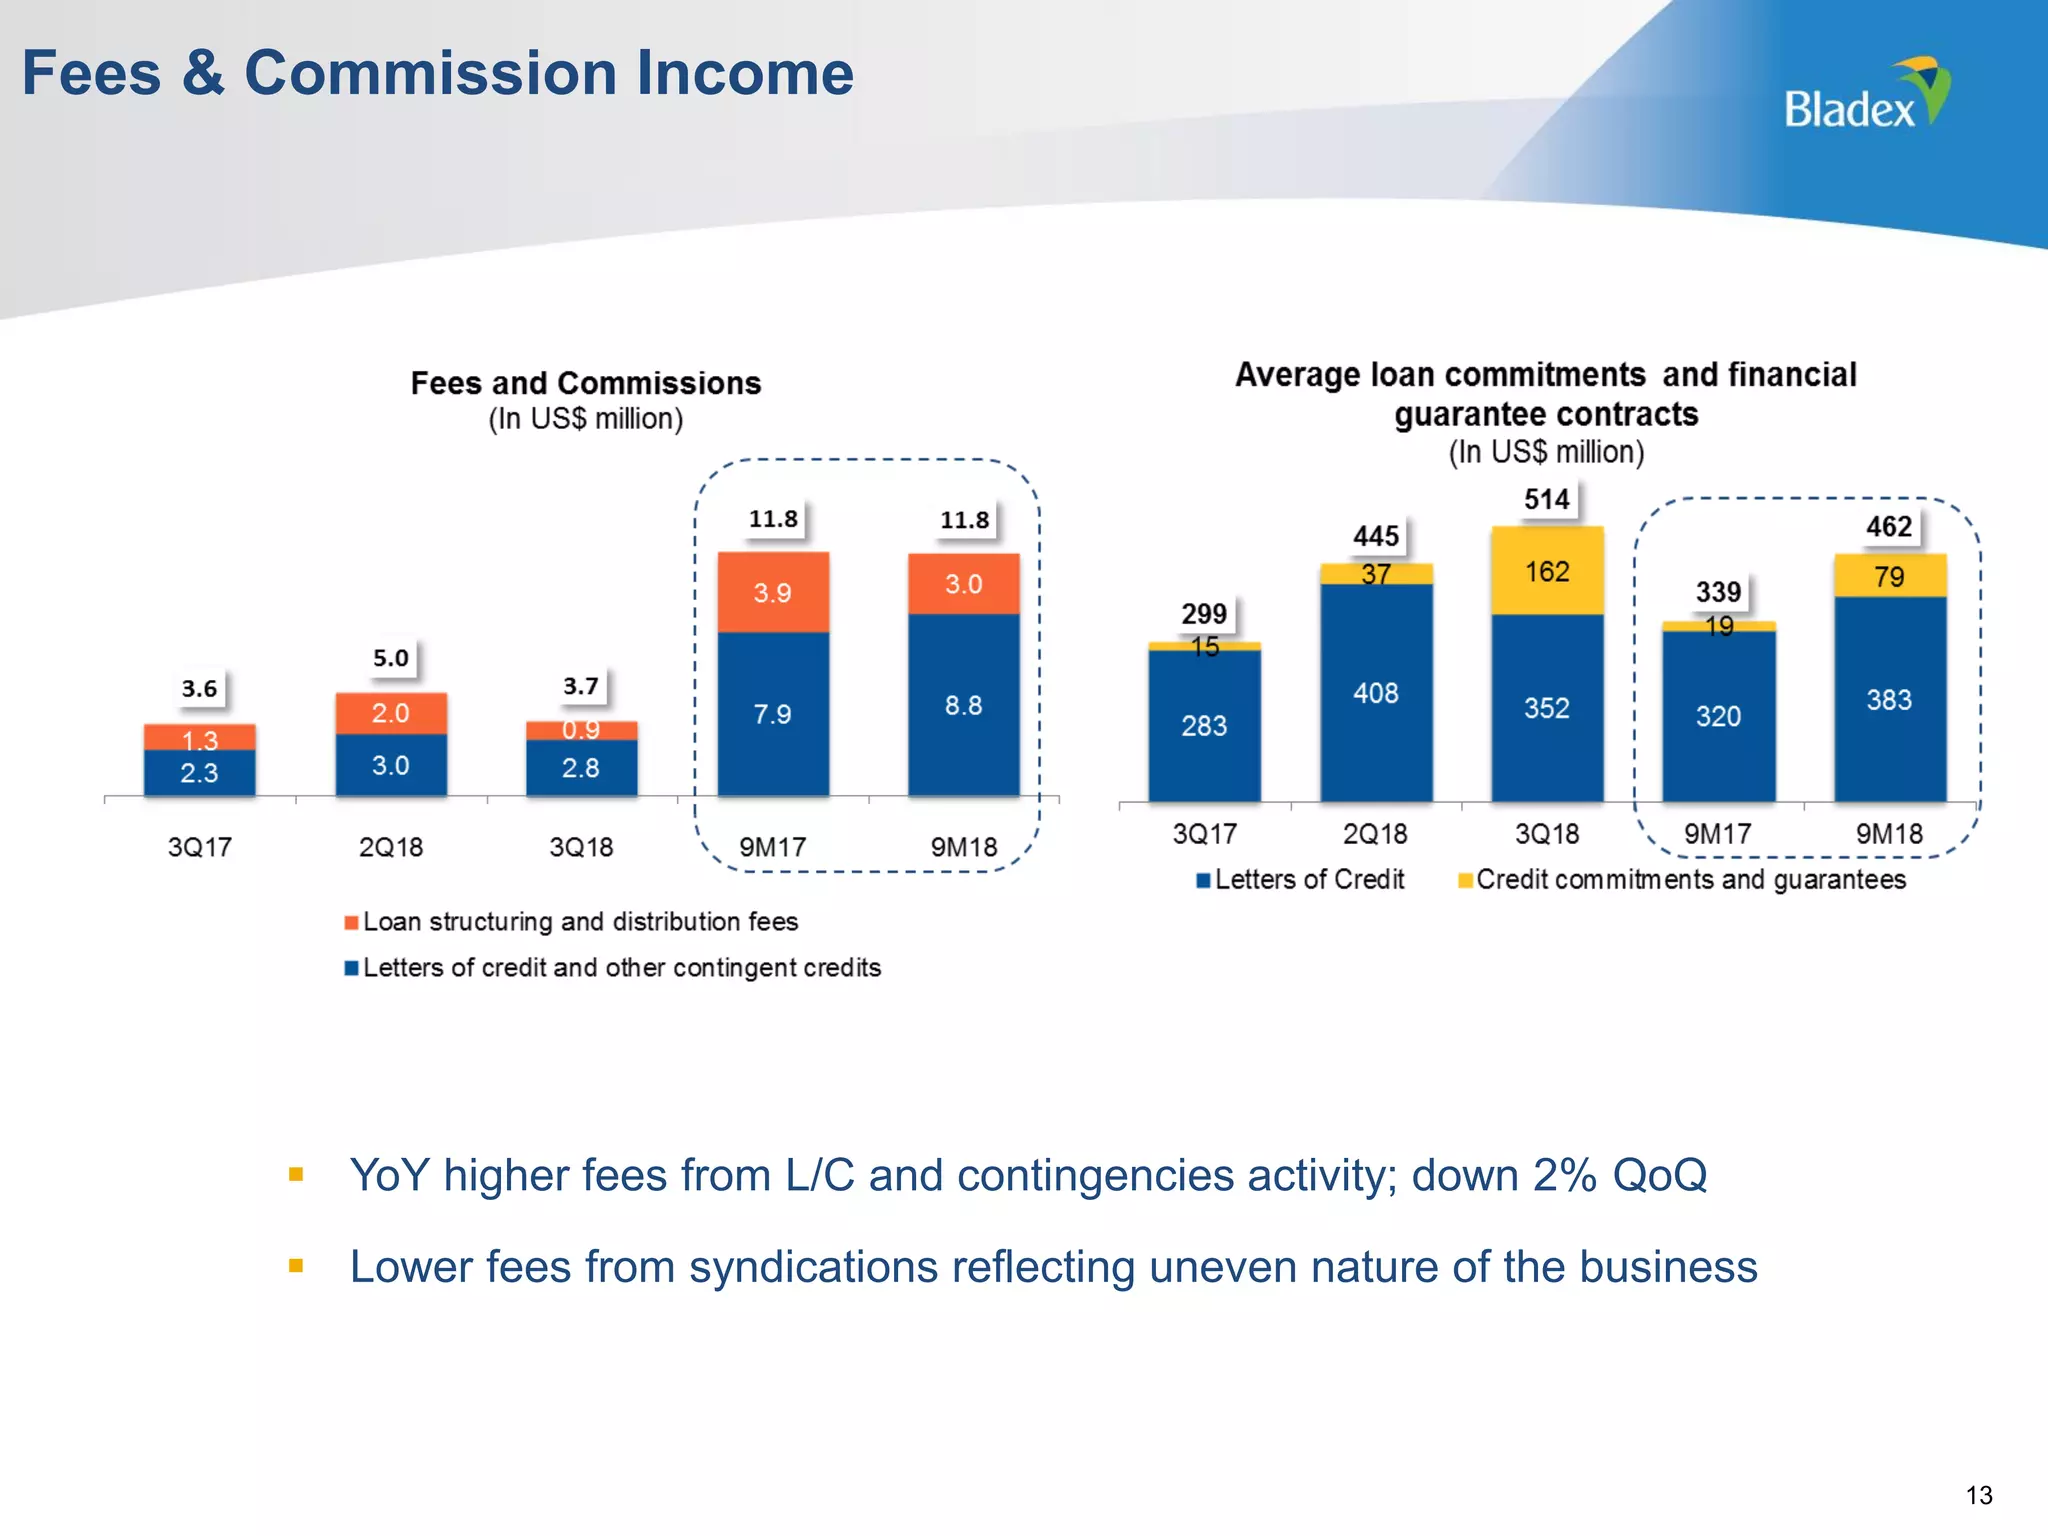
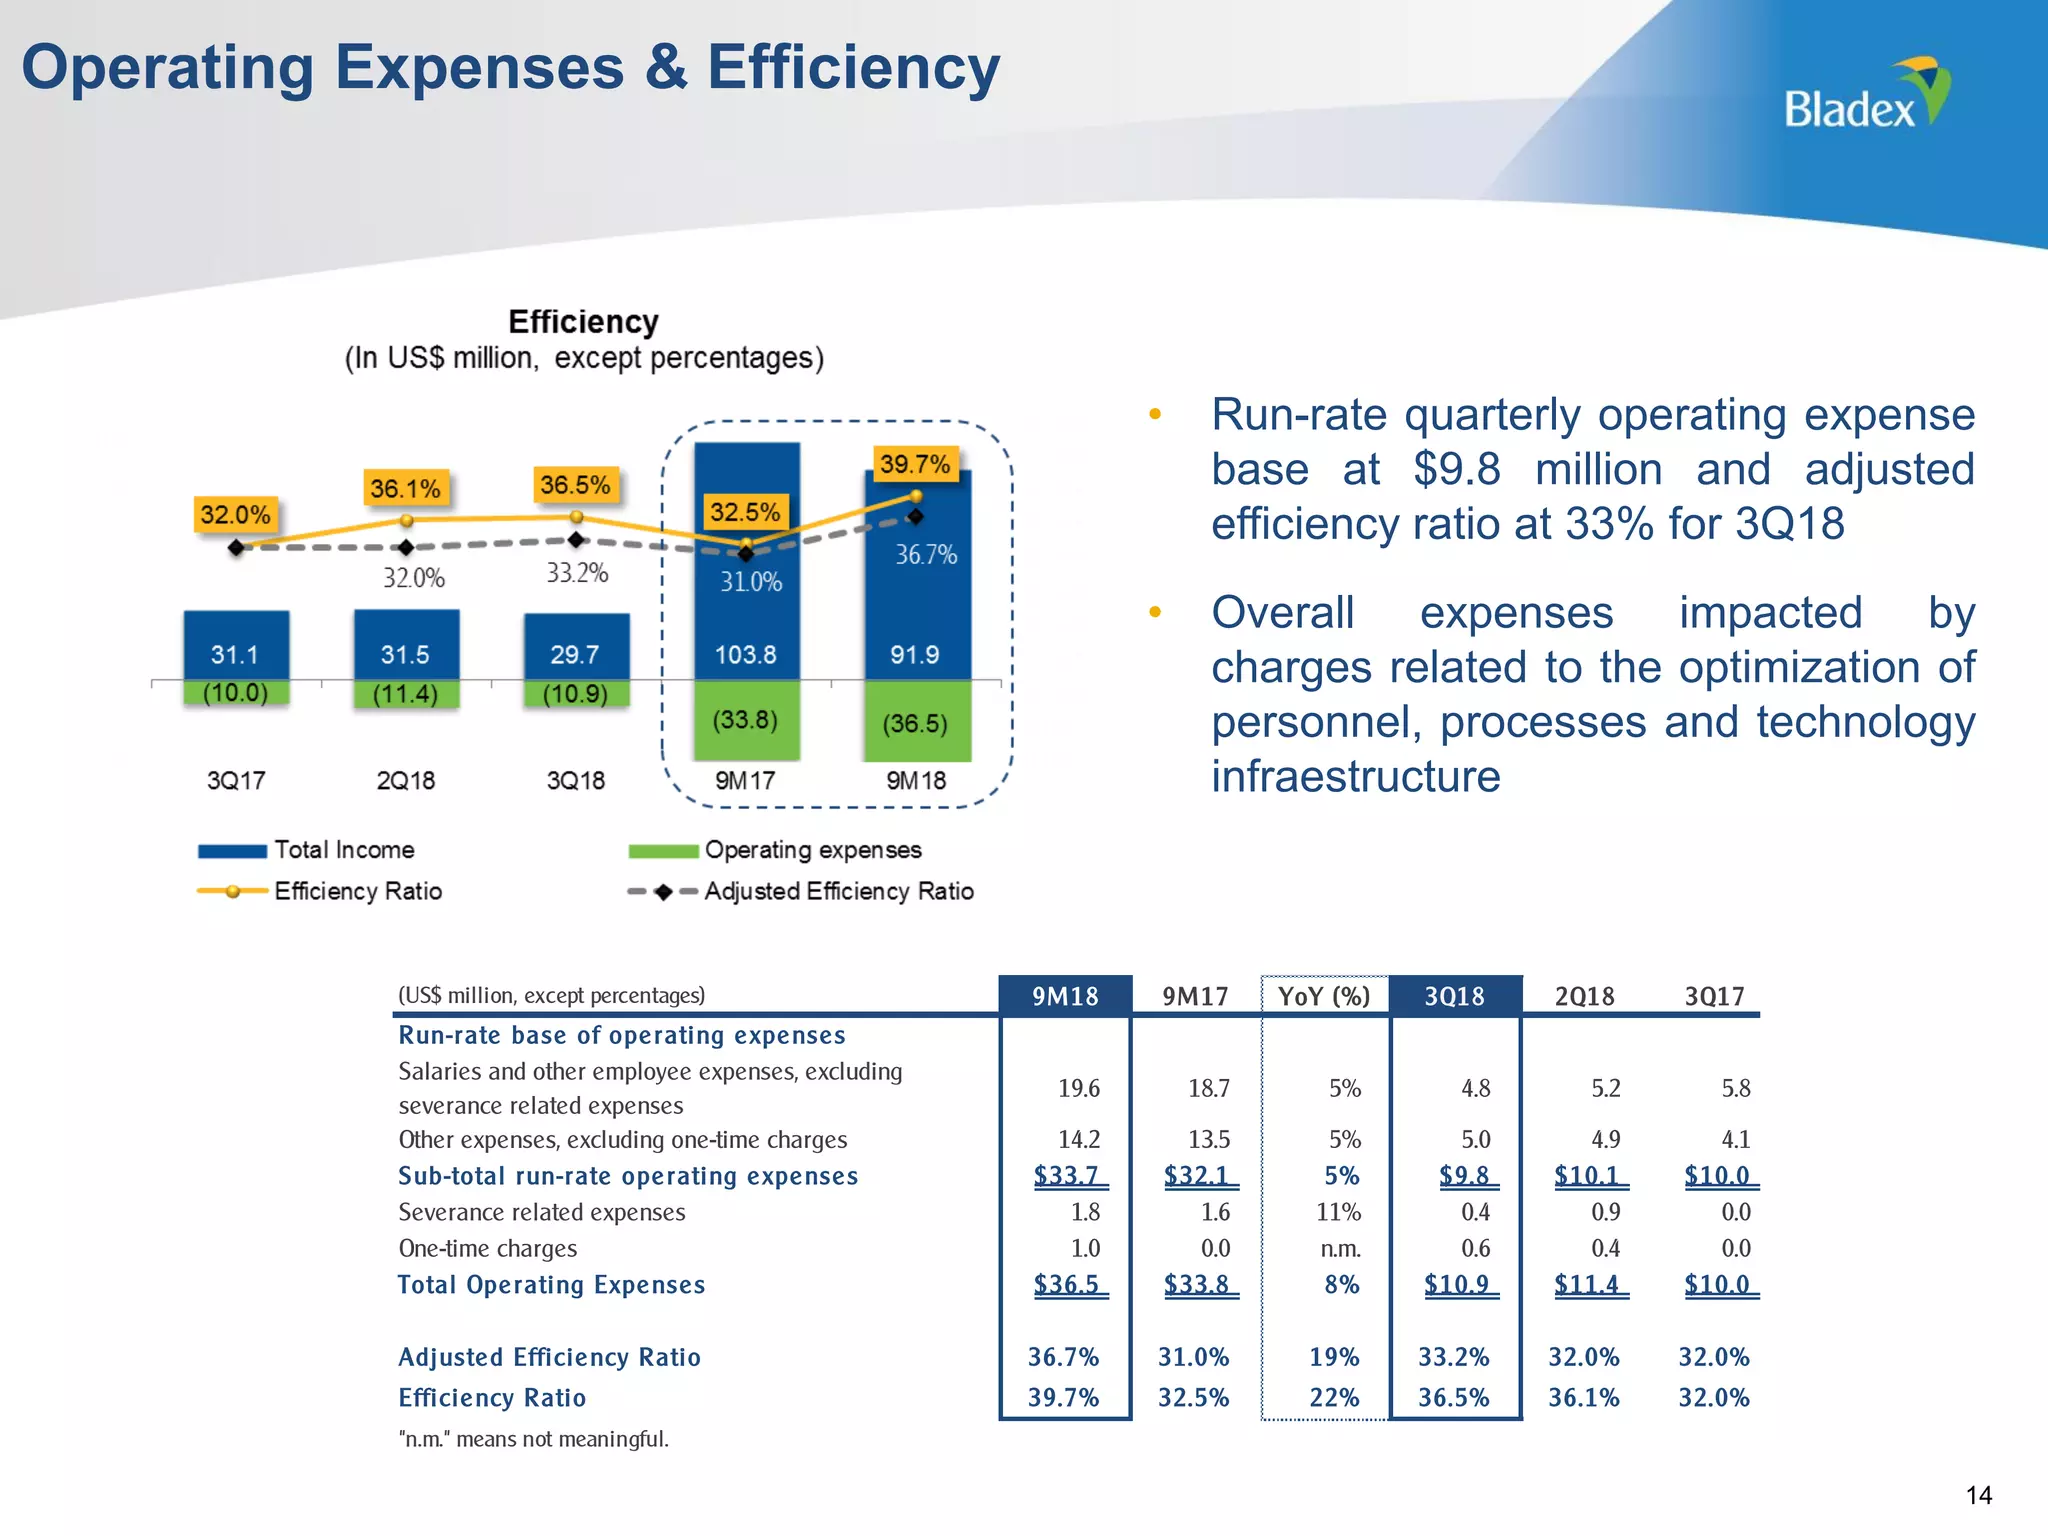
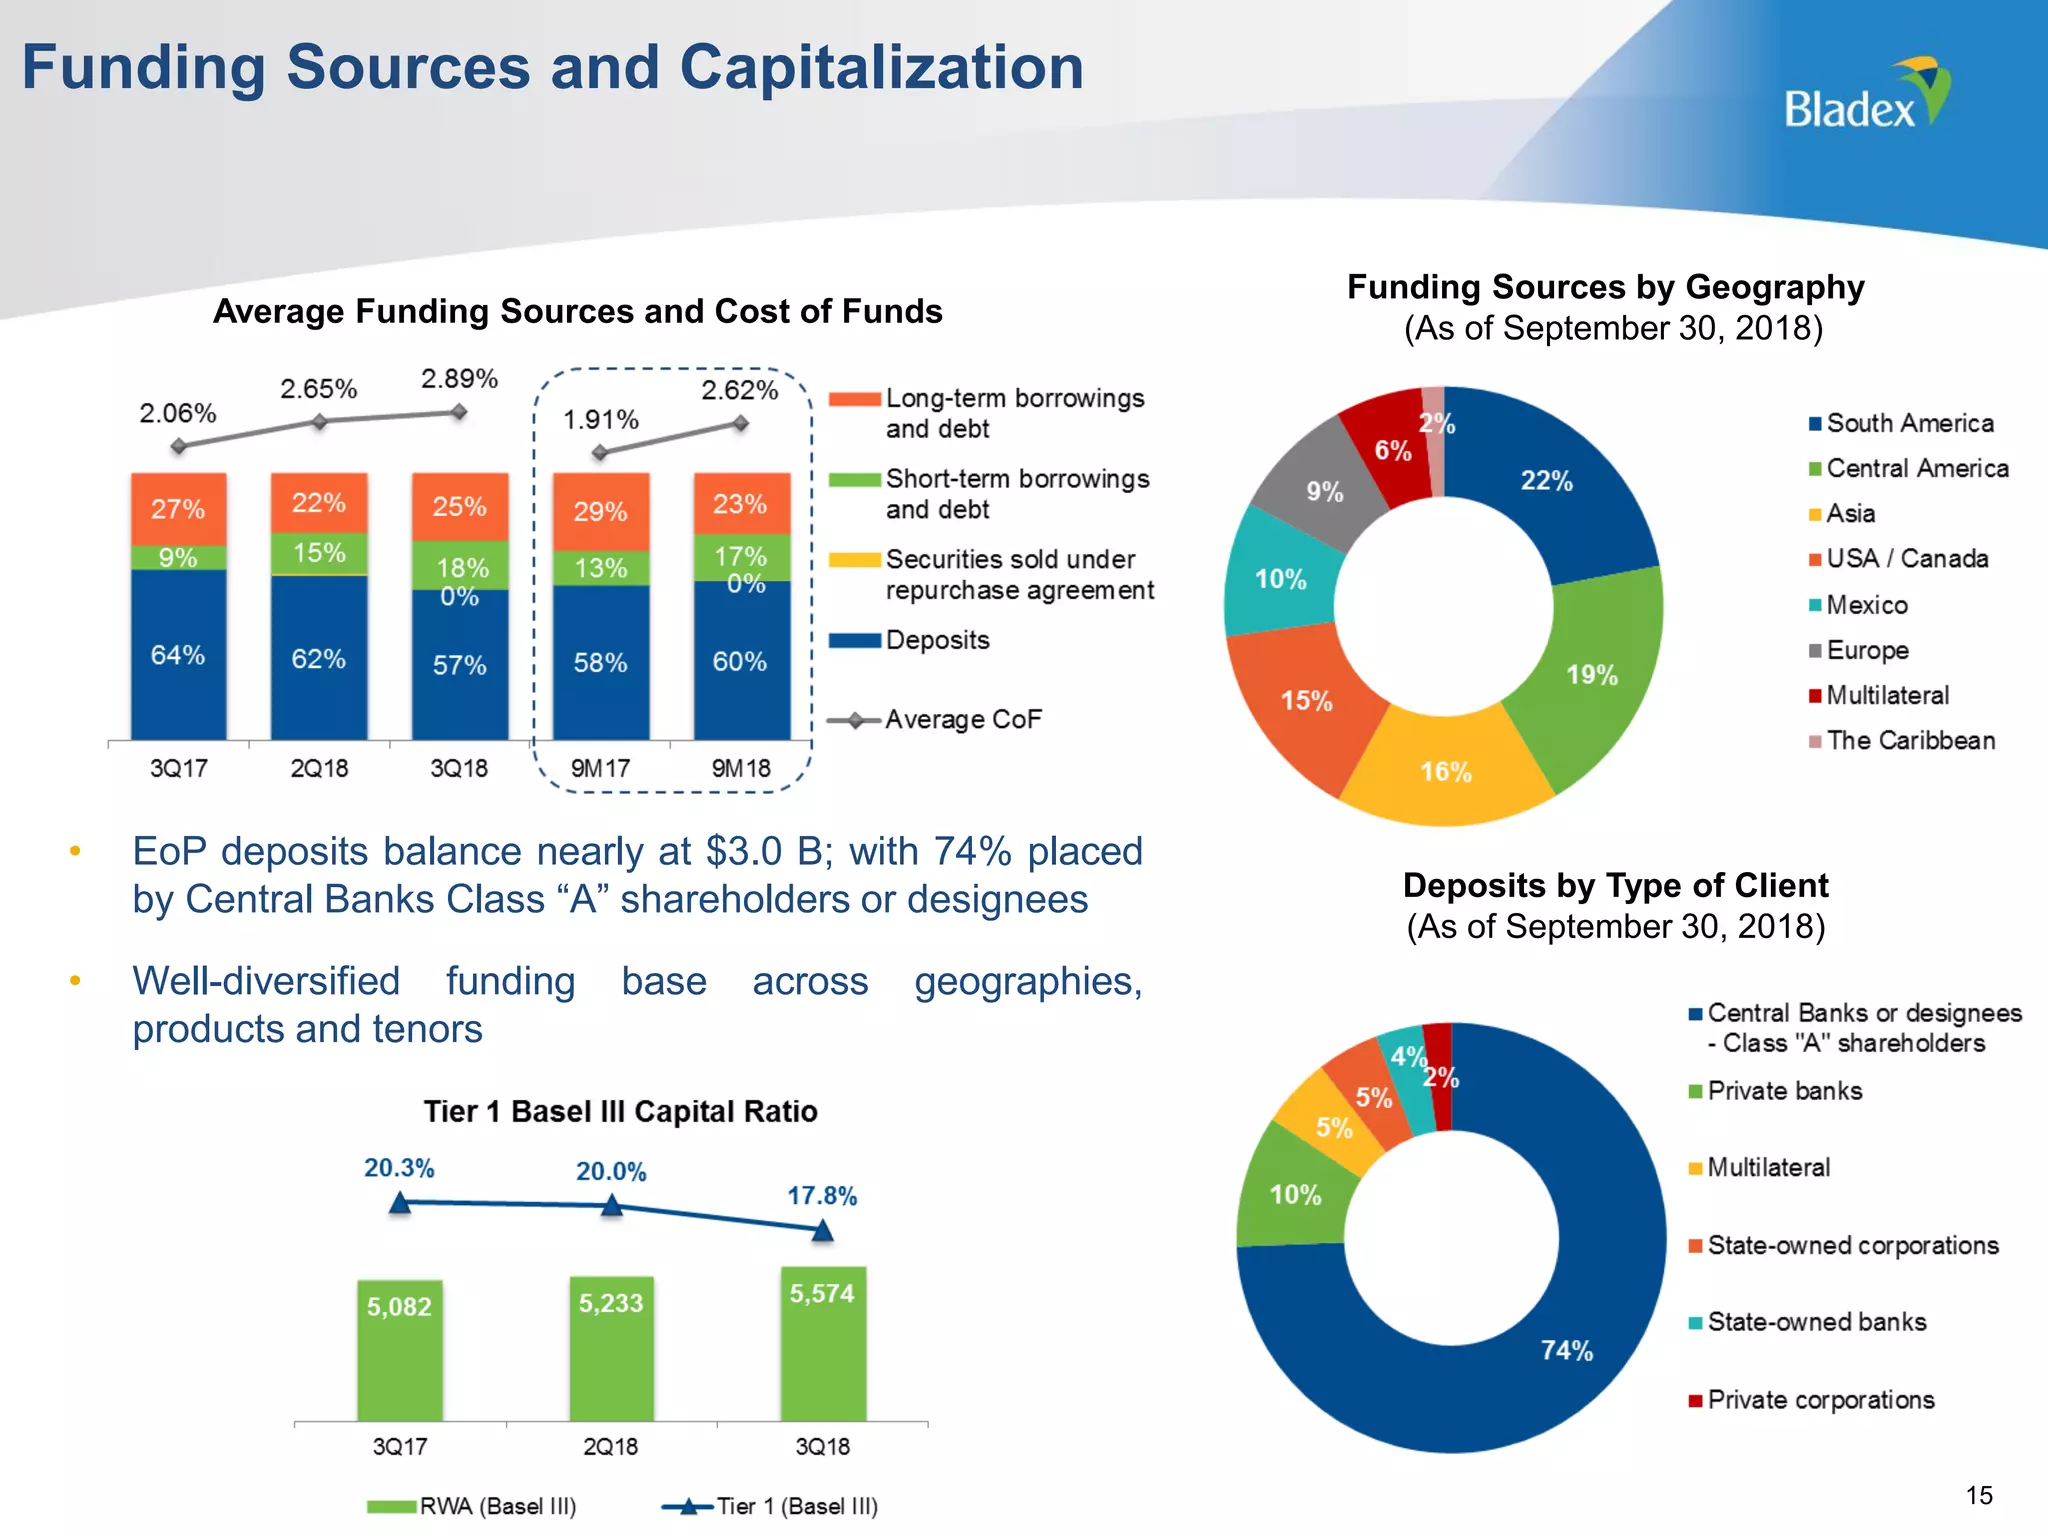


This presentation summarizes the bank's 3Q18 results. It saw a quarterly loss of $40.7 million due to a $55 million credit provision charge for increased non-performing loans (NPLs) of $119 million. Excluding already identified NPL credits, portfolio quality continues to improve. Loan origination grew 4% quarter-over-quarter and 10% year-over-year. Quarterly revenues were affected by lower accrued interest and fees. Operating expenses included one-time charges for optimization efforts. Capital ratios remained strong at 17.8% tier 1 Basel III capital ratio.


