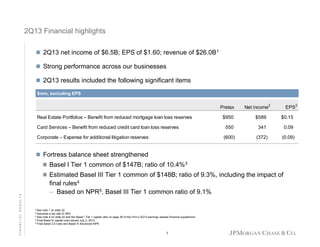
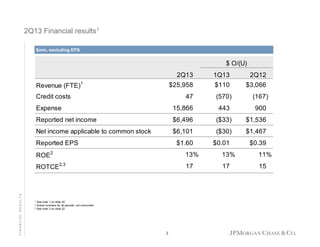
- JPMorgan Chase reported net income of $6.5 billion for 2Q13, with EPS of $1.60. Revenue was $26.0 billion.
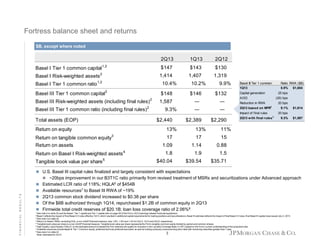
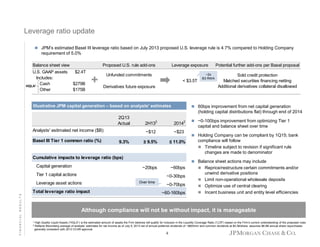
- Key business segments like Consumer & Business Banking and Mortgage Banking remained strong, while the company continued to strengthen its balance sheet.
- The company saw improvements in its Basel III Tier 1 common capital ratio to 9.3% and maintained solid returns on equity and assets.
JPMORGAN CHASE REPORTS THIRD-QUARTER 2013 NET LOSS OF $0.4 BILLION, OR $(0.17) PER SHARE, ON REVENUE1 OF $23.9 BILLION
THIRD-QUARTER 2013 NET INCOME OF $5.8 BILLION, OR $1.42 PER SHARE, EXCLUDING LITIGATION EXPENSE AND RESERVE RELEASES1
JPMorgan Chase reported second quarter 2013 net income of $6.5 billion, down from $5 billion in the second quarter of 2012. Revenue was $26 billion, up from $22.9 billion the prior year. Return on tangible common equity was 17%, up from 15% in 2012. Consumer & Community Banking saw deposit growth of 10% and record credit card sales volume of $105.2 billion, though net income fell to $3.1 billion due to lower revenue and higher expenses. Mortgage originations increased 12% to $49 billion while net income fell to $1.1 billion on lower revenue.
Retail Financial Services reported net income of $1.0 billion compared to $15 million in the prior year. Mortgage Banking and Other Consumer Lending net income was $364 million, up 55% year-over-year. The Investment Bank reported net income of $1.4 billion on revenue of $6.3 billion with a return on equity of 14%. Card Services reported net income of $343 million compared to a net loss of $672 million in the prior year, with credit costs down year-over-year.
JPMorgan Chase Second Quarter 2008 Financial Results Conference Callfinance2
JPMorgan Chase reported net income of $2.0 billion for Q2 2008, down 55% from the prior year. Earnings per share were $0.54. While several businesses saw growth, losses increased significantly in the mortgage and credit card portfolios, and markdowns were taken on leveraged loans and mortgage-related positions. The firm also completed its acquisition of Bear Stearns during the quarter.
JPMorgan Chase First Quarter 2008 Financial Results Conference Call finance2
JPMorgan Chase reported net income of $2.4 billion for the first quarter of 2008, down 49% from $4.8 billion in the first quarter of 2007. Earnings per share were $0.68, down from $1.34 the previous year. The Investment Bank saw declines in revenue and increases in credit losses. Retail Financial Services increased revenue but also significantly increased its provision for credit losses due to deterioration in home equity and subprime portfolios. JPMorgan Chase maintained a strong capital position despite challenges in the market and credit environment.
The Case for AAA Underlying Municipal Bondsmauiwelch
This document provides an overview of the municipal bond market and makes a case for investing in bonds with underlying AAA credit ratings from states and municipalities. It notes that there is currently limited supply of bonds directly rated AAA. The strategy proposed is to create a portfolio of only AAA-rated underlying bonds to take advantage of their strong credit quality and limited supply. Key data on default rates and credit fundamentals are presented for AAA-rated states and municipalities to demonstrate the historically strong credit performance of these issues.
The Bank of New York Mellon Fourth Quarter 2008 Financial Resultsearningsreport
The Bank of New York Mellon Corporation reported earnings per share of $0.05 for the fourth quarter of 2008, down from $0.61 in the fourth quarter of 2007. Revenue was impacted by $1.24 billion in securities write-downs due to deteriorating market conditions. Expenses were well-controlled despite a $181 million restructuring charge. The company maintained strong capital ratios with Tier 1 capital at 13.1% as of December 31, 2008.
JPMorgan Chase reported third quarter 2010 net income of $4.4 billion. Key highlights included a $930 million reduction to loan loss reserves in card services and increases of $776 million and $622 million to litigation and mortgage repurchase reserves, respectively. Several business segments reported solid results, with the investment bank ranked number one for the year in global fees and the retail bank seeing increased mortgage production and deposit margins. Credit costs declined across most businesses from reduced net charge-offs.
AIG Second Quarter 2008 Earnings Press Releasefinance2
- AIG reported a net loss of $5.36 billion for Q2 2008 compared to net income of $4.28 billion in Q2 2007. The losses were driven by unrealized market valuation losses on credit default swaps and other-than-temporary impairment charges.
- For the first six months of 2008, AIG's net loss was $13.16 billion compared to net income of $8.41 billion in the first six months of 2007.
- AIG raised $20 billion in capital through the issuance of common stock, equity units, and fixed maturity securities to strengthen its financial capacity.
- The document provides financial results for HSBC Finance Corporation for the first half of 2008.
- Key highlights included a loss before tax of $1.2 billion due to higher loan impairment charges of $3 billion, partially offset by lower operating expenses.
- Delinquency ratios continued to increase across most product lines as the housing market declined and unemployment rose.
- Actions were taken to reduce risks and position businesses for the future, including selling certain units and tightening underwriting.
Ladder Capital - Investor Presentation (June 2021)David Merkur
Ladder Capital Corp is a leading commercial real estate investment trust that provides CRE capital through loans, securities, and equity. It has a national direct origination platform and $5.4 billion in assets. The presentation discusses Ladder's competitive strengths, including its CRE credit underwriting expertise, diversified asset base, best-in-class capital structure with modest leverage, and experienced management team. Ladder has improved its leverage and liquidity significantly over the last year and is well positioned for growth with a sizable investment pipeline.
BB&T reported 2008 net income of $1.5 billion and earnings per common share of $2.71. For the fourth quarter of 2008, net income totaled $305 million and net income available to common shareholders totaled $284 million, or $.51 per diluted common share. For the full year 2008, BB&T's net income available to common shareholders was $1.50 billion compared to $1.73 billion earned in 2007, a decrease of 13.6%.
Sovereign Bancorp reported financial results for the fourth quarter and full year of 2007. For Q4, the company reported a net loss of $1.6 billion compared to a net loss of $129 million in Q4 2006, primarily due to goodwill impairments. For the full year, Sovereign reported a net loss of $1.3 billion compared to net income of $137 million in 2006. The company is taking steps to strengthen its capital position such as discontinuing its dividend and reducing expenses. Sovereign's non-performing loans increased and net interest margin expanded in Q4.
Ladder Capital - Investor PresentationDavid Merkur
Ladder Capital Corp is a leading commercial real estate investment trust with $5.4 billion in assets and $1.5 billion in book equity. It has a national direct origination platform and focuses on originating middle-market CRE loans, investing in CRE securities, and acquiring net leased properties. It has a diversified and granular portfolio, with significant unrestricted cash and a conservative capital structure with modest leverage net of cash.
BGC Partners presented at an investor conference in June 2013. The presentation discussed BGC's forward-looking statements and provided an overview of the company's business segments and financial performance. It noted that BGC has two business segments - Financial Services and Real Estate Services - and that it aims to grow through hiring, acquisitions, and expanding its fully electronic trading platform. The presentation also provided details on BGC's recent sale of its eSpeed business to NASDAQ OMX and outlined its plans for using the sale proceeds.
Ladder Capital - Q1 2021 Earnings Supplemental PresentationDavid Merkur
Ladder Capital Corp provides a snapshot of its business lines as of Q1 2021, including total assets, liabilities, book equity, and leverage metrics. The largest segments are balance sheet loans ($2.0B carrying value), commercial real estate owned ($634M carrying value), and securities ($764M carrying value). The company has a diversified portfolio across various property types and geographies. Book equity totaled $1.5B with an undepreciated book value per share of $13.88. Leverage was modest at an adjusted debt to equity ratio of 2.3x.
The document is an investor presentation for Banc of California's second quarter 2017 earnings. It summarizes key actions taken in the second quarter to reposition and de-risk the balance sheet, including selling securities, reducing brokered deposits, and selling loans. It also discusses expense reduction initiatives that lowered operating expenses. While loan production was strong, asset sales offset loan growth for the quarter. Overall, the company continued improving credit metrics and capital ratios while focusing on future loan and deposit growth.
- Bank of America reported a net loss of $1 billion for Q3 2009, driven by $3 billion in pre-tax charges and a $402 million charge to terminate an asset guarantee.
- Capital levels and liquidity improved, with the Tier 1 capital ratio rising to 12.46% and cash/equivalents totaling over $152 billion.
- Deposit growth continued with average retail deposits up $7.8 billion, while mortgage banking income declined on lower production volumes.
- Credit costs remained elevated though losses showed signs of stabilizing, with nonperforming assets up 9% compared to 21% in Q2 2009.
This document provides an investor presentation by BGC Partners, Inc. for June 2013. It discusses forward-looking statements and risks, financial metrics such as distributable earnings and adjusted EBITDA, an overview of BGC's two business segments of financial services and real estate services, and details on the eSpeed transaction where BGC will sell its U.S. Treasury trading platform to NASDAQ OMX. It also provides segment revenue breakdowns, growth opportunities in electronic trading, and the diversification of BGC's financial services business.
Fifth Third Bancorp reported 2006 earnings of $1.2 billion compared to $1.5 billion in 2005. Fourth quarter 2006 earnings were $66 million compared to $377 million in the previous quarter and $332 million in the same quarter of 2005. Results were negatively affected by $454 million in losses from actions taken to improve the balance sheet profile by reducing securities and borrowing. Core deposit and loan growth was solid but was offset by lower noninterest income, mainly due to the $411 million in securities losses. Credit costs were in line with expectations and the company is optimistic about continued momentum in 2007 from further growth opportunities.
Este documento proporciona instrucciones para descargar e instalar Microsoft Word desde un CD y para realizar varias tareas básicas en Word como poner texto en negrita, crear un nuevo documento, editar imágenes, alinear texto, agregar encabezados, pies de página, guardar documentos, crear documentos en blanco, cambiar el color de fondo de página, agregar columnas y tablas, y cambiar de usuario.
The document is a financial supplement from JPMorgan Chase & Co. for the second quarter of 2011. It includes:
- Consolidated financial highlights such as total net revenue, net income, earnings per share, and capital ratios for the second quarter of 2011 compared to previous quarters.
- Business segment results for the second quarter of 2011 including net income for each line of business.
- Additional financial details such as credit related information, market risk information, and non-GAAP reconciliations.
- The supplement provides investors with JPMorgan Chase's key financial results to allow analysis of performance and comparisons to previous periods. It contains consolidated results, business segment results, and other financial details for
Las Normas de Información Financiera (NIF) comprenden un conjunto de conceptos y normas que regulan la elaboración y presentación de la información contenida en los estados financieros. Su importancia radica en que estructuran la teoría contable y sirven de marco regulador para la emisión de los estados financieros, evitando discrepancias en la información financiera. Las NIF se conforman de cuatro apartados: Normas conceptuales, Normas particulares, Interpretaciones a las NIF y Orientaciones a las NIF.
1. In 2Q11, JPMorgan Chase reported net income of $5.4 billion on revenue of $27.4 billion, with EPS of $1.27 per share.
2. Significant items impacting results included a $1 billion benefit from reduced loan loss reserves in Card Services, $620 million in securities gains in Corporate, a $1 billion expense for estimated foreclosure costs in Retail Financial Services, and $787 million in additional litigation reserves in Corporate.
3. The Investment Bank reported net income of $2.1 billion on revenue of $7.3 billion, with strong performance across most businesses. Retail Financial Services reported a net loss of $454 million due to
- JPMorgan Chase reported financial results for the second quarter of 2010 with net income of $4.8 billion, an increase of 44% compared to the same quarter in the prior year.
- Total net revenue was $25.1 billion for the quarter, a decrease of 2% from the prior year. Noninterest expenses increased 8% to $14.6 billion.
- The provision for credit losses decreased 58% to $3.4 billion from the second quarter of 2009, reflecting improved asset quality.
La ciencia se define como el conocimiento obtenido a través de la observación y experimentación, y es importante porque mejora la cultura humana y permite la supervivencia. La tecnología se compone de conocimientos técnicos ordenados que crean bienes y servicios para satisfacer las necesidades humanas y facilitar la adaptación al medio ambiente. La tecnología es importante porque ahora forma parte integral de la vida cotidiana a través de dispositivos como las computadoras y los teléfonos celulares. La ciencia y la tecnología están relacionadas, ya que la
Retail Financial Services reported net income of $1.0 billion compared to $15 million in the prior year. Mortgage Banking and Other Consumer Lending net income was $364 million, up 55% year-over-year. The Investment Bank reported net income of $1.4 billion on revenue of $6.3 billion with a return on equity of 14%. Card Services reported net income of $343 million compared to a net loss of $672 million in the prior year, with credit costs down year-over-year.
JPMorgan Chase reported third quarter 2010 net income of $4.4 billion. Key highlights included a $930 million reduction to loan loss reserves in card services and increases of $776 million and $622 million to litigation and mortgage repurchase reserves, respectively. Several business segments reported solid results, with the investment bank ranked number one for the year in global fees and the retail bank seeing growth in deposits and mortgage originations. Credit costs declined across most businesses from reduced charge-offs.
JPMorgan Chase reported third quarter 2010 net income of $4.4 billion. Key highlights included a $930 million reduction to loan loss reserves in card services and increases of $776 million and $622 million to litigation and mortgage repurchase reserves, respectively. Several business segments reported solid results, with the investment bank ranked number one for the year in global fees and the commercial bank completing a $3.5 billion loan portfolio purchase. Credit costs declined across most businesses as credit quality continued to improve.
JPMorgan Chase reported third quarter 2010 net income of $4.4 billion and earnings per share of $1.01. Key business segments performed well, with the Investment Bank ranked #1 in global fees year-to-date, and Retail Financial Services reporting strong mortgage production. Credit costs decreased from reductions to loan loss reserves. However, increases to litigation reserves partially offset these gains. Overall, the company delivered solid results while continuing investments across its businesses.
JPMorgan Chase reported third quarter 2010 net income of $4.4 billion and earnings per share of $1.01. Key business segments performed well, with the Investment Bank ranked #1 in global fees year-to-date, and Retail Financial Services reporting strong mortgage production. Credit costs declined from reductions to loan loss reserves. However, increases to litigation reserves reduced earnings. Overall, the company delivered solid results with improved credit performance.
JPMorgan Chase reported net income of $2.4 billion for the first quarter of 2008, down 49% from the first quarter of 2007. Earnings per share were $0.68 compared to $1.34 in the prior year. The Investment Bank saw significant declines in revenue and increased credit losses. Retail Financial Services also reported an increased provision for credit losses related to deteriorating home equity and subprime mortgage portfolios. However, the firm maintained a strong capital position with a Tier 1 capital ratio of 8.3%. JPMorgan also announced the planned acquisition of Bear Stearns during the quarter to enhance client services.
JPMorgan Chase reported second quarter 2010 net income of $4.8 billion, up significantly from $2.7 billion in the second quarter of 2009. Revenue was $25.6 billion. While most businesses performed solidly with reduced credit costs, returns in consumer lending remained unacceptable. The bank maintained strong capital and liquidity positions. Looking ahead, Dimon noted regulatory reforms could impact clients and businesses, and implementation will require careful coordination.
- Banco Latinoamericano de Comercio Exterior, S.A. (Bladex) held a 1Q22 earnings presentation on May 4, 2022.
- Bladex's credit portfolio reached a record high of $8.4 billion in 1Q22, driven by strong demand and higher commodity prices. However, net profits decreased 13% year-over-year and 45% quarter-over-quarter due to increased credit loss provisions associated with portfolio growth.
- Net interest income increased 36% year-over-year and 4% quarter-over-quarter due to higher loan volumes and net interest rates, though this growth was offset by higher provision expenses.
Ladder Capital - Q2 2020 Earnings Supplemental PresentationDavid Merkur
Ladder Capital Corp reported its results for the quarter ended June 30, 2020. Some highlights include:
- Total assets of $6.6 billion including $3.0 billion in loans, $1.5 billion in securities, and $1.0 billion in commercial real estate equity.
- Generated core earnings of $12.8 million and core EPS of $0.12 for the quarter.
- Declared a $0.20 per share dividend, representing a 10.4% annual yield.
- Increased liquidity with $826 million of unrestricted cash and reduced adjusted leverage to 3.1x.
The Investment Bank generated strong net income of $2.5 billion on revenue of $8.3 billion in 1Q10. Fixed Income Markets revenue was $5.5 billion, up 12% year-over-year. Retail Financial Services reported a net loss of $131 million compared to net income of $474 million in 1Q09, driven by a $1.3 billion net loss in the Real Estate Portfolios. Card Services reported a net loss of $303 million compared to a net loss of $547 million in 1Q09, as credit costs declined but remained elevated.
Citi reported revenues of $24.8 billion for the first quarter of 2009, nearly double the prior year period. Net income was $1.6 billion. Results were driven by strong performance in institutional banking, though offset by higher credit costs. Credit costs totaled $10.3 billion, up 76% due to increased net credit losses and loan loss reserves. The CEO commented that clients remained engaged with Citi and that the company would continue reducing legacy risks and improving efficiency.
- JPMorgan Chase reported net income of $9.1 billion for Q3 2019, up 8% from the prior year. Revenue was $30.1 billion, up 8%, driven by growth in consumer and investment banking.
- Consumer & Community Banking revenue was $14.3 billion, up 7%, helped by higher deposits and auto/credit card volumes, though home lending revenue fell due to loan sales.
- Corporate & Investment Bank revenue was $9.3 billion, up 6%, with record investment banking fees and strong fixed income markets, though equity markets fell.
Ladder Capital - Q2 2020 Earnings Supplemental Presentation (2020-07-30)David Merkur
Ladder Capital provided a supplemental document for the quarter ended June 30, 2020 with the following key points:
- They reported $12.8 million in Core Earnings and $0.12 in Core EPS for the quarter.
- Their capital structure was updated this quarter with over $500 million in new non-recourse financing obtained through CLO and Koch transactions.
- They have a staggered debt maturity profile with $822 million reduction in maturities through 2021. Liquidity was also increased with $826 million in unrestricted cash.
- Their unencumbered asset pool totals $2.7 billion with strong coverage ratios for their unsecured debt.
Susquehanna Bancshares provides an investor presentation for the 3rd quarter of 2013. The presentation includes forward-looking statements and cautions investors that actual results may differ due to risks and uncertainties. It provides an overview of Susquehanna, including its market presence, financial information, and strategies to drive organic loan growth, defend its net interest margin, grow fee revenue, maintain efficiency, and accelerate capital generation and returns. Highlights from the 2nd quarter of 2013 include steady loan growth, continued focus on core deposit growth, strong profitability, and solid credit quality.
JPMorgan Chase reported third quarter 2009 net income of $3.6 billion, an increase from $527 million in third quarter 2008. Revenue was $28.8 billion, a record year-to-date. Credit costs remained high at $31.5 billion and the firm added $2 billion to consumer credit reserves. The firm's capital levels were strengthened with Tier 1 Common at $101 billion and ratios of 8.2% and 10.2% respectively. While signs of credit stability emerged, continued uncertainty led to higher reserves. The firm's strong capital position will enable continued investment despite this uncertainty.
JPMorgan Chase reported third quarter 2009 net income of $3.6 billion, an improvement from $527 million in the third quarter of 2008. Revenue was $28.8 billion, a record level for the year to date. Credit costs remained high at $2 billion added to consumer credit reserves, bringing the total to $31.5 billion. The firm's capital levels were strengthened with Tier 1 Common Capital reaching $101 billion, or 8.2% of the total. While signs of stability were seen in consumer credit, continued uncertainty remains around the economy. JPMorgan Chase aims to continue investing in its businesses through the challenging environment.
Ladder Capital - Q2 2021 Earnings Supplemental PresentationDavid Merkur
The document provides supplemental data for Ladder Capital Corp for the quarter ended June 30, 2021. Key highlights include:
- $5.6 billion in total assets including $2.6 billion in loans, $948 million in real estate equity, and $719 million in securities.
- Originated $839 million in first mortgage loans, funded $718 million, and received $158 million in loan repayments.
- Sold one commercial real estate equity investment for $39 million.
- Declared a quarterly dividend of $0.20 per share, representing a 7.1% annual yield.
- JPMorgan Chase & Co. reported a net loss of $380 million for the third quarter of 2013 compared to net income of $6.496 billion for the second quarter of 2013.
- Total net revenue was $23.117 billion for the third quarter, down 8% from the prior quarter, driven by lower investment banking and mortgage fees and higher noninterest expense, including legal expense.
- The firm recorded a provision for credit losses of $543 million for the third quarter compared to $47 million in the prior quarter, reflecting a higher allowance for loan losses.
JPMorgan Chase reported third quarter 2011 net income of $4.3 billion, down slightly from $4.4 billion in third quarter 2010. Revenue was $24.4 billion. While the investment banking environment was challenging, JPMorgan maintained its #1 ranking for global investment banking fees year-to-date. Consumer & business banking reported higher revenue and deposits. Credit card sales volume was up 10% and net charge-offs declined as expected. The firm repurchased $4.4 billion in stock and maintained a Basel I Tier 1 ratio of 9.9% and estimated Basel III ratio of 7.7%.
JPMorgan Chase reported third quarter 2011 net income of $4.3 billion, down slightly from $4.4 billion in third quarter 2010. Revenue decreased due to challenging market conditions impacting the Investment Bank. The firm maintained its #1 ranking for Global Investment Banking Fees year-to-date. Consumer & Business Banking reported higher revenues and deposits compared to a year ago. Credit quality improved with lower credit card and wholesale credit losses, while mortgage losses remained elevated. The firm repurchased $4.4 billion in stock and estimated its Basel III Tier 1 ratio was 7.7% at the end of the third quarter.
- In 3Q11, JPMorgan Chase reported net income of $4.3 billion and earnings per share of $1.02. Revenue for the quarter was $24.4 billion.
- The Investment Bank contributed net income of $1.6 billion on revenue of $6.4 billion, which included $1.9 billion in DVA gains.
- Retail Financial Services reported net income of $1.2 billion, with credit costs of $1 billion reflecting continued losses in mortgage and home equity portfolios.
- Mortgage Production and Servicing reported net income of $205 million, with production revenue of $1.3 billion and servicing revenue of $1.2 billion
JPMorgan Chase reported third quarter 2010 net income of $4.4 billion, up 23% from the third quarter of 2009. Revenue was $24.3 billion. The Investment Bank reported solid earnings and maintained its #1 ranking for global investment banking fees and global debt/equity. Retail Financial Services had strong mortgage production and continued branch expansion. Card Services saw increased sales volume and improved credit trends. Commercial Banking reported record revenue. Asset Management had $38 billion in net inflows. Credit costs declined but mortgage and credit card losses remained high. The Firm's capital and credit reserves remained strong.
- Total net revenue for JPMorgan Chase & Co. in the third quarter of 2009 was $26.6 billion, up 4% from the previous quarter and up 81% from the third quarter of 2008.
- Net income was $3.6 billion, up 32% from the third quarter of 2008.
- Earnings per share were $0.82, up 193% from the third quarter of 2008.
EOP Loans & Leases
Avg Deposits
FINANCIAL RESULTS
1
Actual numbers for all periods, not over/under
2 Calculated based on average equity; 3Q09 average equity was $2B
3 Excludes loans held-for-sale and loans at fair value
4 Calculated based on average equity; 3Q09 average equity was $2B
8
Total revenue of $1.5B up 335% YoY driven by the
impact of the WaMu transaction and wider loan spreads
Middle Market Banking revenue up $729mm YoY due to
the WaMu transaction
Credit costs of $43mm reflect higher net
EOP Loans & Leases
Avg Deposits
FINANCIAL RESULTS
1
Actual numbers for all periods, not over/under
2 Calculated based on average equity; 3Q09 average equity was $2B
3 Excludes loans held-for-sale and loans at fair value
4 Calculated based on average equity; 3Q09 average equity was $2B
8
Total revenue of $1.5B up 4% YoY driven by growth in
Middle Market Banking and Real Estate Banking, partially
offset by lower Commercial Term Lending revenue
Credit costs of $43mm reflect higher net charge-offs
Expense up 10
- JPMorgan Chase & Co. released its financial supplement for the second quarter of 2010 including consolidated results and business detail.
- Total net revenue was $25.1 billion for Q2 2010, down 9% from Q1 2010 but up 2% year-over-year. Net income was $4.8 billion for Q2 2010, up 44% from Q1 2010 and 76% year-over-year.
- By line of business, the Investment Bank and Commercial Banking saw the largest increases in net income quarter-over-quarter, while Retail Financial Services had a loss in Q1 2010 but profit in Q2 2010.
- JPMorgan Chase & Co. released its financial supplement for the second quarter of 2010 including consolidated results and business detail.
- Total net revenue was $25.1 billion for Q2 2010, down 9% from Q1 2010 but up 2% year-over-year. Net income was $4.8 billion for Q2 2010, up 44% from Q1 2010 and 76% year-over-year.
- By line of business, net income was highest for Investment Bank ($1.4 billion), Retail Financial Services ($1 billion), and Commercial Banking ($693 million) for Q2 2010.
- JPMorgan Chase & Co. released its financial supplement for the second quarter of 2010 including consolidated results and business detail.
- Total net revenue was $25.1 billion for Q2 2010, down 9% from Q1 2010 but up 2% year-over-year. Net income was $4.8 billion for Q2 2010, up 44% from Q1 2010 and 76% year-over-year.
- By line of business, the Investment Bank and Commercial Banking saw the largest increases in net income quarter-over-quarter, while Retail Financial Services had a loss in Q1 2010 but profit in Q2 2010.
- JPMorgan Chase & Co. released its financial supplement for the second quarter of 2010 including consolidated results and business detail.
- Total net revenue was $25.1 billion for Q2 2010, down 9% from Q1 2010 but up 2% year-over-year. Net income was $4.8 billion for Q2 2010, up 44% from Q1 2010 and 76% year-over-year.
- By line of business, the Investment Bank and Commercial Banking saw the largest increases in net income quarter-over-quarter, while Retail Financial Services had a loss in Q1 2010 but profit in Q2 2010.
The document is JPMorgan Chase & Co.'s earnings release for the second quarter of 2009. It reported net income of $2.7 billion for Q2 2009, up 27% from Q1 2009. Total net revenue was $25.6 billion for Q2 2009, up 2% from the previous quarter. The provision for credit losses was $8 billion for Q2 2009, down 7% from Q1 2009.
Independent Study - College of Wooster Research (2023-2024) FDI, Culture, Glo...AntoniaOwensDetwiler
"Does Foreign Direct Investment Negatively Affect Preservation of Culture in the Global South? Case Studies in Thailand and Cambodia."
Do elements of globalization, such as Foreign Direct Investment (FDI), negatively affect the ability of countries in the Global South to preserve their culture? This research aims to answer this question by employing a cross-sectional comparative case study analysis utilizing methods of difference. Thailand and Cambodia are compared as they are in the same region and have a similar culture. The metric of difference between Thailand and Cambodia is their ability to preserve their culture. This ability is operationalized by their respective attitudes towards FDI; Thailand imposes stringent regulations and limitations on FDI while Cambodia does not hesitate to accept most FDI and imposes fewer limitations. The evidence from this study suggests that FDI from globally influential countries with high gross domestic products (GDPs) (e.g. China, U.S.) challenges the ability of countries with lower GDPs (e.g. Cambodia) to protect their culture. Furthermore, the ability, or lack thereof, of the receiving countries to protect their culture is amplified by the existence and implementation of restrictive FDI policies imposed by their governments.
My study abroad in Bali, Indonesia, inspired this research topic as I noticed how globalization is changing the culture of its people. I learned their language and way of life which helped me understand the beauty and importance of cultural preservation. I believe we could all benefit from learning new perspectives as they could help us ideate solutions to contemporary issues and empathize with others.
STREETONOMICS: Exploring the Uncharted Territories of Informal Markets throug...sameer shah
Delve into the world of STREETONOMICS, where a team of 7 enthusiasts embarks on a journey to understand unorganized markets. By engaging with a coffee street vendor and crafting questionnaires, this project uncovers valuable insights into consumer behavior and market dynamics in informal settings."
"Does Foreign Direct Investment Negatively Affect Preservation of Culture in the Global South? Case Studies in Thailand and Cambodia."
Do elements of globalization, such as Foreign Direct Investment (FDI), negatively affect the ability of countries in the Global South to preserve their culture? This research aims to answer this question by employing a cross-sectional comparative case study analysis utilizing methods of difference. Thailand and Cambodia are compared as they are in the same region and have a similar culture. The metric of difference between Thailand and Cambodia is their ability to preserve their culture. This ability is operationalized by their respective attitudes towards FDI; Thailand imposes stringent regulations and limitations on FDI while Cambodia does not hesitate to accept most FDI and imposes fewer limitations. The evidence from this study suggests that FDI from globally influential countries with high gross domestic products (GDPs) (e.g. China, U.S.) challenges the ability of countries with lower GDPs (e.g. Cambodia) to protect their culture. Furthermore, the ability, or lack thereof, of the receiving countries to protect their culture is amplified by the existence and implementation of restrictive FDI policies imposed by their governments.
My study abroad in Bali, Indonesia, inspired this research topic as I noticed how globalization is changing the culture of its people. I learned their language and way of life which helped me understand the beauty and importance of cultural preservation. I believe we could all benefit from learning new perspectives as they could help us ideate solutions to contemporary issues and empathize with others.
2. Elemental Economics - Mineral demand.pdfNeal Brewster
After this second you should be able to: Explain the main determinants of demand for any mineral product, and their relative importance; recognise and explain how demand for any product is likely to change with economic activity; recognise and explain the roles of technology and relative prices in influencing demand; be able to explain the differences between the rates of growth of demand for different products.
Solution Manual For Financial Accounting, 8th Canadian Edition 2024, by Libby...Donc Test
Solution Manual For Financial Accounting, 8th Canadian Edition 2024, by Libby, Hodge, Verified Chapters 1 - 13, Complete Newest Version Solution Manual For Financial Accounting, 8th Canadian Edition by Libby, Hodge, Verified Chapters 1 - 13, Complete Newest Version Solution Manual For Financial Accounting 8th Canadian Edition Pdf Chapters Download Stuvia Solution Manual For Financial Accounting 8th Canadian Edition Ebook Download Stuvia Solution Manual For Financial Accounting 8th Canadian Edition Pdf Solution Manual For Financial Accounting 8th Canadian Edition Pdf Download Stuvia Financial Accounting 8th Canadian Edition Pdf Chapters Download Stuvia Financial Accounting 8th Canadian Edition Ebook Download Stuvia Financial Accounting 8th Canadian Edition Pdf Financial Accounting 8th Canadian Edition Pdf Download Stuvia
In a tight labour market, job-seekers gain bargaining power and leverage it into greater job quality—at least, that’s the conventional wisdom.
Michael, LMIC Economist, presented findings that reveal a weakened relationship between labour market tightness and job quality indicators following the pandemic. Labour market tightness coincided with growth in real wages for only a portion of workers: those in low-wage jobs requiring little education. Several factors—including labour market composition, worker and employer behaviour, and labour market practices—have contributed to the absence of worker benefits. These will be investigated further in future work.
BONKMILLON Unleashes Its Bonkers Potential on Solana.pdfcoingabbar
Introducing BONKMILLON - The Most Bonkers Meme Coin Yet
Let's be real for a second – the world of meme coins can feel like a bit of a circus at times. Every other day, there's a new token promising to take you "to the moon" or offering some groundbreaking utility that'll change the game forever. But how many of them actually deliver on that hype?
OJP data from firms like Vicinity Jobs have emerged as a complement to traditional sources of labour demand data, such as the Job Vacancy and Wages Survey (JVWS). Ibrahim Abuallail, PhD Candidate, University of Ottawa, presented research relating to bias in OJPs and a proposed approach to effectively adjust OJP data to complement existing official data (such as from the JVWS) and improve the measurement of labour demand.
Falcon stands out as a top-tier P2P Invoice Discounting platform in India, bridging esteemed blue-chip companies and eager investors. Our goal is to transform the investment landscape in India by establishing a comprehensive destination for borrowers and investors with diverse profiles and needs, all while minimizing risk. What sets Falcon apart is the elimination of intermediaries such as commercial banks and depository institutions, allowing investors to enjoy higher yields.
5 Tips for Creating Standard Financial ReportsEasyReports
Well-crafted financial reports serve as vital tools for decision-making and transparency within an organization. By following the undermentioned tips, you can create standardized financial reports that effectively communicate your company's financial health and performance to stakeholders.
2. 2Q13 Financial highlights
2Q13 net income of $6.5B; EPS of $1.60; revenue of $26.0B1
Strong performance across our businesses
2Q13 results included the following significant items
$mm, excluding EPS
Pretax
Real Estate Portfolios – Benefit from reduced mortgage loan loss reserves
Net income2
EPS2
Corporate – Expense for additional litigation reserves
$589
$0.15
550
341
0.09
(600)
Card Services – Benefit from reduced credit card loan loss reserves
$950
(372)
(0.09)
Fortress balance sheet strengthened
Basel I Tier 1 common of $147B; ratio of 10.4%3
FINANCIAL RESULTS
Estimated Basel III Tier 1 common of $148B; ratio of 9.3%, including the impact of
final rules4
– Based on NPR5, Basel III Tier 1 common ratio of 9.1%
1 See
note 1 on slide 22
Assumes a tax rate of 38%
3 See note 4 on slide 22 and the Basel I Tier 1 capital ratio on page 39 of the Firm’s 2Q13 earnings release financial supplement
4 Final Basel III capital rules issued July 2, 2013
5 Final Basel 2.5 rules and Basel III Advanced NPR
2
1
3. 2Q13 Financial results1
$mm, excluding EPS
$ O/(U)
2Q13
1Q13
2Q12
$25,958
$110
$3,066
47
(570)
(167)
Expense
15,866
443
900
Reported net income
$6,496
($33)
$1,536
Net income applicable to common stock
$6,101
($30)
$1,467
Revenue (FTE)1
Credit costs
Reported EPS
$1.60
$0.01
$0.39
1
2
3
13%
13%
11%
ROTCE2,3
FINANCIAL RESULTS
ROE2
17
17
15
See note 1 on slide 22
Actual numbers for all periods, not over/under
See note 3 on slide 22
2
4. Fortress balance sheet and returns
$B, except where noted
2Q13
1Q13
2Q12
Basel I Tier 1 common capital1,2
$147
$143
$130
Basel I Risk-weighted assets 2
1,414
1,407
1,319
Basel I Tier 1 common ratio 1,2
10.4%
10.2%
Basel III Tier 1 common capital2
$148
$146
Basel III Risk-weighted assets (including final rules) 2
Basel III Tier 1 common ratio (including final rules)
Total assets (EOP)
2
―
9.3%
$2,440
Return on equity
Return on tangible common equity
Return on assets
―
1,587
$2,389
9.9%
$132
―
―
$2,290
13%
13%
17
1.14
1.9
$40.04
$39.54
2Q13 based on NPR2
Impact of final rules
2Q13 w ith final rules 2
20 bps
9.1%
$1,614
20 bps
9.3%
$1,587
1.5
$35.71
3
Return on Basel I Risk-weighted assets 4
Tangible book value per share 5
Reduction in RWA
25 bps
(20) bps
0.88
1.8
AOCI
15
1.09
Capital generation
Ratio RWA ($B)
8.9% $1,654
11%
17
Basel III Tier 1 common
1Q13
U.S. Basel III capital rules finalized and largely consistent with expectations
~20bps improvement in our B3T1C ratio primarily from revised treatment of MSRs and securitizations under Advanced approach
Estimated LCR ratio of 118%; HQLA6 of $454B
FINANCIAL RESULTS
Available resources7 to Basel III RWA of ~19%
2Q13 common stock dividend increased to $0.38 per share
Of the $6B authorized through 1Q14, repurchased $1.2B of common equity in 2Q13
Firmwide total credit reserves of $20.1B; loan loss coverage ratio of 2.06%8
1 See
note 4 on slide 22 and the Basel I Tier 1 capital and Tier 1 capital ratio on page 39 of the Firm’s 2Q13 earnings release financial supplement
I reflects the impact of final Basel 2.5 rules effective 1Q13, which resulted in additional capital requirements for trading positions and securitizations; Basel III estimate reflects the impact of final Basel 2.5 rules; final Basel III capital rules issued July 2, 2013
See note 3 on slide 22
4 Return on Basel I RWA, excluding DVA, a non-GAAP financial measure, was 1.8%, 1.9% and 1.4% for 2Q13, 1Q13 and 2Q12, respectively
5 Tangible book value per share is a non-GAAP financial measure. Tangible book value per share represents the Firm's tangible common equity divided by period-end common shares
6 High Quality Liquid Assets (“HQLA”) is the estimated amount of assets the Firm believes will qualify for inclusion in the Liquidity Coverage Ratio (“LCR”) based on the Firm’s current understanding of the proposed rules
7 Available resources include Basel III Tier 1 Common equity, preferred and trust preferred securities, as well as holding company unsecured long-term debt with remaining maturities greater than 1 year
8 See note 2 on slide 22
Note: estimated for 2Q13
2 Basel
3
3
5. Leverage ratio update
JPM’s estimated Basel III leverage ratio based on July 2013 proposed U.S. leverage rule is 4.7% compared to Holding Company
requirement of 5.0%
Balance sheet view
U.S. GAAP assets
Includes:
Cash
HQLA1
Other
Proposed U.S. rule add-ons
$2.4T
$279B
$175B
+
Leverage exposure
Unfunded commitments
< $3.5T
Derivatives future exposure
Illustrative JPM capital generation – based on analysts' estimates
~2x
B3 RWA
Potential further add-ons per Basel proposal
Sold credit protection
Matched securities financing netting
Additional derivatives collateral disallowed
60bps improvement from net capital generation
(holding capital distributions flat) through end of 2014
2Q13
Actual
Basel III Tier 1 common ratio (%)
9.3%
20142
~$12
$155
Analysts' estimated net income ($B)
2H132
~$23
$168
≥ 9.5%
≤ 11.0%
Cumulative impacts to leverage ratio (bps)
Capital generation
Tier 1 capital actions
FINANCIAL RESULTS
~60bps
~0-30bps
Total leverage ratio impact
capital and balance sheet over time
Holding Company can be compliant by 1Q15; bank
compliance will follow
Timeline subject to revision if significant rule
changes are made to denominator
Balance sheet actions may include
~20bps
Leverage asset actions
~0-100bps improvement from optimizing Tier 1
Over time
~0-70bps
~60-160bps
Reprice/restructure certain commitments and/or
unwind derivative positions
Limit non-operational wholesale deposits
Optimize use of central clearing
Incent business unit and entity level efficiencies
Although compliance will not be without impact, it is manageable
1
2
High Quality Liquid Assets (“HQLA”) is the estimated amount of assets the Firm believes will qualify for inclusion in the Liquidity Coverage Ratio (“LCR”) based on the Firm’s current understanding of the proposed rules
Reflects Bloomberg average of analysts’ estimates for net income as of July 9, 2013 net of annual preferred dividends of ~$800mm and common dividends at $0.38/share; assumes $6-8B annual share repurchases
generally consistent with 2013 CCAR approval
4
6. Consumer & Community Banking1
$mm
Leadership positions
Consumer & Business Banking
$ O/(U)
2Q13
Net interest income
Noninterest revenue
Revenue
Expense
Credit costs
Net income
$7,094
4,921
$12,015
6,864
(19)
$3,089
1Q13
2Q12
#1 ATM network3
($115)
515
$400
74
(568)
$503
($67)
(368)
($435)
27
(198)
($193)
#2 in branches3
#1 most visited banking portal – Chase.com4
#1 in customer satisfaction among the largest banks by both J.D.
Power5 and the American Customer Satisfaction Index
$172B client investment assets; nearly 1,700 Chase Private Client
Key drivers/statistics2
EOP Equity ($B)
ROE
Overhead ratio
Average loans ($B)
Average deposits ($B)
Number of branches
Number of ATMs
Active online customers (000's)
Active mobile customers (000's)
FINANCIAL RESULTS
1
locations and 165K+ CPC clients
$46.0
27%
57
$411.1
453.6
5,657
19,075
32,245
14,013
$46.0
23%
58
$418.3
441.3
5,632
18,830
32,281
13,263
$43.0
31%
55
$429.3
411.3
5,563
18,132
30,361
10,646
See note 1 on slide 22
2 Actual numbers for all periods, not over/under
3 Based on disclosures by peers as of 1Q13
4 Per compete.com as of May 2013
5 Chase ranked #4 by J.D. Power for customer satisfaction in retail banking among large bank peers
6 Based on Inside Mortgage Finance as of 1Q13
7 Chase ranked #4 for customer satisfaction in originations and #4 in servicing on an overall basis
8 Based on disclosures by peers and internal estimates as of 1Q13
9 Based on Visa data as of 1Q13
10 Based on Nilson Report ranking of largest merchant acquirers for 2012
11 Per Autocount data for May 2013 YTD
Mortgage Banking
#2 mortgage originator6
#2 retail mortgage originator6
#3 mortgage servicer6
#1 in customer satisfaction among the largest banks for
originations and servicing by J.D. Power7
Card, Merchant Services & Auto
#1 credit card issuer in the U.S. based on loans outstanding8
#1 global Visa issuer based on consumer and business credit
card sales volume9
#1 U.S. co-brand credit card issuer8
#2 wholly-owned merchant acquirer10
#3 non-captive auto lender11
5
7. Consumer & Community Banking
Consumer & Business Banking
Financial performance
$mm
Consumer & Business Banking net income of $698mm,
$ O/(U)
down 25% YoY, but up 9% QoQ
2Q13
1Q13
Net interest income
$2,614
$42
($47)
Noninterest revenue
1,673
68
18
Revenue
$4,287
$110
($29)
Expense
3,042
1
285
74
13
76
$698
$57
($233)
Credit costs
Net income
2Q12
Average total deposits
Expense up 10% YoY, primarily driven by investments
and certain adjustments in the prior year, but flat QoQ
Key drivers
Key drivers/statistics 1 ($B)
EOP Equity
ROE
Net revenue of $4.3B, down 1% YoY, but up 3% QoQ
$11.0
25%
$432.8
$11.0
24%
$421.1
$9.0
42%
Average total deposits of $432.8B, up 11% YoY and 3%
QoQ
$389.6
Deposit margin
2.31%
2.36%
2.62%
Accounts 2 (mm)
Business Banking loan originations
28.9
28.5
27.4
$1.3
$1.2
$1.8
Business Banking loan balances (Avg)
18.7
18.7
17.9
Deposit margin of 2.31%, down 31 bps YoY and 5 bps
Investment sales
Client investment assets (EOP)
1
2
9.5
9.2
168.5
Accounts2 up 6% YoY and 1% QoQ, reflecting
historically low customer attrition
6.2
171.9
QoQ
147.6
Business Banking loan originations down 26% YoY and
Actual numbers for all periods, not over/under
Includes checking accounts and Chase LiquidSM cards
up 7% QoQ
Average Business Banking loans up 4% YoY and flat
QoQ
Investment sales up 53% YoY and 3% QoQ
FINANCIAL RESULTS
Client investment assets up 16% YoY and 2% QoQ
6
8. Consumer & Community Banking
Mortgage Banking
$mm
Financial performance
Mortgage Production
Production-related revenue, excl. repurchase losses
Production expense 1
Income, excl. repurchase losses
Repurchase (losses)/benefit
Income before income tax expense
Mortgage Servicing
Net servicing-related revenue
Default servicing expense
Core servicing expense
Servicing expense
Income/(loss), excl. MSR risk management
MSR risk management
Income before income tax expense
Real Estate Portfolios
Revenue
Expense
Net charge-offs
Change in allowance
Credit costs
Income before income tax expense
Mortgage Banking net income
Mortgage Production pretax income of $582mm, down
$ O/(U)
1Q13
2Q12
$68
10
$58
97
$155
($275)
100
($375)
26
($349)
$770
475
240
$715
55
78
$133
($8)
(22)
–
($22)
14
220
$234
($15)
(230)
(8)
($238)
223
(155)
$68
$908
404
288
(950)
($662)
$1,166
($37)
41
(160)
(300)
($460)
$382
($132)
(8)
(408)
300
($108)
($16)
$1,142
$469
($179)
2Q13
$1,286
720
$566
16
$582
$349mm YoY, reflecting lower margins and higher expense,
partially offset by higher volumes and lower repurchase
losses
Realized repurchase losses of $169mm
Reduction of repurchase liability of $185mm
Net servicing-related revenue of $770mm, down 2% YoY
Mortgage Servicing expense down $238mm YoY
MSR risk management income of $78mm, down $155mm
YoY
Real Estate Portfolios pretax income of $1.2B, down $16mm
YoY
Total net revenue of $908mm, down 13% YoY, driven by
a decline in net interest income resulting from portfolio
runoff
Credit cost benefit of $662mm
–
–
Key drivers/statistics ($B)2
$19.5
23%
$19.5
14%
$17.5
30%
Mortgage originations 3
EOP third-party mortgage loans serviced
FINANCIAL RESULTS
EOP Equity
ROE
$49.0
$52.7
$43.9
832.0
114.6
2.85%
849.2
115.4
3.66%
860.0
124.5
5.20%
1.00
1.56
2.21
EOP NCI owned portfolio 4
ALL/EOP loans 4,5
Net charge-off rate 4,5
Mortgage originations of $49.0B, up 12% YoY and down 7%
QoQ
Purchase originations of $17.4B, up 50% YoY and 44%
QoQ
1
Includes the provision for credit losses associated with Mortgage Production
Actual numbers for all periods, not over/under
3 Firmwide mortgage origination volume was $52.0B, $55.1B and $46.0B for 2Q13, 1Q13 and 2Q12,
respectively
4 Real Estate Portfolios only
5 Excludes the impact of purchased credit-impaired loans acquired as part of the WaMu transaction. The
allowance for loan losses was $5.7B for these loans at the end of 2Q13,1Q13 and 2Q12. To date, no
charge-offs have been recorded for these loans
Net charge-offs of $288mm
Reduction in allowance for loan losses of $950mm
2
7
9. Consumer & Community Banking
Card, Merchant Services & Auto
Financial performance
$mm
Net income of $1.2B, up 21% YoY
$ O/(U)
2Q13
1Q13
$4,670
Expense
1,988
45
Net income, excluding the reduction in the allowance for
(72)
(371)
(550)
(50)
loan losses3, up 61% YoY
Revenue of $4.7B, up 3% YoY
Credit costs of $564mm, down 23% YoY
Expense of $2.0B, down 5% YoY, primarily driven by lower
remediation expense related to an exited non-core product
(108)
1,114
201
Net charge-offs
Change in allowance
Credit costs
($50)
2Q12
Revenue
$564
($122)
Net income
$1,249
($23)
EOP Equity1
$15.5
ROE1
32%
$15.5
33%
$145
($170)
$219
$16.5
Key drivers
25%
Card Services
Average loans of $122.9B, down 2% YoY and 1% QoQ
Record sales volume2 of $105.2B, up 10% YoY and 11%
QoQ
Net charge-off rate3 of 3.31%, down from 4.32% in the prior
year and down from 3.55% in the prior quarter
Merchant Services
Merchant processing volume of $185.0B, up 15% YoY and
5% QoQ
Transaction volume of 8.8B, up 24% YoY and 6% QoQ
Auto
Average loans up 5% YoY and 1% QoQ
Originations up 17% YoY and 5% QoQ
Card Services – Key drivers/statistics ($B)1
Average loans
$122.9
$123.6
105.2
94.7
96.0
12.59%
12.83%
11.91%
Net charge-off rate 3
3.31
3.55
4.32
30+ day delinquency rate 3
1.69
1.94
2.13
30.0
29.4
29.3
Sales volume 2
Net revenue rate
# of accounts with sales activity (mm)
% of accounts acquired online
2
2
53%
Merchant Services – Key drivers/statistics ($B)
Merchant processing volume
$175.8
$160.2
8.8
8.3
7.1
$50.7
$50.0
$48.3
6.8
6.5
5.8
1
Average loans
Originations
FINANCIAL RESULTS
49%
1
$185.0
# of total transactions
Auto – Key drivers/statistics ($B)
52%
$125.2
1
Actual numbers for all periods, not over/under
Excludes Commercial Card
3 See note 5 on slide 22
2
8
10. Corporate & Investment Bank1
$mm
Financial performance
Net income of $2.8B on revenue of $9.9B
$ O/(U)
2Q13
$9,876
1Q13
($264)
Investment banking fees
1,717
284
472
Treasury Services
1,051
7
(23)
373
(125)
DVA gain of $355mm
2Q12
$890
3
Corporate & Investment Bank revenue
Lending 2
Total Banking
$3,141
$166
4,078
(674)
1,296
(44)
253
1,087
113
9
274
175
(409)
$6,735
($430)
IB fees of $1.7B, up 38% YoY, primarily driven by strong
585
Equity Markets
Banking
$452
Fixed Income Markets
ROE of 20%; 19% excl. DVA
Securities Services
Credit Adjustments & Other
3
Total Markets & Investor Services
Credit costs
Key drivers/statistics ($B)
Lending revenue of $373mm, primarily driven by NII on
(369)
449
$228
retained loans and fees on lending-related commitments
(35)
$462
Markets & Investor Services
Markets revenue of $5.4B, up 18% YoY, reflecting solid
client revenue and improved performance in credit-related
and equities products
4
EOP equity
$56.5
$56.5
$47.5
20%
ROE
Overhead ratio
6
Average client deposits
19%
20%
Securities Services revenue of $1.1B, up 1% YoY
58
5
Comp/revenue
EOP loans
(17)
$2,838
Net income
Treasury Services revenue of $1.1B, down 2% YoY
$438
5,742
Expense
(6)
debt and equity underwriting
– Ranked #1 in YTD Global IB fees
60
59
Credit Adjustments & Other of $274mm, predominantly
30
33
30
$110.8
$117.5
$117.0
369.1
357.3
348.1
driven by DVA
Expense of $5.7B, up 8% YoY, primarily driven by higher
FINANCIAL RESULTS
Assets under custody ($T)
18.9
19.3
17.7
compensation expense on higher revenue
ALL/EOP loans ex-conduits and trade 7
Net charge-off/(recovery) rate
2.35%
2.17%
2.75%
2Q13 comp/revenue, excl. DVA, of 31%
Average VaR ($mm)
(0.31)
0.07
(0.04)
$40
$62
$75
1 See
notes 1 and 7 on slide 22
2 Lending revenue includes net interest income, fees, gains or losses on loan sale activity, gains or losses on securities received as
part of a loan restructuring, and the risk management results related to the credit portfolio (excluding trade finance)
3 Credit adjustments & Other primarily includes net credit portfolio credit valuation adjustments (“CVA”) and associated hedging
activities; DVA related to both structured notes and derivatives; and nonperforming derivative receivable results effective in 1Q12
and thereafter
4 Actual numbers for all periods, not over/under
5 Return on equity excluding DVA, a non-GAAP financial measure, was 19%, 18% and 16%, for 2Q13, 1Q13 and 2Q12, respectively
6 Compensation expense as a percentage of total net revenue excluding DVA, a non-GAAP financial measure, was 31%, 34%, and
33%, for 2Q13, 1Q13 and 2Q12, respectively
7 ALL/EOP loans as reported was 1.21%, 1.11% and 1.31% for 2Q13, 1Q13 and 2Q12, respectively
9
11. Corporate & Investment Bank – Key metrics & leadership positions
Corporate & Investment Bank
($B)
International revenue
International deposits (Avg)1
International loans (EOP)
Gross CIB revenue from CB
Comments
FY2012
FY2011
FY2010
$9.7
$16.3
$17.1
$15.7
48% of revenue is international for 1H13; 49% excl. DVA
202.5
189.6
180.1
146.4
International deposits increased 38% from FY2010, driven by growth
across regions
69.7
67.7
67.0
45.3
International loans up 54% since FY2010
1.9
4.0
3.7
4.0
Strategic Re-engineering Program ~80% complete
Banking
Global IB fees (Dealogic)
TS firmwide revenue2
Combined Fedwire/CHIPS volume
International electronic funds
transfer volume (mm)3
Banking
#1
#1
#1
$3.4
$6.9
$6.4
#1
#1
#1
154.0
304.8
250.5
Improved ranking to #2 in Global Equity & Equity-related in 1H13 from #4 in
FY2012
#1 in combined Fedwire and CHIPS volume4, Federal Reserve, 2002–2013
2Q13 total international electronic funds transfer volume up 4% from 2Q12
$6.6
#1
#1
232.5
Markets & Investor Services
All-America Institutional Investor
research rankings
$8.3
$8.3
$7.1
$6.3
#1 Fixed income markets revenue share of top 10 investment banks 5
#1
#1
#1
International AUC up 31% from FY2010; represents 44% of 2Q13 total
AUC
International AUC ($T, EOP)
FINANCIAL RESULTS
Corporate & Investment Bank
1H13
JPM ranked #1 for FY2012, FY2011 and FY2010 for both All-America
Fixed Income Research and Equity Research
Note: Rankings included as available
1 International client deposits and other third party liabilities
2 Includes TS product revenue reported in other LOBs related to customers who are also customers of those LOBs
3 International electronic funds transfer represents volume over the period and includes non-U.S. dollar Automated Clearing House ("ACH") and clearing volume
4 1Q13 volume
5 1Q13 rank of JPM Fixed Income Markets revenue of 10 leading competitors based on reported information, excluding DVA
10
12. Commercial Banking1
Net income of $621mm, down 8% YoY and up 4% QoQ
$mm
2Q13
Revenue
$ O/(U)
1Q13
Revenue of $1.7B, up 2% YoY
2Q12
$1,728
$55
777
24
37
Corporate Client Banking
Commercial Term Lending
444
11
8
315
24
24
Real Estate Banking
113
1
(1)
79
(5)
(31)
Credit costs
$44
$5
$61
Expense
652
8
61
$621
$25
EOP loan balances up 9% YoY4; Middle Market loans up
$37
Middle Market Banking
2
2
Other
Net income
10% YoY4
Average client deposits of $195.2B, flat YoY
Credit costs of $44mm
Net charge-off rate of 0.03%
Excluding recoveries, charge-off rate of 0.08%
($52)
Expense of $652mm, flat QoQ
Key drivers/statistics ($B)3
EOP equity
$13.5
ROE
$13.5
18%
18%
28%
38
38
35
$131.6
$129.3
$118.4
130.9
195.2
130.4
196.0
120.5
193.3
Allowance for loan losses
2.7
2.7
2.6
Nonaccrual loans
0.5
0.7
0.9
0.03%
(0.02)%
(0.03)%
2.05
2.20
Overhead ratio
Average loans
4
4
EOP loans
Average client deposits
Net charge-off/(recovery) rate 5
ALL/loans
FINANCIAL RESULTS
Overhead ratio of 38%
$9.5
5
2.06
1 See
notes 1 and 8 on slide 22
Effective January 1, 2013, financial results for financial institution clients was transferred into
Corporate Client Banking from Middle Market Banking
3 Actual numbers for all periods, not over/under
4 Effective January 1, 2013, whole loan financing agreements, previously reported as other assets,
were reclassified as loans. For the quarters ended June 30, 2013 and March 31, 2013, the impact on
period-end loans was $2.1 billion and $1.7 billion, respectively and the impact on average loans was
$1.8 billion and $1.6 billion, respectively
5 Loans held-for-sale and loans at fair value were excluded when calculating the loan loss coverage
ratio and net charge-off/(recovery) rate
2
11
13. Asset Management1
Net income of $500mm, up 28% YoY
$mm
2Q13
Revenue
Private Banking
$ O/(U)
1Q13
2Q12
$2,725
$72
37
AUM of $1.5T, up 9% YoY
$361
1,483
Revenue of $2.7B, up 15% YoY
142
Institutional
588
(1)
Retail
654
36
168
$23
$2
($11)
Expense
1,892
16
191
Net income
$500
$13
$109
$9.0
$9.0
AUM net inflows for the quarter of $3B, driven by net
51
$7.0
Credit costs
Key drivers/statistics ($B)2
EOP equity
inflows of $25B to long-term products and net outflows
of $22B from liquidity products
Client assets of $2.2T, up 10% YoY and down 1% QoQ
Record EOP loan balances of $86.0B, up 22% YoY and
6% QoQ
ROE
22%
22%
22%
Pretax margin3
Assets under management (AUM)
30
29
27
$1,470
$1,483
$1,347
2,157
2,171
1,968
Average loans
83.6
80.0
67.1
EOP loans
86.0
81.4
70.5
136.6
139.4
128.1
Client assets
Average deposits
Strong investment performance
76% of mutual fund AUM ranked in the 1st or 2nd
quartiles over 5 years
Expense up 11% YoY, primarily due to higher
performance-based compensation and headcountrelated expense1
1 See
notes 1 and 8 on slide 22
Actual numbers for all periods, not over/under
3 See note 9 on slide 22
FINANCIAL RESULTS
2
12
14. Corporate/Private Equity1
Private Equity
$mm
Private Equity net income was $212mm, primarily due to
$ O/(U)
2Q13
1Q13
2Q12
Private Equity
$212
$394
$15
Treasury and CIO
(429)
(453)
1,649
Other Corporate
(335)
(743)
($552)
($802)
net valuation gains on private investments
Private Equity portfolio of $8.0B
Treasury and CIO
Treasury and CIO net loss of $429mm
Net income/(loss)
1 See
(454)
$1,210
Negative NII of $558mm due to low rates and limited
reinvestment opportunities
Net securities gains of $123mm
note 1 on slide 22
Modest loss related to redemption of trust preferred
securities
Expect Treasury and CIO quarterly net loss of $300mm +/-;
likely to vary each quarter
Other Corporate
Noninterest expense includes additional litigation reserves
of ~$600mm (pretax)
Expect Other Corporate quarterly net income to be
FINANCIAL RESULTS
$100mm +/-; likely to vary each quarter
13
15. Core net interest margin1
Net interest income trend
Core NII
Market-based NII
Core NIM
Market-based NIM
JPM NIM
3.67%
3.29%
3.10%
3.00%
2.92%
2.85%
2.83%
2.43%
2.40%
2.37%
1.07%
1.11%
1.17%
1.14%
1.05%
1Q12
2Q12
3Q12
4Q12
1Q13
2Q13
$111B
$111B
$127B
$125B
$157B
$266B
2.60%
3.06%
2.74%
1.51%
FY2010
Average balances ($B)
Deposits with banks
2.61%
1.41%
2
FY2011
$48B
$80B
1.29%
2
2.47%
2.20%
Comments
Firm NII is down modestly QoQ
Increase in cash balance primarily driven by
Deposit growth
FINANCIAL RESULTS
Both firmwide and core NIM lower
(17 bps and 23 bps, respectively) QoQ primarily due to:
Increase in cash balance – $109B QoQ, or 18 bps of core NIM
Lower loan yields and Investment Securities yields
Partly offset by lower long-term debt yields
1 See
2
Firm actions taken to accelerate LCR compliance
note 6 on slide 22
The core and market-based NII presented for FY2010 and FY2011 represent their quarterly averages (e.g. total for the year divided by 4); the yield for all periods represent the annualized yield
14
16. Outlook
NIM & NII
Consumer & Community Banking
Expect NIM relatively stable in the second half of 2013
Mortgage Banking
Total quarterly net charge-offs expected to be less than
Expect the Firm's NII to be modestly up in 3Q13 vs. 2Q131
$250mm in 3Q13
If charge-offs and delinquencies continue to trend down,
there will be continued reserve reductions
Realized repurchase losses may be offset by reserve
Corporate/Private Equity
reductions based on current trends
Expect Treasury and CIO quarterly net loss of $300mm +/-;
If primary mortgage rates remain at or above current
likely to vary each quarter
levels, refinance volumes and margins will be under
pressure and Mortgage Production profitability will be
challenged
Expect Other Corporate quarterly net income to be
$100mm +/-; likely to vary each quarter
Card, Merchant Services & Auto
If portfolio performance continues to improve – including
FINANCIAL RESULTS
delinquencies and restructured loans – potential for
incremental releases in the second half of 2013
1
Replaces previous NII guidance
15
18. Peripheral European exposure1
As of June 30, 2013 ($B)
Securities and trading
Lending
AFS
securities
Trading
Derivative
collateral
Portfolio
hedging
Net
exposure
$3.1
$0.4
$4.1
($2.0)
($0.4)
$5.2
Sovereign
0.0
0.4
(0.3)
0.0
(0.1)
0.0
Non-sovereign
3.1
0.0
4.4
(2.0)
(0.3)
5.2
$2.3
$0.0
$10.4
5
($2.4)
($4.5)
$5.8
Sovereign
0.0
0.0
8.3
(1.2)
(4.0)
3.1
Non-sovereign
2.3
0.0
2.1
(1.2)
(0.5)
2.7
$0.9
$0.0
$3.7
($1.3)
($0.2)
$3.1
Sovereign
0.0
0.0
0.1
0.0
(0.1)
0.0
Non-sovereign
0.9
0.0
3.6
(1.3)
(0.1)
3.1
$6.3
$0.4
$18.2
($5.7)
($5.1)
$14.1
Spain
Italy
Other (Ireland, Portugal,
and Greece)
Total firmwide exposure
$14.1B total firmwide net exposure as of 2Q13, up from $12.3B as of 1Q13
During 2Q13, net exposure increased due to roll-off of tranched index positions
The impact of the roll-off was ~$4B increase in exposure
The Firm continues to be active with clients in the region
APPENDIX
1
Exposure is a risk management view. Lending is net of liquid collateral. Trading includes net inventory, derivative netting under legally enforceable trading agreements, net
CDS underlying exposure from market-making flows, unsecured net derivative receivables and under-collateralized securities financing counterparty exposure
17
19. Consumer credit – Delinquency trends1
Home Equity delinquency trend ($mm)
$3,500
30 – 149 day delinquencies
Prime Mortgage delinquency trend ($mm)
150+ day delinquencies
$4,000
30 – 149 day delinquencies
150+ day delinquencies
$3,000
$3,000
$2,500
$2,000
$2,000
$1,500
$1,000
$1,000
$500
$0
Sep-09 Feb-10
Jul-10
$0
Sep-09 Feb-10
Dec-10 May-11 Oct-11 Mar-12 Aug-12 Jan-13 Jun-13
Credit card delinquency trend2,3 ($mm)
Subprime Mortgage delinquency trend ($mm)
$3,000
30 – 149 day delinquencies
Jul-10 Dec-10 May-11 Oct-11 Mar-12 Aug-12 Jan-13 Jun-13
150+ day delinquencies
$11,000
$2,500
30-89 day delinquencies
$9,500
$2,000
30+ day delinquencies
$8,000
$6,500
$1,500
$5,000
$1,000
$3,500
$500
$2,000
APPENDIX
$0
Sep-09 Feb-10 Jul-10 Dec-10 May-11 Oct-11 Mar-12 Aug-12 Jan-13 Jun-13
$500
Sep-09 Feb-10 Jul-10
Dec-10 May-11 Oct-11 Mar-12 Aug-12 Jan-13 Jun-13
Note: Prime Mortgage excludes held-for-sale, Asset Management and Government Insured loans
purchased credit-impaired loans
2 Credit card delinquencies prior to January 1, 2010 included certain reclassification adjustments that assumed credit card loans securitized by Card Services remained on the balance sheet
3 “Payment holiday” in 2Q09 impacted delinquency trends in 3Q09
1 Excluding
18
20. Real Estate Portfolios and Card Services – Coverage ratios
Real Estate Portfolios and Card Services credit data ($mm)
O/(U)
1
2Q13
Adjusted
2Q12
1Q13
2Q12
Real Estate Portfolios (NCI)
Net charge-offs
$288
$448
$696
NCO rate
1.00%
1.56%
2.21%
Allowance for loan losses
LLR/annualized NCOs
$3,268
2
$4,218
284%
($408)
(121)bps
$6,468
235%
($3,200)
232%
Card Services
Net charge-offs
NCO rate3
$1,014
Allowance for loan losses
$4,445
3.31%
LLR/annualized NCOs 2
1
$1,082
$1,254
3.55%
4.03%
$4,998
110%
($240)
1
(72)bps
$5,499
115%
($1,054)
110%
NCOs ($mm)
$5,000
Real Estate Portfolios
4,512
Card Services
3,721
$4,000
3,133
2,671
$3,000
2,226
2,075
$2,000
1,810
1,372
1,214
1,157
4
1,076
$1,000
954
1,499
1,390
1,386
899
876
808
1,254 1
696
1,116
5955
1,097
1,082
1,014
520
448
288
4Q12
1Q13
2Q13
6
$0
1Q10
2Q10
3Q10
4Q10
1Q11
2Q11
3Q11
4Q11
APPENDIX
1
1Q12
2Q12
3Q12
2Q12 adjusted net charge-offs for Card Services were $1,254mm or 4.03%; excluding the effect of a change in charge-off policy for troubled debt restructurings, 2Q12 reported net charge-offs were $1,345mm or 4.32%
Net charge-offs annualized (NCOs are multiplied by 4)
See note 5 on slide 22
4 4Q10 adjusted net charge-offs exclude a one-time $632mm adjustment related to the timing of when the Firm recognizes charge-offs on delinquent loans
5 3Q12 adjusted net charge-offs and adjusted net charge-off rate for Real Estate Portfolios exclude the effect of an incremental $825mm of net charge-offs based on regulatory guidance
6 4Q12 adjusted net charge-offs and adjusted net charge-off rate reflect a full quarter of normalized Chapter 7 Bankruptcy discharge activity, which exclude one-time adjustments related to the adoption of Chapter 7
Bankruptcy discharge regulatory guidance
2
3
19
21. Firmwide – Coverage ratios
$mm
Loan loss reserve/Total loans1
Loan loss reserve
Loan loss reserve/NPLs1
Nonperforming loans
5.00%
500%
4.00%
400%
28,520
3.00%
28,350
300%
27,609
25,871
23,791
22,824
21,936
2.00%
1.00%
11,928
11,005
9,993
10,605
10,068
11,370
3Q11
4Q11
1Q12
2Q12
3Q12
0.00%
2Q11
2Q13
1Q13
2Q12
2.16%
2.56%
3.47%
58
66
2
100%
10,426
1Q13
2
9,734
2Q13
2
0%
3.58%
4.10%
4.41%
1.38%
1.33%
1.46%
424
332
241
2.06%
2.27%
2.74%
96
98
127
143
146
down ~$4.4B from $23.8B in the prior year,
reflecting improved portfolio credit quality
102
183
Consum er, ex. credit card
LLR/NPLs 2
4Q12
200%
19,384
$19.4B of loan loss reserves at June 30, 2013,
JPM credit summary
LLR/Total loans
2
10,720
20,780
Loan loss coverage ratio of 2.06%1
Credit Card
LLR/Total loans
Wholesale
LLR/Total loans
LLR/NPLs
Firm w ide
APPENDIX
LLR/Total loans
LLR /NPLs (ex. credit card) 2
LLR /NPLs 2
1 See
2
note 2 on slide 22
NPLs at 2Q13, 1Q13, 4Q12 and 3Q12 include $1.9B, $1.9B, $1.8B and $1.7B, respectively, in accordance with regulatory guidance requiring loans discharged under Chapter 7 bankruptcy and not
reaffirmed by the borrower, regardless of their delinquency status, to be reported as nonaccrual loans. In addition, the Firm’s policy is generally to exempt credit card loans from being placed on
nonaccrual status as permitted by regulatory guidance
20
22. IB League Tables
League table results
1H13
Rank
For 1H13, JPM ranked:
FY12
Share Rank
Share
#1 in Global Debt, Equity & Equity-related
Based on fees:
1
Global IB fees
1
8.9%
1
7.5%
#1 in Global Long-term Debt
#2 in Global Equity & Equity-related; #1 in
Based on volumes:
Global Debt, Equity & Equity-related
1
7.4%
1
7.2%
US Debt, Equity & Equity-related
1
11.7%
1
11.5%
Global Long-term Debt2
1
7.4%
1
7.1%
US Long-term Debt
1
11.9%
1
11.6%
Global Equity & Equity-related3
2
7.5%
4
7.8%
US Equity & Equity-related
3
11.6%
5
10.4%
Global M&A Announced4
2
24.3%
2
19.8%
US M&A Announced
1
37.6%
2
24.3%
Global Loan Syndications
1
10.0%
1
9.6%
US Loan Syndications
APPENDIX
#1 in Global IB fees
1
17.3%
1
17.6%
Source: Dealogic. Global Investment Banking fees reflects ranking of fees and market share. Remainder of
rankings reflects transaction volume rank and market share. Global announced M&A is based on
transaction value at announcement; because of joint M&A assignments, M&A market share of all
participants will add up to more than 100%. All other transaction volume-based rankings are based on
proceeds, with full credit to each book manager/equal if joint
1 Global Investment Banking fees rankings exclude money market, short-term debt and shelf deals
2 Long-term debt rankings include investment-grade, high-yield, supranational, sovereigns, agencies,
covered bonds, asset-backed securities (“ABS”) and mortgage-backed securities; and exclude money
market, short-term debt, and U.S. municipal securities
3 Global Equity and equity-related ranking includes rights offerings and Chinese A-Shares
4 Announced M&A reflects the removal of any withdrawn transactions. U.S. announced M&A represents any
U.S. involvement ranking
21
Global Equity Wallet
#2 in Global M&A Announced
#1 in Global Loan Syndications
23. Notes
Notes on non-GAAP financial measures
In addition to analyzing the Firm’s results on a reported basis, management reviews the Firm’s results and the results of the lines of business on a “managed” basis,
which is a non-GAAP financial measure. The Firm’s definition of managed basis starts with the reported U.S. GAAP results and includes certain reclassifications to
present total net revenue for the Firm (and each of the business segments) on a fully taxable-equivalent (“FTE”) basis. Accordingly, revenue from investments that
receive tax credits and tax-exempt securities is presented in the managed results on a basis comparable to taxable securities and investments. This non-GAAP financial
measure allows management to assess the comparability of revenue arising from both taxable and tax-exempt sources. The corresponding income tax impact related to
tax-exempt items is recorded within income tax expense. These adjustments have no impact on net income as reported by the Firm as a whole or by the lines of
business.
2.
The ratio of the allowance for loan losses to end-of-period loans excludes the following: loans accounted for at fair value and loans held-for-sale; purchased creditimpaired (“PCI”) loans; and the allowance for loan losses related to PCI loans. Additionally, Real Estate Portfolios net charge-off rates exclude the impact of PCI loans.
3.
Tangible common equity (“TCE”) represents common stockholders’ equity (i.e., total stockholders’ equity less preferred stock) less goodwill and identifiable intangible
assets (other than MSRs), net of related deferred tax liabilities. Return on tangible common equity measures the Firm’s earnings as a percentage of average TCE.
Tangible book value per share represents the TCE divided by the period-end number of common shares. In management’s view, these measures are meaningful to the
Firm, as well as to analysts and investors, in assessing the Firm’s use of equity and in facilitating comparisons with peers.
4.
The Tier 1 common ratio under both Basel I and Basel III are both non-GAAP financial measures. These measures are used by management, bank regulators, investors
and analysts to assess the Firm's capital position and to compare the Firm's capital to that of other financial services companies. The Basel I Tier 1 common ratio is Tier
1 common capital divided by Basel I risk-weighted assets. Tier 1 common capital is defined as Tier 1 capital less elements of Tier 1 capital not in the form of common
equity, such as perpetual preferred stock, noncontrolling interests in subsidiaries, and trust preferred securities. In July 2013, the U.S. Federal Reserve approved the
final rule for implementing Basel III in the United States. For further information on Basel I and Basel III, see Regulatory capital on pages 117-119 and 42-45 of
JPMorgan Chase& Co.’s Annual Report on Form 10-K for the year ended December 31, 2012, and Quarterly Report on Form 10-Q for the quarter ended March 31,
2013, respectively.
5.
In Consumer & Community Banking, supplemental information is provided for Card Services to enable comparability with prior periods. The change in net income is
presented excluding the change in the allowance, which assumes a tax rate of 38%. The net charge-off rate and 30+ day delinquency rate presented include loans
held-for-sale.
6.
In addition to reviewing JPMorgan Chase's net interest income on a managed basis, management also reviews core net interest income to assess the performance of
its core lending, investing (including asset-liability management) and deposit-raising activities (which excludes the impact of Corporate & Investment Bank's ("CIB")
market-based activities). The core net interest data presented are non-GAAP financial measures due to the exclusion of CIB"s market-based net interest income and
the related assets. Management believes this exclusion provides investors and analysts a more meaningful measure by which to analyze the non-market-related
business trends of the Firm and provides a comparable measure to other financial institutions that are primarily focused on core lending, investing and deposit-raising
activities.
7.
FINANCIAL RESULTS
1.
CIB provides several non-GAAP financial measures which exclude the impact of DVA. These measures are used by management to assess the underlying performance
of the business. The ratio for the allowance for loan losses to period-end loans is calculated excluding the impact of trade finance loans and consolidated Firmadministered multi-seller conduits, to provide a more meaningful assessment of CIB’s allowance coverage ratio.
Additional notes on financial measures
8.
Headcount-related expense includes salary and benefits (excluding performance-based incentives), and other noncompensation costs related to employees.
9.
Pretax margin represents income before income tax expense divided by total net revenue, which is, in management’s view, a comprehensive measure of pretax
performance derived by measuring earnings after all costs are taken into consideration. It is, therefore, another basis that management uses to evaluate the
performance of Asset Management against the performance of its respective peers.
22
24. Forward-looking statements
FINANCIAL RESULTS
This presentation contains forward-looking statements within the meaning of the Private Securities
Litigation Reform Act of 1995. These statements are based on the current beliefs and expectations
of JPMorgan Chase & Co.’s management and are subject to significant risks and uncertainties.
Actual results may differ from those set forth in the forward-looking statements. Factors that could
cause JPMorgan Chase & Co.’s actual results to differ materially from those described in the
forward-looking statements can be found in JPMorgan Chase & Co.’s Annual Report on Form 10-K
for the year ended December 31, 2012, and Quarterly Report on Form 10-Q for the quarter ended
March 31, 2013, which have been filed with the Securities and Exchange Commission and are
available on JPMorgan Chase & Co.’s website (http://investor.shareholder.com/jpmorganchase),
and on the Securities and Exchange Commission’s website (www.sec.gov). JPMorgan Chase &
Co. does not undertake to update the forward-looking statements to reflect the impact of
circumstances or events that may arise after the date of the forward-looking statements.
23