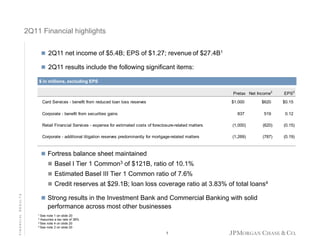
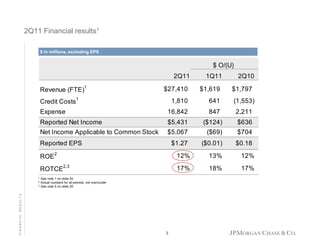
1. In 2Q11, JPMorgan Chase reported net income of $5.4 billion on revenue of $27.4 billion, with EPS of $1.27 per share.
2. Significant items impacting results included a $1 billion benefit from reduced loan loss reserves in Card Services, $620 million in securities gains in Corporate, a $1 billion expense for estimated foreclosure costs in Retail Financial Services, and $787 million in additional litigation reserves in Corporate.
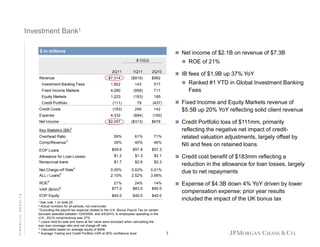
3. The Investment Bank reported net income of $2.1 billion on revenue of $7.3 billion, with strong performance across most businesses. Retail Financial Services reported a net loss of $454 million due to
The document summarizes JPMorgan Chase's financial results for the first quarter of 2011. Key highlights include:
- Net income of $5.6 billion and earnings per share of $1.28.
- Card Services reported net income of $1.3 billion compared to a net loss in the prior year, driven by lower credit costs.
- The Investment Bank reported net income of $2.4 billion on revenues of $8.2 billion, with strong fixed income and equity markets revenue.
- Retail Financial Services reported a net loss of $937 million in its mortgage banking business due to losses from mortgage servicing rights.
- In 3Q11, JPMorgan Chase reported net income of $4.3 billion and earnings per share of $1.02. Revenue for the quarter was $24.4 billion.
- The Investment Bank contributed net income of $1.6 billion on revenue of $6.4 billion, which included $1.9 billion in DVA gains.
- Retail Financial Services reported net income of $1.2 billion, with credit costs of $1 billion reflecting continued losses in mortgage and home equity portfolios.
- Mortgage Production and Servicing reported net income of $205 million, with production revenue of $1.3 billion and servicing revenue of $1.2 billion
The document summarizes JPMorgan Chase's 2Q09 financial results. Key highlights include:
- Net income of $2.7 billion and earnings per share of $0.28.
- Record firmwide revenue of $27.7 billion for the first half of 2009.
- Maintained a strong capital position with a Tier 1 capital ratio of 9.7% and Tier 1 common ratio of 7.7%.
- Extended $150 billion in new credit and approved 138,000 mortgage modifications in 2Q09.
JPMorgan Chase First Quarter 2008 Financial Results Conference Call finance2
1) JPMorgan Chase reported earnings of $2.4 billion on revenue of $17.9 billion for 1Q08, down 49% from record earnings in 1Q07. EPS was $0.68.
2) The Investment Bank took markdowns of $2.6 billion related to subprime, Alt-A, prime mortgages, and leveraged lending commitments. It reported a net loss of $87 million on revenue of $3 billion, down 52% year-over-year.
3) The firm increased its credit reserves by $2.5 billion, including $1.1 billion related to the home equity portfolio. It transferred $4.9 billion of lever
Retail Financial Services reported net income of $1.0 billion compared to $15 million in the prior year. Mortgage Banking and Other Consumer Lending net income was $364 million, up 55% year-over-year. The Investment Bank reported net income of $1.4 billion on revenue of $6.3 billion with a return on equity of 14%. Card Services reported net income of $343 million compared to a net loss of $672 million in the prior year, with credit costs down year-over-year.
The document provides 3Q19 financial highlights for JPMorgan Chase & Co. Key points include:
- Net income of $9.1B and EPS of $2.68 for 3Q19. Record managed revenue of $30.1B.
- Strong capital return to shareholders with $9.6B distributed, including $6.7B of net share repurchases.
- Basel III CET1 capital of $188B and CET1 ratio of 12.3%.
- Business segments all reported net income, with CCB at $4.3B, CIB at $2.8B, CB at $937MM, and AWM at $668MM
The document provides financial results for 3Q09. Key highlights include:
- Net income of $3.6 billion and EPS of $0.82, with strong earnings in the Investment Bank.
- Credit costs remain high at $9.8 billion as consumer credit reserves were added.
- Capital levels were further strengthened with Tier 1 Common ratio of 8.2% and Tier 1 Capital ratio of 10.2%.
JPMorgan Chase reported third quarter 2010 net income of $4.4 billion. Key highlights included a $930 million reduction to loan loss reserves in card services and increases of $776 million and $622 million to litigation and mortgage repurchase reserves, respectively. Several business segments reported solid results, with the investment bank ranked number one for the year in global fees and the retail bank seeing increased mortgage production and deposit margins. Credit costs declined across most businesses from reduced net charge-offs.
JPMorgan Chase First Quarter 2008 Financial Results Conference Call finance2
JPMorgan Chase reported net income of $2.4 billion for the first quarter of 2008, down 49% from $4.8 billion in the first quarter of 2007. Earnings per share were $0.68, down from $1.34 the previous year. The Investment Bank saw declines in revenue and increases in credit losses. Retail Financial Services increased revenue but also significantly increased its provision for credit losses due to deterioration in home equity and subprime portfolios. JPMorgan Chase maintained a strong capital position despite challenges in the market and credit environment.
The Investment Bank generated strong net income of $2.5 billion on revenue of $8.3 billion in 1Q10. Fixed Income Markets revenue was $5.5 billion, up 12% year-over-year. Retail Financial Services reported a net loss of $131 million compared to net income of $474 million in 1Q09, driven by a $1.3 billion net loss in the Real Estate Portfolios. Card Services reported a net loss of $303 million compared to a net loss of $547 million in 1Q09, as credit costs declined but remained elevated.
The Bank of New York Mellon Fourth Quarter 2008 Financial Resultsearningsreport
The Bank of New York Mellon Corporation reported earnings per share of $0.05 for the fourth quarter of 2008, down from $0.61 in the fourth quarter of 2007. Revenue was impacted by $1.24 billion in securities write-downs due to deteriorating market conditions. Expenses were well-controlled despite a $181 million restructuring charge. The company maintained strong capital ratios with Tier 1 capital at 13.1% as of December 31, 2008.
- JPMorgan Chase reported net income of $2.1 billion for Q1 2009, driven by record revenue in the investment bank but higher credit costs.
- The investment bank had its best quarter ever with net income of $1.6 billion on record revenue of $8.3 billion from strong fixed income and equity trading. However, markdowns on leveraged loans totaled $711 million.
- Retail banking profits grew 58% to $863 million due to higher deposits and fees from the Washington Mutual acquisition, while consumer lending lost $389 million due to increased loan losses.
JPMorgan Chase Second Quarter 2008 Financial Results Conference Callfinance2
JPMorgan Chase reported net income of $2.0 billion for Q2 2008, down 55% from the prior year. Earnings per share were $0.54. While several businesses saw growth, losses increased significantly in the mortgage and credit card portfolios, and markdowns were taken on leveraged loans and mortgage-related positions. The firm also completed its acquisition of Bear Stearns during the quarter.
- Bank of America reported a net loss of $1 billion for Q3 2009, driven by $3 billion in pre-tax charges and a $402 million charge to terminate an asset guarantee.
- Capital levels and liquidity improved, with the Tier 1 capital ratio rising to 12.46% and cash/equivalents totaling over $152 billion.
- Deposit growth continued with average retail deposits up $7.8 billion, while mortgage banking income declined on lower production volumes.
- Credit costs remained elevated though losses showed signs of stabilizing, with nonperforming assets up 9% compared to 21% in Q2 2009.
AmeriServ Financial reported net income of $533,000 for Q1 2009, down 56.6% from $1,229,000 in Q1 2008. Earnings per share were $0.01 down from $0.06. While net interest income grew 20.9% due to loan and deposit growth, higher loan loss provisions related to the economic environment caused earnings to decline. Non-performing assets were $5.1 million or 0.70% of total loans, up slightly from the previous quarter.
5
J.P. Morgan Chase & Co. reported second quarter 2009 net income of $2.7 billion, up 36% from the prior year. Revenue was a record $27.7 billion. The Investment Bank reported record revenue for the first half of 2009, including record fees and fixed income markets revenue. Retail Financial Services saw higher revenue due to the Washington Mutual acquisition, but a higher provision for credit losses led to a net loss. JPMorgan maintained a strong capital position with Tier 1 capital of $122.2 billion after repaying $25 billion in TARP funds.
This document provides instructions for setting a calendar appointment in Microsoft Outlook. It outlines 8 steps: 1) open Outlook, 2) browse months on the calendar, 3) select a date, 4) double click a time, 5) edit start and end times, 6) add a subject, 7) add a location, and 8) click save and close to save the appointment.
Este documento trata sobre la sexualidad en la adolescencia. Explica que la sexualidad es parte del desarrollo normal de los niños y adolescentes. Detalla algunos aspectos de la sexualidad en la adolescencia como las fantasías sexuales y los primeros contactos físicos. También advierte sobre los peligros de la sexualidad en los adolescentes como el embarazo prematuro y las enfermedades de transmisión sexual. Resalta la importancia de hablar sobre cuidados sexuales para evitar embarazos no deseados e infecciones.
JPMorgan Chase reported third quarter 2009 net income of $3.6 billion, an increase from $527 million in third quarter 2008. Revenue was $28.8 billion, a record year-to-date. Credit costs remained high at $31.5 billion and the firm added $2 billion to consumer credit reserves. The firm's capital levels were strengthened with Tier 1 Common at $101 billion and ratios of 8.2% and 10.2% respectively. While signs of credit stability emerged, continued uncertainty led to higher reserves. The firm's strong capital position will enable continued investment despite this uncertainty.
Jonathan moore determinations – past, present and futureArchDesSco
This document discusses determinations made by the Scottish Government regarding school closure proposals. It notes that differing interpretations of the 2010 Act have led to many cases being called in. The aim is to significantly reduce the number of cases requiring to be called in by improving the quality of proposals. Key drivers for change include experience applying the 2010 Act, a report by the Rural Commission, and a recent judicial review. The document outlines how determinations and decisions will now be made, focusing on whether education authorities have properly followed the 2010 Act and considered all relevant factors. While the recent court ruling provides clarity, amendments to the 2010 Act may still be needed to fully address the issues.
This document is a sample from an instructor-led course on practical programming with C# 3.0. It provides an overview of the course contents, including chapters on C#, .NET, objects, properties, indexers, operator overloading, and conversions. The document encourages following principles of encapsulation and avoiding unnecessary complexity through practices like operator overloading and implicit conversions.
This document summarizes a study of CEO succession events among the largest 100 U.S. corporations between 2005-2015. The study analyzed executives who were passed over for the CEO role ("succession losers") and their subsequent careers. It found that 74% of passed over executives left their companies, with 30% eventually becoming CEOs elsewhere. However, companies led by succession losers saw average stock price declines of 13% over 3 years, compared to gains for companies whose CEO selections remained unchanged. The findings suggest that boards generally identify the most qualified CEO candidates, though differences between internal and external hires complicate comparisons.
The document summarizes JPMorgan Chase's financial results for the first quarter of 2011. Key highlights include:
- Net income of $5.6 billion and earnings per share of $1.28.
- Card Services reported net income of $1.3 billion compared to a net loss in the prior year, driven by lower credit costs.
- The Investment Bank reported net income of $2.4 billion on revenues of $8.2 billion, with strong fixed income and equity markets revenue.
- Retail Financial Services reported a net loss of $937 million in its mortgage banking business due to losses from mortgage servicing rights.
The document summarizes JPMorgan Chase's financial results for the first quarter of 2011. Key highlights include:
- Net income of $5.6 billion and earnings per share of $1.28. Revenue was $25.8 billion.
- Significant items that impacted results were a $2 billion benefit from lower credit card loan loss reserves, a $1.1 billion loss from mortgage servicing rights adjustments, and a $650 million expense for estimated foreclosure costs.
- The balance sheet was strengthened with a Basel I Tier 1 Common ratio of 10% and estimated Basel III Tier 1 Common of 7.3%. Credit reserves totaled $30.4 billion.
The document summarizes JPMorgan Chase's financial results for the first quarter of 2011. Key highlights include:
- Net income of $5.6 billion and earnings per share of $1.28. Revenue was $25.8 billion.
- Significant items that impacted results were a $2 billion benefit from reduced credit card loan loss reserves in Card Services, a $1.1 billion loss from mortgage servicing rights asset adjustments in Retail Financial Services, and a $650 million expense for estimated costs of foreclosure matters in Retail Financial Services.
- The Investment Bank generated net income of $2.4 billion on revenue of $8.2 billion, with strong performance in fixed income and
EOP Loans & Leases
Avg Deposits
FINANCIAL RESULTS
1
Actual numbers for all periods, not over/under
2 Calculated based on average equity; 3Q09 average equity was $2B
3 Excludes loans held-for-sale and loans at fair value
4 Calculated based on average equity; 3Q09 average equity was $2B
8
Total revenue of $1.5B up 4% YoY driven by growth in
Middle Market Banking and Real Estate Banking, partially
offset by lower Commercial Term Lending revenue
Credit costs of $43mm reflect higher net charge-offs
Expense up 10
EOP Loans & Leases
Avg Deposits
FINANCIAL RESULTS
1
Actual numbers for all periods, not over/under
2 Calculated based on average equity; 3Q09 average equity was $2B
3 Excludes loans held-for-sale and loans at fair value
4 Calculated based on average equity; 3Q09 average equity was $2B
8
Total revenue of $1.5B up 335% YoY driven by the
impact of the WaMu transaction and wider loan spreads
Middle Market Banking revenue up $729mm YoY due to
the WaMu transaction
Credit costs of $43mm reflect higher net
The document summarizes JPMorgan Chase's 2Q09 financial results. Key highlights include:
- Net income of $2.7 billion and earnings per share of $0.28.
- Record firmwide revenue of $27.7 billion for the first half of 2009.
- Maintained a strong capital position with a Tier 1 capital ratio of 9.7% and Tier 1 common ratio of 7.7%.
- Extended $150 billion in new credit and approved 138,000 mortgage modifications in 2Q09.
Retail Financial Services reported net income of $1.0 billion compared to $15 million in the prior year. Mortgage Banking and Other Consumer Lending net income was $364 million, up 55% year-over-year. The Investment Bank reported net income of $1.4 billion on revenue of $6.3 billion with a return on equity of 14%. Card Services reported net income of $343 million compared to a net loss of $672 million in the prior year, with credit costs down year-over-year.
- JPMorgan Chase reported first quarter 2009 net income of $2.1 billion, down from $1.4 billion in the prior quarter. Revenue was a record $26.9 billion, driven by record results in the Investment Bank.
- The Investment Bank generated record revenue of $8.3 billion and net income of $1.6 billion. Fixed income markets and equity markets performed strongly. Credit portfolio revenue was $299 million.
- Retail Financial Services reported net income of $474 million, rebounding from a net loss in the prior quarter, as deposit growth and wider spreads boosted results. Consumer lending reported a net loss of $389 million on higher credit costs.
- Key risks included $
1Q08
4Q07
1Q07
EOP owned portfolio ($B)
$15.8
$13.7
$8.9
Net charge-offs ($mm)
$417
$211
$38
Net charge-off rate
10.64%
7.81%
1.72%
30+ day delinquency rate
21.14%
16.56%
7.72%
1. JPMorgan Chase reported earnings of $2.4 billion for the first quarter of 2008, down 49% from record earnings in the first
JPMorgan Chase reported third quarter 2010 net income of $4.4 billion. Key highlights included a $930 million reduction to loan loss reserves in card services and increases of $776 million and $622 million to litigation and mortgage repurchase reserves, respectively. Several business segments reported solid results, with the investment bank ranked number one for the year in global fees and the retail bank seeing growth in deposits and mortgage originations. Credit costs declined across most businesses from reduced charge-offs.
JPMorgan Chase reported third quarter 2010 net income of $4.4 billion. Key highlights included a $930 million reduction to loan loss reserves in card services and increases of $776 million and $622 million to litigation and mortgage repurchase reserves, respectively. Several business segments reported solid results, with the investment bank ranked number one for the year in global fees and the commercial bank completing a $3.5 billion loan portfolio purchase. Credit costs declined across most businesses as credit quality continued to improve.
JPMorgan Chase reported third quarter 2010 net income of $4.4 billion and earnings per share of $1.01. Key business segments performed well, with the Investment Bank ranked #1 in global fees year-to-date, and Retail Financial Services reporting strong mortgage production. Credit costs decreased from reductions to loan loss reserves. However, increases to litigation reserves partially offset these gains. Overall, the company delivered solid results while continuing investments across its businesses.
JPMorgan Chase reported third quarter 2010 net income of $4.4 billion and earnings per share of $1.01. Key business segments performed well, with the Investment Bank ranked #1 in global fees year-to-date, and Retail Financial Services reporting strong mortgage production. Credit costs declined from reductions to loan loss reserves. However, increases to litigation reserves reduced earnings. Overall, the company delivered solid results with improved credit performance.
The Investment Bank generated strong net income of $2.5 billion on revenue of $8.3 billion in 1Q10. Fixed Income Markets revenue was $5.5 billion, up 12% year-over-year. Retail Financial Services reported a net loss of $131 million compared to net income of $474 million in 1Q09, driven by a $1.3 billion net loss in the Real Estate Portfolios. Card Services reported a net loss of $303 million compared to a net loss of $547 million in 1Q09, as credit costs declined but remained elevated.
5
J.P. Morgan Chase & Co. reported second quarter 2009 net income of $2.7 billion, up 36% from the prior year. Revenue was a record $27.7 billion. The Investment Bank reported record revenue for the first half of 2009, including record fees and fixed income markets revenue. Retail Financial Services earnings were reduced by high credit costs, though revenue increased 56% due to the Washington Mutual acquisition. JPMorgan maintained a strong capital position with Tier 1 capital of $122.2 billion.
- Discover Financial reported diluted EPS of $1.47 for 2Q16, up 11% YOY, including a one-time $0.11 tax benefit. Revenue was $2.2 billion, up 2% YOY, as higher net interest income was offset by higher rewards expenses and lack of mortgage income. Provision for loan losses increased 35% to $412 million due to loan growth and a $28 million reserve build.
The document reports on the bank's 2Q16 earnings results. It discusses solid business performance in a challenging quarter, with total quarterly credit disbursements up and stable net margins. However, net profit decreased QoQ due to higher credit provisions to address isolated restructuring cases and recovery efforts. Asset quality remains strong and the syndications platform executed five new deals in Q2. The outlook for the remainder of the year is positive with economic stabilization and projected portfolio growth of around 3% for 2016 and stable net interest margin of around 2%. Key financial metrics such as earnings per share, return on equity and assets, efficiency ratio and capital ratios are reported.
The document summarizes the financial results of a bank for the second quarter of 2012. Some key highlights include:
- Recurring net income reached R$3.6 billion, an 8.1% increase over the second quarter of 2011.
- The loan portfolio grew 3.6% over the previous quarter to R$432.7 billion, a 15.2% increase from a year ago.
- Non-interest expenses increased 3.2% over the previous quarter and operating revenues grew 1.8%.
- The 90-day non-performing loan ratio increased to 5.2% from the previous quarter.
Citigroup reported a 60% decline in third quarter net income to $2.21 billion compared to the prior year. Revenues increased 5% to $22.4 billion driven by 29% growth in international revenues, however this was more than offset by a $2.98 billion increase in credit costs. The revenue growth was primarily due to strong international consumer and wealth management results, while fixed income revenues declined significantly due to losses related to dislocations in the mortgage-backed securities and credit markets. Higher credit costs were the primary driver of the net income decline.
- JPMorgan Chase & Co. reported a net loss of $380 million for the third quarter of 2013 compared to net income of $6.496 billion for the second quarter of 2013.
- Total net revenue was $23.117 billion for the third quarter, down 8% from the prior quarter, driven by lower investment banking and mortgage fees and higher noninterest expense, including legal expense.
- The firm recorded a provision for credit losses of $543 million for the third quarter compared to $47 million in the prior quarter, reflecting a higher allowance for loan losses.
JPMorgan Chase reported third quarter 2011 net income of $4.3 billion, down slightly from $4.4 billion in third quarter 2010. Revenue was $24.4 billion. While the investment banking environment was challenging, JPMorgan maintained its #1 ranking for global investment banking fees year-to-date. Consumer & business banking reported higher revenue and deposits. Credit card sales volume was up 10% and net charge-offs declined as expected. The firm repurchased $4.4 billion in stock and maintained a Basel I Tier 1 ratio of 9.9% and estimated Basel III ratio of 7.7%.
JPMorgan Chase reported third quarter 2011 net income of $4.3 billion, down slightly from $4.4 billion in third quarter 2010. Revenue decreased due to challenging market conditions impacting the Investment Bank. The firm maintained its #1 ranking for Global Investment Banking Fees year-to-date. Consumer & Business Banking reported higher revenues and deposits compared to a year ago. Credit quality improved with lower credit card and wholesale credit losses, while mortgage losses remained elevated. The firm repurchased $4.4 billion in stock and estimated its Basel III Tier 1 ratio was 7.7% at the end of the third quarter.
JPMorgan Chase reported third quarter 2010 net income of $4.4 billion, up 23% from the third quarter of 2009. Revenue was $24.3 billion. The Investment Bank reported solid earnings and maintained its #1 ranking for global investment banking fees and global debt/equity. Retail Financial Services had strong mortgage production and continued branch expansion. Card Services saw increased sales volume and improved credit trends. Commercial Banking reported record revenue. Asset Management had $38 billion in net inflows. Credit costs declined but mortgage and credit card losses remained high. The Firm's capital and credit reserves remained strong.
- Total net revenue for JPMorgan Chase & Co. in the third quarter of 2009 was $26.6 billion, up 4% from the previous quarter and up 81% from the third quarter of 2008.
- Net income was $3.6 billion, up 32% from the third quarter of 2008.
- Earnings per share were $0.82, up 193% from the third quarter of 2008.
JPMorgan Chase reported second quarter 2013 net income of $6.5 billion, down from $5 billion in the second quarter of 2012. Revenue was $26 billion, up from $22.9 billion the prior year. Return on tangible common equity was 17%, up from 15% in 2012. Consumer & Community Banking saw deposit growth of 10% and record credit card sales volume of $105.2 billion, though net income fell to $3.1 billion due to lower revenue and higher expenses. Mortgage originations increased 12% to $49 billion while net income fell to $1.1 billion on lower revenue.
- JPMorgan Chase reported net income of $6.5 billion for 2Q13, with EPS of $1.60. Revenue was $26.0 billion.
- Key business segments like Consumer & Business Banking and Mortgage Banking remained strong, while the company continued to strengthen its balance sheet.
- The company saw improvements in its Basel III Tier 1 common capital ratio to 9.3% and maintained solid returns on equity and assets.
The document is a financial supplement from JPMorgan Chase & Co. for the second quarter of 2011. It includes:
- Consolidated financial highlights such as total net revenue, net income, earnings per share, and capital ratios for the second quarter of 2011 compared to previous quarters.
- Business segment results for the second quarter of 2011 including net income for each line of business.
- Additional financial details such as credit related information, market risk information, and non-GAAP reconciliations.
- The supplement provides investors with JPMorgan Chase's key financial results to allow analysis of performance and comparisons to previous periods. It contains consolidated results, business segment results, and other financial details for
- JPMorgan Chase reported financial results for the second quarter of 2010 with net income of $4.8 billion, an increase of 44% compared to the same quarter in the prior year.
- Total net revenue was $25.1 billion for the quarter, a decrease of 2% from the prior year. Noninterest expenses increased 8% to $14.6 billion.
- The provision for credit losses decreased 58% to $3.4 billion from the second quarter of 2009, reflecting improved asset quality.
- JPMorgan Chase & Co. released its financial supplement for the second quarter of 2010 including consolidated results and business detail.
- Total net revenue was $25.1 billion for Q2 2010, down 9% from Q1 2010 but up 2% year-over-year. Net income was $4.8 billion for Q2 2010, up 44% from Q1 2010 and 76% year-over-year.
- By line of business, the Investment Bank and Commercial Banking saw the largest increases in net income quarter-over-quarter, while Retail Financial Services had a loss in Q1 2010 but profit in Q2 2010.
- JPMorgan Chase & Co. released its financial supplement for the second quarter of 2010 including consolidated results and business detail.
- Total net revenue was $25.1 billion for Q2 2010, down 9% from Q1 2010 but up 2% year-over-year. Net income was $4.8 billion for Q2 2010, up 44% from Q1 2010 and 76% year-over-year.
- By line of business, net income was highest for Investment Bank ($1.4 billion), Retail Financial Services ($1 billion), and Commercial Banking ($693 million) for Q2 2010.
- JPMorgan Chase & Co. released its financial supplement for the second quarter of 2010 including consolidated results and business detail.
- Total net revenue was $25.1 billion for Q2 2010, down 9% from Q1 2010 but up 2% year-over-year. Net income was $4.8 billion for Q2 2010, up 44% from Q1 2010 and 76% year-over-year.
- By line of business, the Investment Bank and Commercial Banking saw the largest increases in net income quarter-over-quarter, while Retail Financial Services had a loss in Q1 2010 but profit in Q2 2010.
- JPMorgan Chase & Co. released its financial supplement for the second quarter of 2010 including consolidated results and business detail.
- Total net revenue was $25.1 billion for Q2 2010, down 9% from Q1 2010 but up 2% year-over-year. Net income was $4.8 billion for Q2 2010, up 44% from Q1 2010 and 76% year-over-year.
- By line of business, the Investment Bank and Commercial Banking saw the largest increases in net income quarter-over-quarter, while Retail Financial Services had a loss in Q1 2010 but profit in Q2 2010.
JPMorgan Chase reported second quarter 2010 net income of $4.8 billion, up significantly from $2.7 billion in the second quarter of 2009. Revenue was $25.6 billion. While most businesses performed solidly with reduced credit costs, returns in consumer lending remained unacceptable. The bank maintained strong capital and liquidity positions. Looking ahead, Dimon noted regulatory reforms could impact clients and businesses, and implementation will require careful coordination.
The document is JPMorgan Chase & Co.'s earnings release for the second quarter of 2009. It reported net income of $2.7 billion for Q2 2009, up 27% from Q1 2009. Total net revenue was $25.6 billion for Q2 2009, up 2% from the previous quarter. The provision for credit losses was $8 billion for Q2 2009, down 7% from Q1 2009.
STREETONOMICS: Exploring the Uncharted Territories of Informal Markets throug...sameer shah
Delve into the world of STREETONOMICS, where a team of 7 enthusiasts embarks on a journey to understand unorganized markets. By engaging with a coffee street vendor and crafting questionnaires, this project uncovers valuable insights into consumer behavior and market dynamics in informal settings."
Solution Manual For Financial Accounting, 8th Canadian Edition 2024, by Libby...Donc Test
Solution Manual For Financial Accounting, 8th Canadian Edition 2024, by Libby, Hodge, Verified Chapters 1 - 13, Complete Newest Version Solution Manual For Financial Accounting, 8th Canadian Edition by Libby, Hodge, Verified Chapters 1 - 13, Complete Newest Version Solution Manual For Financial Accounting 8th Canadian Edition Pdf Chapters Download Stuvia Solution Manual For Financial Accounting 8th Canadian Edition Ebook Download Stuvia Solution Manual For Financial Accounting 8th Canadian Edition Pdf Solution Manual For Financial Accounting 8th Canadian Edition Pdf Download Stuvia Financial Accounting 8th Canadian Edition Pdf Chapters Download Stuvia Financial Accounting 8th Canadian Edition Ebook Download Stuvia Financial Accounting 8th Canadian Edition Pdf Financial Accounting 8th Canadian Edition Pdf Download Stuvia
Seminar: Gender Board Diversity through Ownership NetworksGRAPE
Seminar on gender diversity spillovers through ownership networks at FAME|GRAPE. Presenting novel research. Studies in economics and management using econometrics methods.
Vicinity Jobs’ data includes more than three million 2023 OJPs and thousands of skills. Most skills appear in less than 0.02% of job postings, so most postings rely on a small subset of commonly used terms, like teamwork.
Laura Adkins-Hackett, Economist, LMIC, and Sukriti Trehan, Data Scientist, LMIC, presented their research exploring trends in the skills listed in OJPs to develop a deeper understanding of in-demand skills. This research project uses pointwise mutual information and other methods to extract more information about common skills from the relationships between skills, occupations and regions.
5 Tips for Creating Standard Financial ReportsEasyReports
Well-crafted financial reports serve as vital tools for decision-making and transparency within an organization. By following the undermentioned tips, you can create standardized financial reports that effectively communicate your company's financial health and performance to stakeholders.
Falcon stands out as a top-tier P2P Invoice Discounting platform in India, bridging esteemed blue-chip companies and eager investors. Our goal is to transform the investment landscape in India by establishing a comprehensive destination for borrowers and investors with diverse profiles and needs, all while minimizing risk. What sets Falcon apart is the elimination of intermediaries such as commercial banks and depository institutions, allowing investors to enjoy higher yields.
1. Elemental Economics - Introduction to mining.pdfNeal Brewster
After this first you should: Understand the nature of mining; have an awareness of the industry’s boundaries, corporate structure and size; appreciation the complex motivations and objectives of the industries’ various participants; know how mineral reserves are defined and estimated, and how they evolve over time.
2. Elemental Economics - Mineral demand.pdfNeal Brewster
After this second you should be able to: Explain the main determinants of demand for any mineral product, and their relative importance; recognise and explain how demand for any product is likely to change with economic activity; recognise and explain the roles of technology and relative prices in influencing demand; be able to explain the differences between the rates of growth of demand for different products.
2. 2Q11 Financial highlights
2Q11 net income of $5.4B; EPS of $1.27; revenue of $27.4B1
2Q11 results include the following significant items:
$ in millions, excluding EPS
Pretax
Preta Net Income2
Card Services - benefit from reduced loan loss reserves
EPS2
$1,000
$0.15
837
Corporate - benefit from securities gains
$620
519
0.12
Retail Financial Services - expense for estimated costs of foreclosure-related matters
(1,000)
(620)
(0.15)
Corporate - additional litigation reserves predominantly for mortgage-related matters
(1,269)
(787)
(0.19)
Fortress balance sheet maintained
Basel I Tier 1 Common3 of $121B, ratio of 10.1%
Estimated Basel III Tier 1 Common ratio of 7.6%
FINANCIAL RESULTS
Credit reserves at $29 1B; loan loss coverage ratio at 3 83% of total loans4
$29.1B;
3.83%
Strong results in the Investment Bank and Commercial Banking with solid
performance across most other businesses
1 See
note 1 on slide 20
Assumes a tax rate of 38%
3 See note 4 on slide 20
4 See note 2 on slide 20
2
1
3. 2Q11 Financial results1
$ in millions, excluding EPS
$ O/(U)
2Q11
1
1Q11
2Q10
$27,410
$1,619
1,810
641
(1,553)
Expense
16,842
847
2,211
Reported Net Income
$5,431
$5 431
($124)
$636
Net Income Applicable to Common Stock
$5,067
($69)
$704
$1.27
($0.01)
$0.18
(
)
Revenue (FTE)
Credit Costs
1
Reported EPS
ROE
2
ROTCE
1
2
FINANCIAL RESULTS
3
$1,797
12%
See note 1 on slide 20
Actual numbers for all periods, not over/under
See t
S note 5 on slide 20
lid
2
12%
17%
2,3
13%
18%
17%
4. Investment Bank1
$ in millions
Net income of $2.1B on revenue of $7.3B
ROE of 21%
$ O/(U)
2Q11
1Q11
2Q10
$7,314
($919)
$982
Investment Banking Fees
1,922
143
517
Fixed Income Markets
4,280
(958)
717
Equity Markets
1,223
(183)
185
(111)
79
(437)
(183)
246
142
4,332
(684)
(190)
$2,057
(
($313)
)
Revenue
Credit Portfolio
Credit Costs
Expense
Net Income
IB fees of $1.9B up 37% YoY
Ranked #1 YTD in Global Investment Banking
Fees
Fixed Income and Equity Markets revenue of
$5.5B up 20% YoY reflecting solid client revenue
Credit Portfolio loss of $111mm, primarily
$676
reflecting the negative net impact of creditrelated valuation adjustments, largely offset by
NII and fees on retained loans
Key Statistics ($B)2
Overhead Ratio
59%
61%
71%
35%
40%
46%
$59.6
$57.8
$57.3
$1.2
$1 2
$1.3
$1 3
$2.1
$2 1
$1.7
$2.6
$2.3
0.05%
2.10%
0.93%
2.52%
0.21%
3.98%
VAR ($mm)
21%
$77.0
24%
$83.0
14%
$90.0
EOP Equity
$40.0
$40.0
$40.0
Comp/Revenue
3
EOP Loans
Allowance for Loan Losses
Nonaccrual loans
Net Charge-off Rate4
ALL / Loans4
ROE5
FINANCIAL RESULTS
6
C di cost b
Credit
benefit of $183
fi f $183mm reflecting a
fl i
reduction in the allowance for loan losses, largely
due to net repayments
Expense of $4.3B down 4% YoY driven by lower
compensation expense; prior year results
included the impact of the UK bonus tax
1 See
note 1 on slide 20
Actual numbers for all periods, not over/under
3 Excluding the payroll tax expense related to the U.K. Bonus Payroll Tax on certain
bonuses awarded between 12/9/2009, and 4/5/2010, to employees operating in the
U.K., 2Q10 comp/revenue was 37%
4 Loans held-for-sale and loans at fair value were excluded when calculating the
loan loss coverage ratio and net charge-off rate
5 Calculated based on average equity of $40B
6 Average Trading and Credit Portfolio VAR at 95% confidence level
2
3
5. Retail Financial Services1
$ in millions
Key drivers
$ O/(U)
1Q11
2Q11
2Q10
Average deposits of $356.4B up 6% YoY and
Retail Financial Services
Net Interest Income
$4,571
($59)
($246)
3,405
1,760
413
Revenue
$7,976
$1,701
$167
Expense
5,637
375
1,356
$2,339
$1,326
($1,189)
Credit Costs
1,128
(198)
(587)
Net Income
$582
$790
($460)
Noninterest Revenue
Pre-Provision Pretax
EOP Equity ($B)2
$28
$28
$28
ROE2,3
8%
(3)%
15%
2% QoQ
Checking accounts flat YoY and down 1% QoQ
g
Branch mortgage originations up 34% YoY and
11% QoQ
Business Banking originations up 29% YoY and
10% QoQ
Memo:
RFS Net Income Excl. Real Estate Portfolios
$648
$694
($630)
ROE Excl. Real Estate Portfolios 2,4
15%
(1)%
28%
n
2
Retail Banking — Key Drivers ($ in billions)
Average Deposits
$356.4
$348.1
2.87%
2.92%
3.05%
26.3
26.6
26.4
5,340
5,292
5,159
$1.6
$1.4
$1.2
Mortgage Banking, Auto & Other Consumer
Lending
$337.8
Deposit Margin
Checking Accounts (mm)
# of Branches
Business Banking Originations
2
Mortgage Banking, Auto & Other Consumer Lending — Key Drivers ($ in billions)
Mortgage Loan O i i i
M
L
Originations
$34.0
$34 0
$36.2
$36 2
$32.2
$32 2
FINANCIAL RESULTS
Retail Banking
3rd Party Mtg Loans Svc'd (EOP)
Auto Originations
Average Loans
$941
$955
$1,055
$5.4
$4.8
$5.8
$75.2
$76.1
$77.8
1
See note 1 on slide 20
Actual numbers for all periods, not over/under
3 C l
Calculated b
l d based on average equity of $28B
d
i
f
4 Calculated based on average equity; average equity for 2Q11, 1Q11 and 2Q10 was
$17.5B, $17.5B and $18.3B, respectively
2
4
Total originations of $39.4B:
Mortgage loan originations up 6% YoY and
down 6% QoQ
Auto originations down 7% YoY and up 13%
g
QoQ
6. Retail Financial Services
Retail Banking and Mortgage Banking Auto & Other Consumer Lending
Banking,
Retail Banking net income of $1.1B, up 21% YoY:
$ in millions
Total revenue of $4.6B up 5% YoY driven by
p
y
$ O/(U)
2Q11
1Q11
2Q10
Retail Banking
Net Interest Income
$2,707
$48
($5)
Noninterest Income
1,887
131
203
Revenue
$4,594
$179
$198
Expense
2,705
(97)
72
$1,889
$276
$126
42
(77)
(126)
$1,102
$211
$188
Pre-Provision Pretax
Credit Costs
Net Income
Mortgage Banking, Auto & Other Consumer Lending
Revenue (excl. MSR Risk Management)
MSR Risk Management
Revenue
Memo: Repurchase Losses (Contra-Revenue)
Expense
Pre-Provision Pretax
Credit Costs
C dit C t
Net Income
$2,142
$209
$405
23
1,260
higher debit card revenue, deposit-related fees
and investment sales revenue
Expense up 3% YoY resulting from investments
in sales force and new branch builds
Credit costs of $42mm down 75% YoY
do n
Annualized gross revenue impact from the
Durbin amendment is approximately $1.0B+/– No impact on 3Q11; expect full run-rate
impact in 4Q11
– Some mitigation expected over time
(288)
2,165
1,469
117
($223)
$197
$444
2,561
456
1,318
($396)
$1,013
($1,201)
132
1
(43)
($454)
$483
($818)
Mortgage Banking, Auto & Other Consumer
Lending reported a net loss of $454mm, compared
with net income of $364mm in the prior year:
Total revenue, excluding MSR risk management
results, of $2.1B up 23% YoY driven by lower
repurchase losses and wider margins
– Repurchase losses of $223mm, down 67%
YoY
FINANCIAL RESULTS
Expense up $1.3B from the prior year, including
$1.0B for estimated costs of foreclosure-related
matters
Credit costs of $132mm down 25% YoY
5
7. Retail Financial Services
Real Estate Portfolios
Net loss of $66mm compared with a net
$ in millions
loss of $236mm in the prior year
$ O/(U)
2Q11
Expense
2Q10
$1,217
Real Estate Portfolios
Revenue
1Q11
$53
($148)
371
16
(34)
Pre-Provision Pretax
$846
$37
($114)
Net Charge-Offs
954
(122)
(418)
Change in Allowance
Credit Costs
954
(122)
(418)
Net Income
($66)
$96
$170
6.90%
6.68%
7.01%
Memo: ALL/ EOP Loans 1,2
Total Average Loans
Average Mortgage Loans Owned3
$212.9
3
$219.7
$242.7
107.7
111.1
122.0
104.4
107.8
119.7
1
Actual numbers for all periods, not over/under
Excludes the impact of purchased credit-impaired loans acquired as part of the WaMu transaction. An
credit impaired
allowance for loan losses of $4.9B, $4.9B and $2.8B was recorded for these loans as of 2Q11, 1Q11 and
2Q10, respectively
3 Includes purchased credit-impaired loans acquired as part of the WaMu transaction
2
FINANCIAL RESULTS
YoY driven by a decline in net interest
income as a result of lower loan
balances largely offset by wider loan
spreads
Expense down 8% YoY reflecting a
decrease in foreclosed asset expense
Credit costs of $954mm down 30%
Key Drivers1 ($ in billions)
$
Average Home Equity Loans Owned
Total net revenue of $1.2B down 11%
6
YoY due to a reduction in net chargeoffs driven by modest improvement in
delinquency trends
8. Home Lending update
Delinquencies modestly improved in
Key statistics1
2Q11
EOP owned portfolio ($B)
Home Equity
Prime Mortgage, including option ARMs 2
Subprime Mortgage
Net h
N charge-offs ($
ff ($mm)
)
Home Equity
Prime Mortgage, including option ARMs
Subprime Mortgage
Total
3
1Q11
2Q10
$82.7
61.3
$85.3
62.6
$94.8
66.3
10.4
10.8
12.6
$592
$720
$796
196
165
286
156
186
282
$944 $1,071 $1,364
Net charge-off rate
Home Equity
Prime Mortgage, including option ARMs
2.83% 3.36% 3.32%
1.28% 1.06% 1.69%
Subprime Mortgage
p
g g
5.85% 6.80% 8.63%
Nonaccrual loans ($mm)
Home Equity
Prime Mortgage, including option ARMs
Subprime Mortgage
3
$1,308 $1,263 $1,211
3,947 4,093 4,594
2,058
2,106
3,115
FINANCIAL RESULTS
1
Excludes 2Q11 EOP home equity, prime mortgage, subprime mortgage and option ARMs
purchased credit-impaired loans of $23.5B, $16.2B, $5.2B and $24.1B respectively, acquired as
part of the WaMu transaction
2 Ending balances include all noncredit-impaired prime mortgage balances held by Retail Financial
Services, including $13.1B, $13.0B and $12.0B for 2Q11, 1Q11 and 2Q10, respectively, of loans
insured by U.S. government agencies. These loans are included in Mortgage Banking, Auto &
O e Co su e e d g
Other Consumer Lending
3 Net charge-offs and nonaccrual loans exclude loans insured by U.S. government agencies
7
Q
2Q11
Home equity and subprime mortgage
net charge-offs are down, while prime
mortgage net charge-offs are modestly
higher
hi h compared t 1Q11
d to
No changes in the allowance for loan
losses during the quarter
Home Lending loss guidance:
Expect total quarterly net charge-offs
of $1.2B+/-
9. 2Q11 mortgage-related risks and reserves
mortgage related
Real Estate Portfolios
Total reserves of $9 7B remain for the non-credit impaired portfolio
$9.7B
non credit
WaMu purchased credit-impaired portfolio reserves assume further HPI deterioration of 5%
– Incremental 5% decline in HPI would result in an additional $1.5B+/- to loan loss reserves
If credit trends continue to improve and economic uncertainty abates reserves may be reduced
GSE mortgage repurchase risk
t
h
i k
Realized repurchase losses life to date of $3.3B1
End of period reserve balance of $3.6B1; reserved for presented and probable future demands
2011 YTD realized losses $472mm1
$
Realized repurchase losses of $1.2B+/- annualized run-rate for remainder of 2011 in Retail
Financial Services
As we work through repurchase demands, agency-related reserves may be reduced over time
Foreclosure delays and related issues
Added $1B to previously existing reserves – current estimate of various costs to resolve multiple
FINANCIAL RESULTS
complex foreclosure matters, including fees and assessments related to foreclosure delays and
payments for other settlements, including with DOJ, State AGs, etc.
Private label exposure – significant litigation reserves for the current estimate of facts and
circumstances2
Based on current conditions we believe we are appropriately reserved
conditions,
1
This is predominantly GSE
bank related liabilities are the responsibility of the FDIC. FDIC has
contested this position
2 WaMu
8
10. Card Services
$ in millions
Net income of $911mm compared with $343mm
p
year
in the prior y
$ O/(U)
2Q11
Revenue
$3,927
Credit Costs
810
Expense
1,622
Net Income
$911
1Q11
2Q10
($55)
($290)
584
(1,411)
67
($432)
186
$568
ROE
4.80%
1.54%
42%
9%
$13.0
EOP Equity
6.73%
28%
2
charge-offs and a reduction of $1.0B to the
allowance for loan losses, reflecting lower
estimated losses
Net charge-off rate (excluding the WaMu and
Key Statistics Incl. WaMu and Commercial Card ($B)1
ROO (pretax)
Credit costs of $810mm reflect lower net
$13.0
$15.0
Commercial Card portfolios) of 5.28%, down
from 6.20% in 1Q11 and 9.02% in 2Q10
E d f
End-of-period outstandings (
i d t t di
(excluding th
l di the
Key Statistics Excl. WaMu and Commercial Card ($B)1
Avg Outstandings
$111.6
$118.1
$129.8
EOP Outstandings
$112.4
$115.0
$127.4
$83.1
$75.2
$75.4
2.0
2.6
2.7
11.95%
11.51%
10.91%
5.28%
6.20%
9.02%
2.73%
3.25%
WaMu and Commercial Card portfolios) of
$112.4B down 12% YoY and 2% QoQ
4.48%
Sales Volume
New Accts Opened (mm)
Net Revenue Rate
Net Charge-Off Rate
3
30+ Day Delinquency Rate
3
1
Actual numbers for all periods, not over/under. Statistics include loans held for sale
Calculated based on average equity; 2Q11, 1Q11 and 2Q10 average equity was $13B,
$13B and $15B, respectively
$15B
3 See note 3 on slide 20
Sales volume (excluding the WaMu and
Commercial Card portfolios) of $83.1B up 10%
YoY and 11% QoQ
Revenue of $3.9B down 7% YoY and 1% QoQ
FINANCIAL RESULTS
2
N t revenue rate (
Net
t (excluding th W M and
l di the WaMu d
Commercial Card portfolios) of 11.95% up from
11.51% in 1Q11 and 10.91% in 2Q10
9
11. Commercial Banking1
Net income of $607mm down 12% YoY
$ in millions
$ O/(U)
2Q11
Revenue
1Q11
2Q10
$1,627
$111
$141
Middle Market Banking
789
34
22
Corporate Client Banking
339
49
54
Commercial Term Lending
286
-
49
Real Estate Banking
109
Other
104
21
7
Credit Costs
(16)
32
54
7
289
563
$61
Average Loans & Leases
$101.9
$99.6
EOP Loans & Leases
$102.7
$100.2
$95.5
Average Liability Balances3
$162.8
$156.2
$136.8
Allowance for Loan Losses
$2.6
$2.6
$2.7
Nonaccrual L
N
l Loans
$1.6
$1 6
$2.0
$2 0
$3.1
$3 1
Net Charge-Off Rate4
0.16%
0.13%
2.56%
2.59%
2.82%
30%
28%
35%
Overhead Ratio
35%
37%
36%
EOP Equity
$8.0
$8.0
$8.0
Expense
Net Income
Key St ti ti
K Statistics ($B)2
ROE
FINANCIAL RESULTS
Average liability balances of $163B up
19% YoY
0.74%
ALL / Loans 4
QoQ
4th consecutive quarter of increased
loan balances
21
$607
Average loan balances up 6% YoY and 2%
5
($86)
$95.9
See note 1 on slide 20
Actual numbers for all periods, not over/under
3 Includes deposits and deposits swept to on-balance sheet liabilities
4 Loans held-for-sale and loans at fair value were excluded when calculating the loan
loss coverage ratio and net charge-off rate
5 Calculated based on average equity of $
$8B
1
2
10
Record revenue of $1.6B up 9% YoY
Record gross IB revenue of $442mm
Credit costs of $54mm
Net charge-offs of $40mm down 77%
YoY and up 29% QoQ
Expense up 4% YoY; overhead ratio of
35%
12. Treasury & Securities Services
Net income of $333mm up 14% YoY and 5%
$ in millions
2Q11
Revenue
$1,932
Net Income
Key Statistics
4
76
54
5
62
$333
Credit Allocation Income/(Expense)
39
32
1
47
1,453
1 453
Expense
53
$17
Pretax margin of 27%
$51
930
Treasury Services
$92
1,002
Worldwide Securities Services
Q Q
QoQ
$ O/(U)
1Q11
2Q10
$41
QoQ increase due to seasonal activity in
securities lending and depositary receipts
Liability balances up 23% YoY
Record assets under custody of $16.9T up 14%
2
Average Liability Balances ($B)3
$302.9
Assets under Custody ($T)
$16.9
YoY
$265.7 $246.7
$16.6
$14.9
Pretax Margin
27%
26%
ROE4
19%
18%
Revenue of $1.9B up 3% YoY
25%
18%
TSS Firmwide Revenue
$2,553
3
TSS Firmwide Average Liab Bal ($B)
EOP Equity ($B)
$1,496 $1,653
$1 496 $1 653
$465.6
TS revenue of $930mm relatively flat YoY
$2,445 $2,608
$1,551
$1 551
TS Firmwide Revenue
WSS revenue of $1.0B up 5% YoY
$421.9 $383.5
$7.0
$7.0
Expense up 4% YoY driven by continued
investment in new product platforms, primarily
related to international expansion, partially offset
by the transfer of the Commercial Card business
to Card Services
$6.5
FINANCIAL RESULTS
1 IB
manages core credit exposures related to the Global Corporate Bank (GCB) on
behalf of IB and TSS. Effective January 1, 2011, IB and TSS share the economics
related to the Firm’s GCB clients. Included within this allocation are net revenues,
provision for credit losses as well as expenses Prior year periods reflected a
expenses. Prior-year
reimbursement to the IB for a portion of the total costs of managing the credit portfolio
2 Actual numbers for all periods, not over/under
3 Includes deposits and deposits swept to on-balance sheet liabilities
4 Calculated based on average equity; 2Q11, 1Q11, and 2Q10 average equity was
$7.0B, $7.0B, and $6.5B respectively
Credit allocation benefit of $32mm related to
shared credit portfolio
11
13. Asset Management
Net income of $439mm up 12% YoY
$ in millions
2Q11
Revenue
Private Banking
$2,537
1,289
Pretax margin of 29%
g
$ O/(U)
1Q11
2Q10
$131
$469
(28)
136
Institutional
704
155
249
Retail
544
4
84
12
7
7
Credit Costs
Revenue of $2.5B up 23% YoY due to the effect of
higher market levels, net inflows to products with higher
margins, higher valuations of seed capital investments
and higher performance fees
Assets under management of $1.3T up 16% YoY;
Expense
1,794
134
389
Assets under supervision of $1.9T up 17% YoY
Net Income
$439
($27)
$48
AUM inflows to long-term products of $19B for the
Key Statistics ($B)1
Assets under M
A
t
d Management
t
$1,342
$1 342
$1,330
$1 330
$1,161
$1 161
Assets under Supervision
$1,924
$1,908
$1,640
Average Loans
$48.8
$44.9
$37.4
EOP Loans
$51.7
$46.5
$38.7
Average Deposits
$97.5
$95.3
$86.5
Pretax Margin
ROE
2
EOP Equity
1
2
FINANCIAL RESULTS
quarter predominantly offset by outflows from
liquidity products of $16B
29%
31%
32%
27%
29%
24%
$6.5
$6.5
$6.5
Actual numbers for all periods, not over/under
Calculated based on average equity of $6.5B
12
Good global investment performance
76% of mutual fund AUM ranked in the first or
second quartiles over past 5 years; 71% over 3
years and 56% over 1 year
Expense up 28% YoY largely resulting from an increase
in headcount and higher performance-based
compensation
14. Corporate/Private Equity1
Private Equity
Net Income ($ in millions)
2Q11
Private Equity
Corporate
$444
58
$ O/(U)
1Q11
2Q10
$61
(281)
$433
(584)
Private equity gains of $816mm (pretax)
Private Equity portfolio of $8.8B (6.6% of
stockholders’ equity less goodwill)
Corporate
Net Income
1
$502
($220)
($151)
Noninterest expense includes $1.3B (pretax)
See note 1 on slide 20
for additional litigation reserves, predominantly
for mortgage-related matters
mortgage related
Investment portfolio results include securities
FINANCIAL RESULTS
gains of $837mm (pretax)
13
15. Fortress balance sheet
$ in billions
Basel III capital requirements
2Q11
Basel I Tier 1 Common Capital1,2
1Q11
2Q10
JPM
Regulator
requirements6
$121
$120
$108
$120
$116
$108
Basel I Risk-Weighted Assets 1
$1,197
$1,193
$1,131
Basel III Risk-Weighted Assets1,2,3 (Estimate)
$1,569
$1,594
$1,597
Total Assets
$2,247
$2,198
$2,014
Basel I Tier 1 Common Ratio1,2
2017
2018
7.00%
8.25%
10.1%
10.0%
9.6%
2019
9.50%
7.6%
7.3%
1,2,3
Basel III Tier 1 Common Capital
(Estimate)
Basel III Tier 1 Common Ratio1,2,3 (Estimate)
Current estimate
2013
2014
2015
2016
7.6%
6.7%
Firmwide total credit reserves of $29.1B; loan loss coverage ratio of 3.83%4
Global liquidity reserve of $404B1,5 (Estimate)
Repurchased $3.5B and $3.6B of common stock in 2Q11 and YTD 2Q11, respectively
We will have material excess capital generation over the next several years
FINANCIAL RESULTS
We believe Basel III 7.5% is consistent with our approach to a fortress balance sheet. We do not anticipate
accelerating regulatory timeline requirements
1
Estimated for 2Q11
See note 4 on slide 20
the Firm’s best estimate, based on its current understanding of proposed rules
4 See note 2 on slide 20
5 Th Gl b l Li
The Global Liquidity R
idit Reserve represents cash on d
t
h
deposit at central banks, and the cash proceeds expected t b received i connection with secured fi
it t
t lb k
d th
h
d
t d to be
i d in
ti
ith
d financing of hi hl li id unencumbered securities (
i
f highly liquid,
b d
iti (such as sovereigns, FDIC
h
i
and government guaranteed, agency and agency MBS). In addition, the Global Liquidity Reserve includes the Firm’s borrowing capacity at the Federal Reserve Bank discount window and various other central banks and from
various Federal Home Loan Banks, which capacity is maintained by the Firm having pledged collateral to all such banks. These amounts represent preliminary estimates which may be revised in the Firm’s 10-Q for the period
ending June 30, 2011
6 Regulator requirements are inclusive of SIFI buffer. Exact timing of SIFI buffer not known, so capital conservation buffer schedule assumed
Note: Firmwide Level 3 assets are estimated to be 5% of total Firm assets at June 30, 2011
2
3 Represents
14
3.50%
4.00%
4.50%
4 50%
5.75%
16. Outlook
Retail Financial Services
Corporate / Private Equity
Home Lending loss guidance:
Private Equity
Expect total quarterly net charge-offs of
Results will be volatile
$1.2B+/-
Corporate
Realized repurchase losses of $1.2B+/$1.2B /
Corporate excluding Private Equity,
Corporate,
Equity
annualized run-rate for remainder of 2011
quarterly net income should be
$300mm+/-
Card Services
Chase excluding WaMu and Commercial
Card credit losses expected to continue to
improve
Chase losses expected to be 4 5%+/- in
4.5%+/
3Q11
Current high repayment rates indicate
FINANCIAL RESULTS
outstandings for the Chase portfolio could
be $115B - $120B at the end of 2011
The WaMu card portfolio will continue to
run off and is expected to be $10B by the
end of 2011
15
18. Consumer credit — delinquency trends
(Excl.
(Excl purchased credit-impaired loans and WaMu and Commercial Card portfolios)
Home Equity delinquency trend ($ in millions)
$ ,
$4,000
Prime Mortgage delinquency trend ($ in millions)
$ ,
$4,500
30 – 150 day delinquencies
150+ day delinquencies
$3,000
$3,000
$2,000
$1,500
$1,000
$0
Mar-08
$0
Oct-08
Jun-09
Feb-10
Oct-10
Jun-11
Oct-08
Jun-09
Feb-10
Oct-10
Jun-11
Card Services delinquency trend1,2 ($ in millions)
Subprime Mortgage delinquency trend ($ in millions)
$4,000
Mar-08
30 – 150 day delinquencies
$8,200
30+ day delinquencies
30-89 day delinquencies
150+ day delinquencies
$6,800
$3,000
$5,400
$2,000
$4,000
$1,000
$1 000
$2,600
APPENDIX
$0
Mar-08
Oct-08
Jun-09
Feb-10
Oct-10
$1,200
Mar-08
Jun-11
Note: Delinquencies prior to September 2008 are heritage Chase
Prime Mortgage excludes loans held-for-sale, Asset Management and U.S. Government-Insured loans
1 See note 3 on slide 20
2 “Payment holiday” in 2Q09 impacted 30+ day and 30-89 day delinquency trends in 3Q09
17
Oct-08
Jun-09
Feb-10
Oct-10
Jun-11
19. Coverage ratios remain strong
$ in millions
Loan Loss Reserve/Total Loans1
Loan Loss Reserve
Loan Loss Reserve/NALs1
Nonaccrual Loans
6.00%
500%
5.00%
400%
35,836
4.00%
4 00%
3.00%
30,633
30 633
38,186
31,602
31 602
34,161
32,266
29,750
300%
28,520
29,072
2.00%
200%
100%
14,785
14 785
17,767
17,564
,
17,050
16,179
15,503
15 503
14,841
14 841
13,441
13 441
11,928
11 928
2Q09
3Q09
4Q09
1Q10
2Q10
3Q10
4Q10
1Q11
2Q11
1.00%
0%
Peer comparison
$28 5B of loan loss reserves in 2Q11 down
$28.5B
2Q11,
2Q 11
1Q 11
JPM 1
JP M 1
5.24 %
5.49%
5.26 %
233 %
240%
198 %
1.68 %
1.84%
1.88 %
122 %
92%
60 %
3.83 %
4.10%
4.13 %
201 %
189%
~$7.3B from $35.8B one year ago reflecting
continued improvement in the credit
environment; loan loss coverage ratio of
3.83%
3 83%1
P eer A vg .2
147 %
Consum er
LLR/ Total Loa ns
LLR/ NALs
Whole sale
LLR/ Total Loa ns
LLR/ NALs
$7.5B (pretax) addition in allowance for
loan losses related to the consolidation of
credit card receivables in 1Q10
Firm w ide
APPENDIX
LLR/ Total Loa ns
LLR/ NAL
NALs
1
2
See note 2 on slide 20
Peer average reflects equivalent metrics for key competitors. Peers are defined as C, BAC and WFC
18
20. IB League Tables
League table results
For YTD June 30, 2011, JPM ranked:
YTD J ne 2011
June
#1 in Global IB fees
FY 2010
Rank
Share
Rank
Share
1
8.8%
1
7.6%
Based on fees:
Global IB fees¹
Global Debt, Equity & Equity-related
1
6.9%
1
7.2%
US Debt, Equity & Equity-related
1
11.5%
1
11.1%
Global E quity & Equity-related²
3
7.2%
3
7.3%
2
11.9%
2
13.1%
2
6.8%
2
7.2%
1
11.5%
2
10.9%
2
20.5%
3
16.4%
1
33.9%
3
23.1%
1
12.4%
2
8.5%
1
22.8%
2
19.2%
US Equity & Equity-related
Global Long-term Debt³
US Long-term Debt³
Global M&A Announced4
4,5
Global Loan Syndications
US Loan Syndications
APPENDIX
#3 in Global Equity & Equity-related
#2 in Global Long-term Debt
Based on volumes:
US M&A Announced
#1 in Global Debt, Equity & Equity-related
Source: Dealogic
1 Global IB fees exclude money market, short term debt and shelf deals
2 Equity & Equity-related include rights offerings and Chinese A-Shares
3 Long-term Debt tables include investment grade, high yield, ABS, MBS, covered bonds,
supranational, sovereign and agency issuance; exclude money market, short term debt and
U.S. municipal securities
4 Global announced M&A is based upon value at announcement, with full credit to each
advisor/equal if joint; all other rankings are based upon proceeds. Because of joint
assignments, M&A market share of all participants will add up to more than 100%. Rankings
reflect the removal of any withdrawn transactions
5 US M&A represents any US involvement ranking
19
#2 in Global M&A Announced
#1 in Global Loan Syndications
21. Notes on non GAAP & other financial measures
non-GAAP
Notes on non-GAAP financial measures
1.
In addition to analyzing the Firm’s results on a reported basis, management reviews the Firm’s results and the results of the lines of business on a “managed” basis, which is a non-GAAP
financial measure. The Firm’s definition of managed basis starts with the reported U.S. GAAP results and includes certain reclassifications to present total net revenue for the Firm (and
each of the business segments) on a FTE basis. Accordingly, revenue from tax-exempt securities and investments that receive tax credits is presented in the managed results on a basis
comparable to taxable securities and investments. This non-GAAP financial measure allows management to assess the comparability of revenue arising from both taxable and taxexempt sources. The corresponding income tax impact related to tax-exempt items is recorded within income tax expense. These adjustments have no impact on net income as reported
by the Firm as a whole or by the lines of business.
2.
The ratio of the allowance for loan losses to end-of-period loans excludes the following: loans accounted for at fair value and loans held-for-sale; purchased credit-impaired (“PCI”) loans;
(
)
and the allowance for loan losses related to PCI loans. Additionally, Real Estate Portfolios net charge-offs exclude the impact of PCI loans. The allowance for loan losses related to the
purchased credit-impaired portfolio totaled $4.9 billion, $4.9 billion and $2.8 billion at June 30, 2011, March 31, 2011, and June 30, 2010, respectively.
3.
In Card Services, supplemental information is provided for Chase, excluding Washington Mutual and Commercial Card portfolios, to provide more meaningful measures that enable
comparability with prior periods.
4.
The Basel I Tier 1 common ratio is Tier 1 common divided by risk-weighted assets. Tier 1 common is defined as Tier 1 capital less elements of Tier 1 capital not in the form of common
y
g
p
p
equity, such as perpetual preferred stock, noncontrolling interests in subsidiaries and trust preferred capital debt securities. Tier 1 common, a non-GAAP financial measure, is used by
banking regulators, investors and analysts to assess and compare the quality and composition of the Firm’s capital with the capital of other financial services companies. The Firm uses
Tier 1 common along with other capital measures to assess and monitor its capital position. On December 16, 2010, the Basel Committee issued the final version of the Basel Capital
Accord, commonly referred to as “Basel III.” The Firm’s estimate of its Tier 1 common ratio under Basel III is a non-GAAP financial measure and reflects the Firm’s current understanding
of the Basel III rules and the application of such rules to its businesses as currently conducted. The Firm’s estimates of its Basel III Tier 1 common ratio will evolve over time as the Firm’s
businesses change, and as a result of further rule-making on Basel III implementation from U.S. federal banking agencies. Management considers this estimate as a key measure to
assess the Firm’s capital position in conjunction with its capital ratios under Basel I requirements, in order to enable management, investors and analysts to compare the Firm’s capital
under the Basel III capital standards with similar estimates provided by other financial services companies.
5.
Tangible common equity (“TCE”), a non-GAAP financial measure, represents common stockholders’ equity (i.e., total stockholders’ equity less preferred stock) less goodwill and
identifiable intangible assets (other than MSRs), net of related deferred tax liabilities. ROTCE, a non-GAAP financial ratio, measures the Firm’s earnings as a percentage of TCE. In
management’s view, these measures are meaningful to the Firm, as well as analysts and investors in assessing the Firm’s use of equity, and in facilitating comparisons with competitors.
Additional notes on financial measures
Treasury & Securities Services firmwide metrics include certain TSS product revenue and liability balances reported in other lines of business related to customers who are also
customers of those other lines of business. In order to capture the firmwide impact of TSS products and revenue, management reviews firmwide metrics such as liability balances,
revenue and overhead ratios in assessing financial performance for TSS. Firmwide metrics are necessary, in management’s view, in order to understand the aggregate TSS business.
7.
APPENDIX
6.
Pretax margin represents income before income tax expense divided by total net revenue, which is, in management’s view, a comprehensive measure of pretax performance derived by
measuring earnings after all costs are taken into consideration. It is, therefore, another basis that management uses to evaluate the performance of TSS and AM against the performance
of their respective competitors.
8.
Headcount-related expense includes salary and benefits (excluding performance-based incentives), and other noncompensation costs related to employees.
20
22. Forward-looking
Forward looking statements
APPENDIX
This presentation contains forward-looking statements within the meaning of the Private Securities
Litigation Reform Act of 1995. Such statements are based upon the current beliefs and
g
p
expectations of JPMorgan Chase & Co.’s management and are subject to significant risks and
uncertainties. Actual results may differ from those set forth in the forward-looking statements.
Factors that could cause JPMorgan Chase & Co.’s actual results to differ materially from those
described in the forward-looking statements can be found in JPMorgan Chase & Co.’s Annual
Report on Form 10-K for the year ended December 31, 2010 and Quarterly Report on Form 10-Q
10 K
31 2010,
10 Q
for the quarter ended March 31, 2011, which have been filed with the Securities and Exchange
Commission and are available on JPMorgan Chase & Co.’s website (www.jpmorganchase.com) and
on the Securities and Exchange Commission’s website (www.sec.gov). JPMorgan Chase & Co.
does not undertake to update the forward-looking statements to reflect the impact of circumstances
p
g
p
or events that may arise after the date of the forward-looking statements.
21