Download to read offline
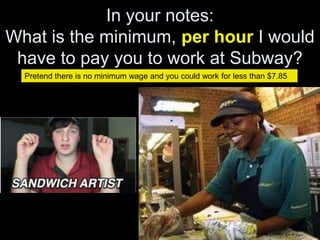
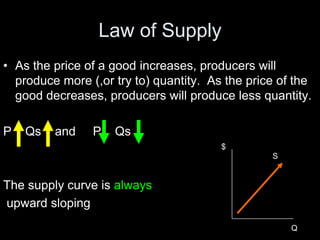
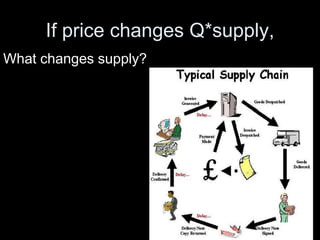
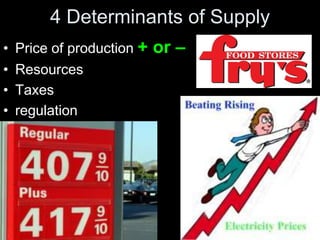
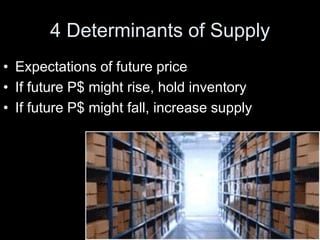
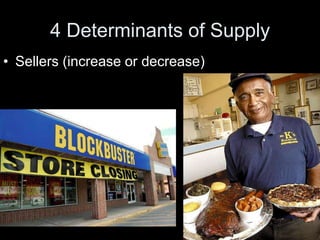
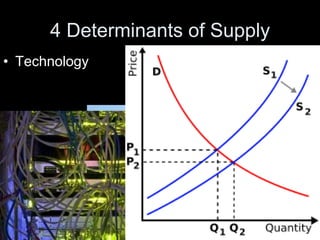
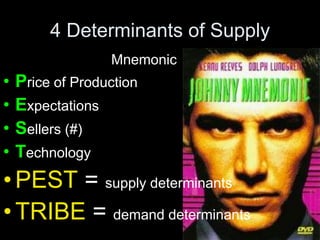


In 3 sentences or less: You ask what the minimum hourly wage I would accept is to work at Subway, pretending there is no minimum wage. The document then discusses determinants of supply such as price of production, resources, taxes, regulations, expectations of future prices, number of sellers, and technology. It provides examples of how these factors can increase or decrease the quantity supplied and illustrates supply curves on graphs.


