Download to read offline

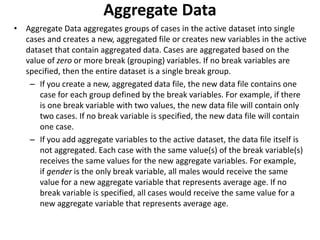


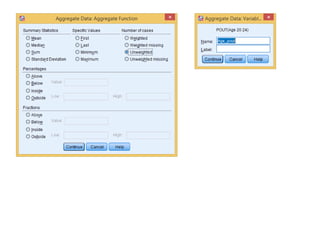
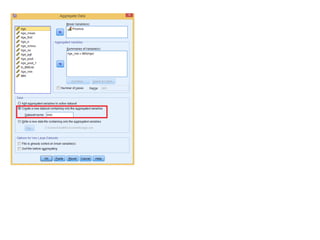


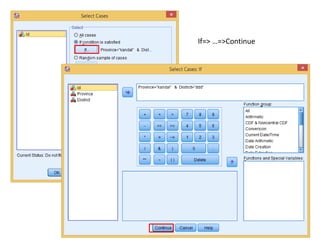
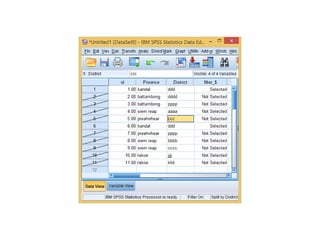

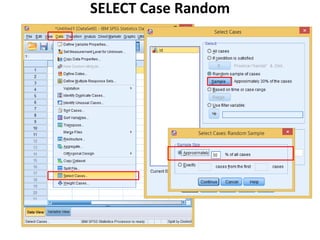


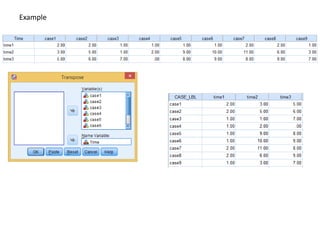

The document provides information about several DATA menu options in SPSS for aggregating, selecting, sorting, and transforming cases in a dataset. It describes how Aggregate Data can create new aggregated variables or a new aggregated dataset based on grouping variables. It also explains how Select Cases can filter or select subsets of cases based on variable values, expressions, random sampling, or case numbers. Other options covered include sorting cases, applying weights to cases, and transposing rows and columns to reshape the dataset.


![SPSS Lecture_1 [Autosaved].pptx](https://cdn.slidesharecdn.com/ss_thumbnails/spsslecture1autosaved-231105165336-b29c7b18-thumbnail.jpg?width=640&height=640&fit=bounds)