Download as PDF, PPTX


![43
14
18
24 25 27 28
33 33 34 35 35 36 37
41 43 44 45 46 46 46 46
51
54
65
70
73
77
84
Global28
S.Africa
Brazil
Colombia
Poland
Italy
Mexico
France
U.S.
Spain
Australia
Ireland
U.K.
Japan
Argentina
Germany
Russia
S.Korea
Canada
HongKong
Malaysia
Sweden
Turkey
The
Netherlands
Singapore
India
Indonesia
UAE
China
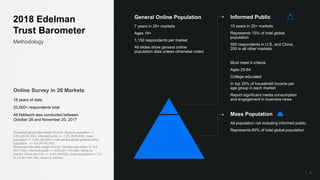
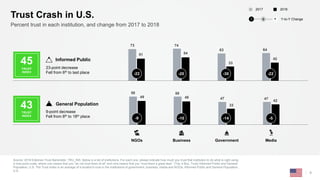
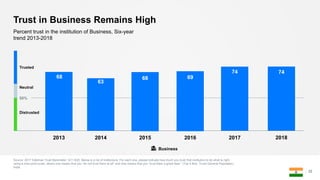
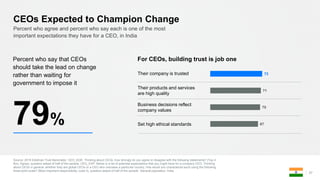
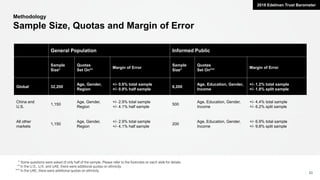
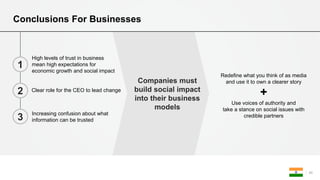
Source: 2018 Edelman Trust Barometer. TRU_INS. [GOVERNMENT IN GENERAL] Below is a list of institutions. For each one, please indicate how much you trust that institution
to do what is right using a nine-point scale where one means that you “do not trust them at all” and nine means that you “trust them a great deal.“ (Top 4 Box, Trust) General
Population, 28-market global total.
7
Trust in Government on the Rise
Percent trust in government, and change from 2017 to 2018
l llllllllllllllllllllllllllll+2 -1 -6 -8 +5 -4 +4 +8 -14 +9 -2 +3 0 0 +8 +5 0 +17 +3 +6 +9 +1 0 +3 -4 -5 +2 +2 +8
Distrusted in 21 markets
TrustNeutralDistrust
Y-to-Y Change− +0](https://image.slidesharecdn.com/2018edelmantrustbarometerindia-180227020958/85/2018-Edelman-Trust-Barometer-India-7-320.jpg)
![43
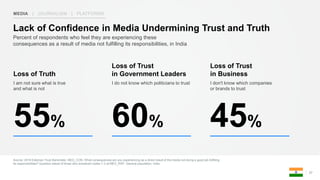
30 31 32 32 32 33 33 34 35 35
39 40 42 42 43 43 43 44 45 47 48 49
52
55 56
61
68
71
Global28
Turkey
Australia
Japan
Sweden
U.K.
France
Ireland
Poland
Russia
S.Africa
Argentina
S.Korea
Germany
U.S.
Brazil
Colombia
HongKong
Spain
Italy
Malaysia
Mexico
Canada
Singapore
TheNetherlands
UAE
India
Indonesia
China
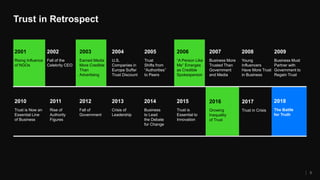
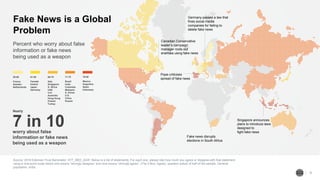
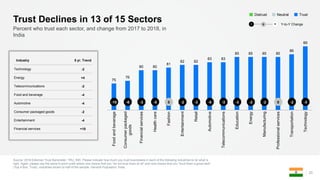
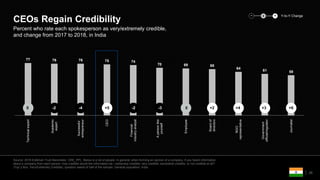
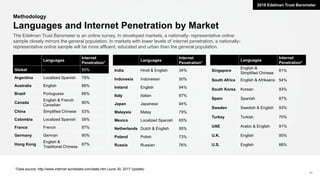
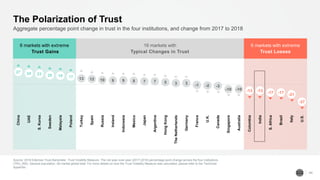
Source: 2018 Edelman Trust Barometer. TRU_INS. [MEDIA IN GENERAL] Below is a list of institutions. For each one, please indicate how much you trust
that institution to do what is right using a nine-point scale where one means that you “do not trust them at all” and nine means that you “trust them a great
deal.“ (Top 4 Box, Trust) General population, 28-market global total.
8
Percent trust in media, and change from 2017 to 2018
Media Least Trusted Globally
TrustNeutralDistrust
Distrusted in 22 of 28 of markets
l llllllllllllllllllllllllllll0 +5 -1 0 -1 0 0 +4 +3 +4 -4 -1 0 0 -5 -5 -2 +1 0 -3 +5 +1 +4 -2 +1 +12 -5 +1 +6
Y-to-Y Change− +0](https://image.slidesharecdn.com/2018edelmantrustbarometerindia-180227020958/85/2018-Edelman-Trust-Barometer-India-8-320.jpg)
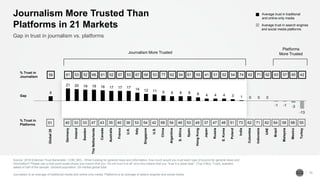

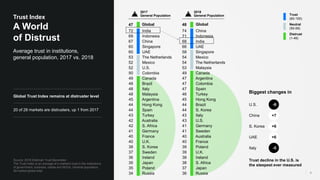
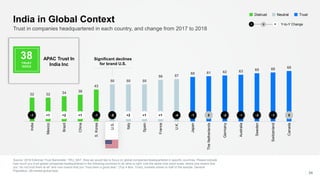
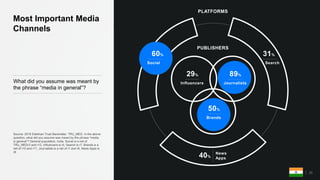
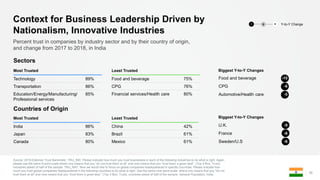
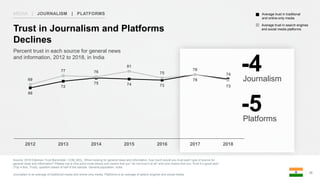
![Trust Still High, Expectations Higher
13
Percent trust in the institution of Government, Five-year
trend 2014-2018
Government
50%
Neutral
Trusted
Distrusted
2014 2015 2016 2017
51
68 65
75
2018
70
Expectations remain
high in Modi’s
penultimate year; pre-
General Election
perceptions taking a
toll?
Source: 2018 Edelman Trust Barometer. TRU_INS. [GOVERNMENT IN GENERAL] Below is a list of institutions. For each one, please indicate how much you trust that institution
to do what is right using a nine-point scale where one means that you “do not trust them at all” and nine means that you “trust them a great deal.“ (Top 4 Box, Trust) General
Population, India total.](https://image.slidesharecdn.com/2018edelmantrustbarometerindia-180227020958/85/2018-Edelman-Trust-Barometer-India-13-320.jpg)
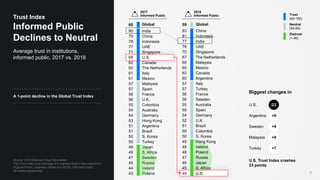
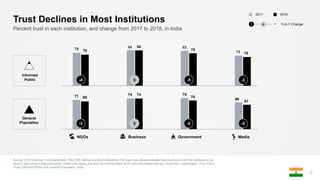
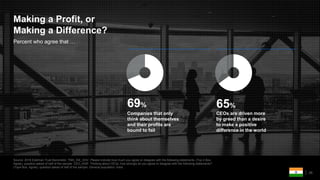
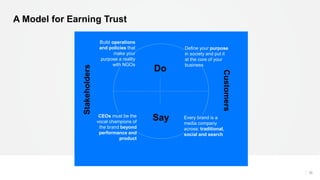
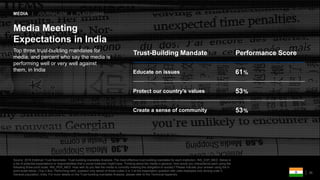
![Trust in NGOs Dips
Source: 2018 Edelman Trust Barometer. TRU_INS. [NGOS IN GENERAL] Below is a list of institutions. For each one, please indicate how much you trust that
institution to do what is right using a nine-point scale where one means that you “do not trust them at all” and nine means that you “trust them a great deal.“ (Top 4
Box, Trust) General Population, India total.
15
Percent trust in the institution of NGOs, Five-year trend
2014-2018
2014 2015 2016 2017
64 65 64
71
NGOs
50%
Neutral
Trusted
Distrusted
2018
68](https://image.slidesharecdn.com/2018edelmantrustbarometerindia-180227020958/85/2018-Edelman-Trust-Barometer-India-15-320.jpg)

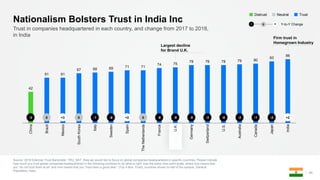
![17
Trust in Media Sees Five-Year Low
Percent trust in the institution of Media, Five-year trend
2013-2018
2014 2015 2016 2017
64
70
63 66
Media
2018
61
Source: 2018 Edelman Trust Barometer. TRU_INS. [MEDIA IN GENERAL] Below is a list of institutions. For each one, please indicate how much you trust that institution to do
what is right using a nine-point scale where one means that you “do not trust them at all” and nine means that you “trust them a great deal.“ (Top 4 Box, Trust) General
Population, India total.
50%
Neutral
Trusted
Distrusted](https://image.slidesharecdn.com/2018edelmantrustbarometerindia-180227020958/85/2018-Edelman-Trust-Barometer-India-17-320.jpg)


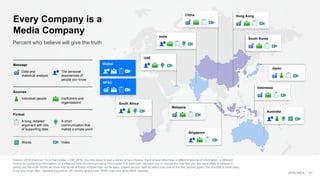
![42
Top trust-building mandates for
each institution, in India
Each Institution
Must Play its Role
NGOs
Provide social services
Educate on issues
Shape public opinion
Business
Drive economic prosperity
Ensure competitive workforce
Safeguard privacy
Government
Drive economic prosperity
Ensure equal opportunity
Support the poor
Media
Educate on issues
Protect our country’s values
Create a sense of community
Source: 2018 Edelman Trust Barometer. Trust-Building Mandates Analysis. The most effective trust building mandates for each institution. INS_EXP_GOV;
INS_EXP_MED; INS_EXP_BUS; and INS_EXP_NGO. Below is a list of potential expectations or responsibilities that a social institution might have. Thinking
about [insert institution] in general, how would you characterize each using the following three-point scale. General population, India. For more details on the
Trust Mandates Analysis, please refer to the Technical Appendix.](https://image.slidesharecdn.com/2018edelmantrustbarometerindia-180227020958/85/2018-Edelman-Trust-Barometer-India-41-320.jpg)

This document provides methodology details and results from the 2018 Edelman Trust Barometer survey conducted in 28 markets. Some key findings: - The global Trust Index remains in the "distrust" range at 48, unchanged from 2017. 20 of 28 markets are now categorized as distrusting. - Trust declined significantly in the US, falling 9 points in the general population and a record 23 points among the informed public. - Trust in government increased in China and several other markets but declined in most others, including India. - Media remains the least trusted institution globally, distrusted in 22 of 28 markets. - Concerns about fake news being used as a weapon are widespread, with 7 in 10 Indians worrying