Download as PDF, PPTX

![53
47
21
23
31
39
43
46 46
48
52 53 54 55 56
58 58 58 59 59 59 60 60 60 61 61
64 64
71 71
Global28
GDP5
Russia
Sweden
Japan
Germany
Ireland
Netherlands
U.K.
Poland
Australia
Turkey
France
UAE
S.Korea
Malaysia
S.Africa
U.S.
Canada
HongKong
Italy
Brazil
Colombia
Spain
China
Singapore
Argentina
Indonesia
India
Mexico
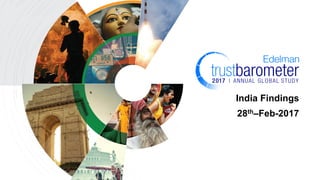
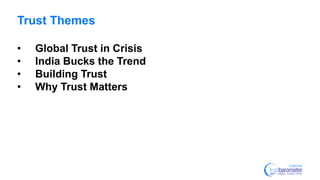
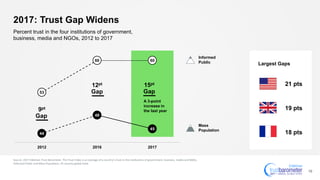
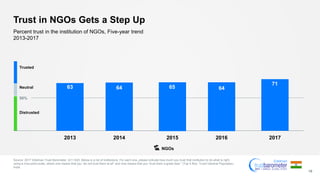
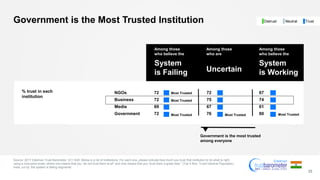
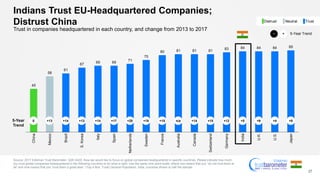
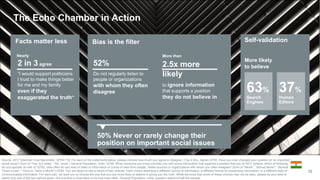
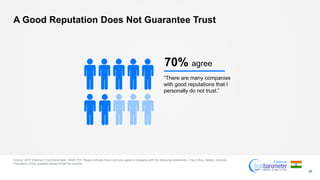
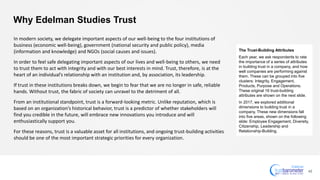
Trust in NGOs Declines
Source: 2017 Edelman Trust Barometer. Q11-620. [TRACKING] [NGOs IN GENERAL] Below is a list of institutions. For each one, please indicate how much you trust
that institution to do what is right using a nine-point scale where one means that you “do not trust them at all” and nine means that you “trust them a great deal.“ (Top 4
Box, Trust) General Population, 28-country global total.
GDP 5 = U.S., China, Japan, Germany, U.K.
11
Percent trust in NGOs, and change from 2016 to 2017
Distrusted in 8 countries
50%
-2 +7 -3-6 +7-6-1-100-3+1+2-2+10-2 -2 -4 -2 -3-6 -3 -4 -5-3 -3 -6-2 -4 -2
Declines in 21 countries
Y-to-Y Change+−
NeutralDistrust Trust
NGOs less trusted than
business in 11 countries](https://image.slidesharecdn.com/edelmanindia-trustbarometer2017-india-170303055630/85/2017-Edelman-Trust-Barometer-India-11-320.jpg)
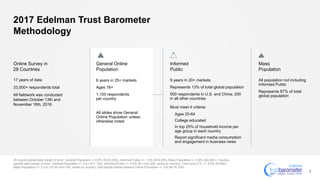
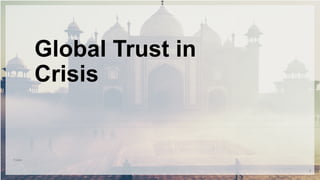
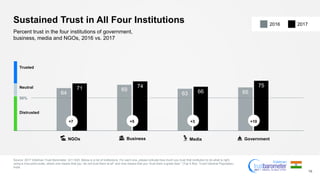
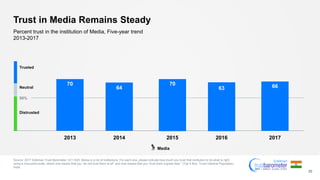
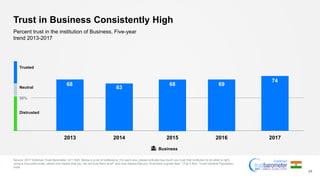
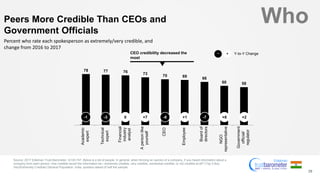
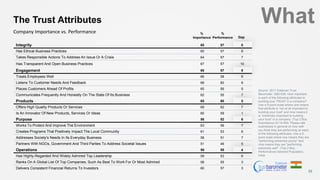
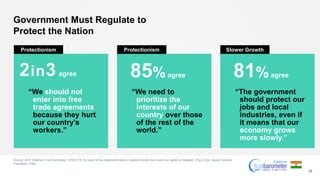
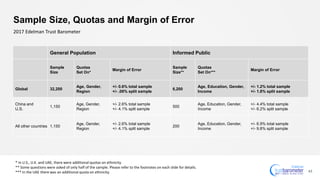
![Distrusted in 75% of countries
Trust in Government Further Evaporates
Source: 2017 Edelman Trust Barometer. Q11-620. [TRACKING] [GOVERNMENT IN GENERAL] Below is a list of institutions. For each one, please indicate how much
you trust that institution to do what is right using a nine-point scale where one means that you “do not trust them at all” and nine means that you “trust them a great
deal.“ (Top 4 Box, Trust) General Population, 28-country global total.
GDP 5 = U.S., China, Japan, Germany, U.K.
12
Percent trust in government, and change from 2016 to 2017
Declines in 14 countries
50%
41
47
15
20
24 24 25 25
28
31 32 32 33
36 37 37 37 38 40
43 44 45 47
51 51
69 71
75 75 76
Global28
GDP5
S.Africa
Poland
Brazil
Mexico
France
Spain
S.Korea
Italy
Colombia
Ireland
Argentina
U.K.
Australia
Japan
Malaysia
Germany
HongKong
Canada
Russia
Sweden
U.S.
Netherlands
Turkey
Singapore
Indonesia
India
UAE
China
0 +8 +2 +9 +13 +100+700+1+1+3+1+1 -1 -7 -2 -2 -1 -5 -10 -9 -5 -5 -3-1 -8 -8-1
Y-to-Y Change+−
NeutralDistrust Trust](https://image.slidesharecdn.com/edelmanindia-trustbarometer2017-india-170303055630/85/2017-Edelman-Trust-Barometer-India-12-320.jpg)
![43 43
25
29
31 31 32 32 32 33 33
39 40 40
42 42 42
44 44 45 45
47 47 48 48
54 54
65 66 67
Global28
GDP5
Turkey
Ireland
Poland
Russia
Australia
Japan
U.K.
France
Sweden
S.Africa
Argentina
S.Korea
Germany
HongKong
Malaysia
Spain
UAE
Canada
Colombia
Mexico
U.S.
Brazil
Italy
Netherlands
Singapore
China
India
Indonesia
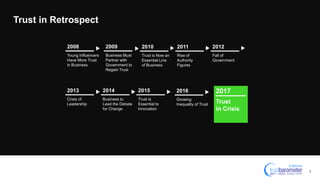
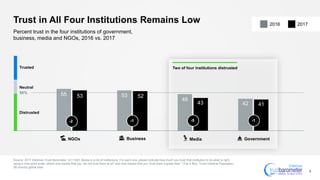
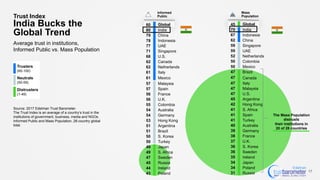
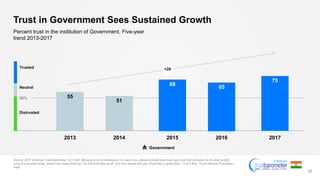
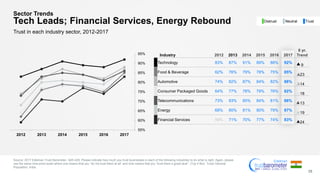
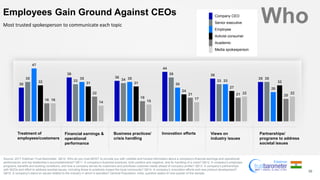
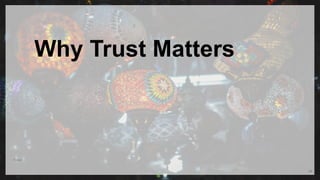
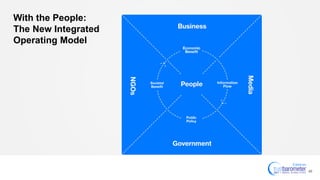
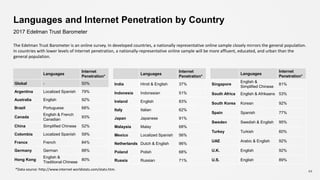
Trust in Media Plunges to All-Time Lows
Source: 2017 Edelman Trust Barometer. Q11-620. [TRACKING] [MEDIA IN GENERAL] Below is a list of institutions. For each one, please indicate how much you
trust that institution to do what is right using a nine-point scale where one means that you “do not trust them at all” and nine means that you “trust them a great deal.“
(Top 4 Box, Trust) General Population, 28-country global total.
GDP 5 = U.S., China, Japan, Germany, U.K.
13
Percent trust in media, and change from 2016 to 2017
Distrusted in 82% of countries
50%
All-time low in 17 countries
-5 -11 +3 +4+2 -8-6-1-2-60-10-10-15-5-3-6 -13 -3 -2 -5-10 -6 -4 +2-10 -3 -7-5 -5
Y-to-Y Change+−
NeutralDistrust Trust](https://image.slidesharecdn.com/edelmanindia-trustbarometer2017-india-170303055630/85/2017-Edelman-Trust-Barometer-India-13-320.jpg)
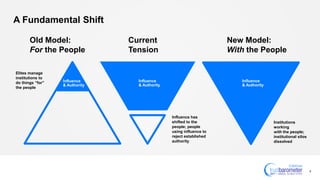
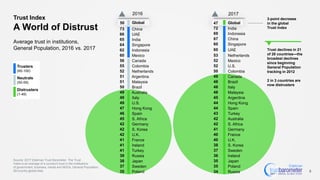
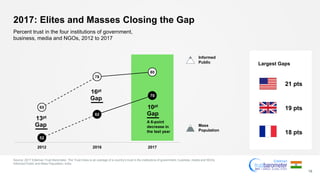
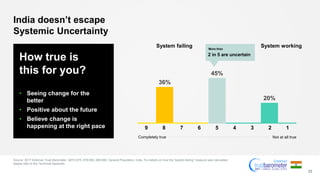
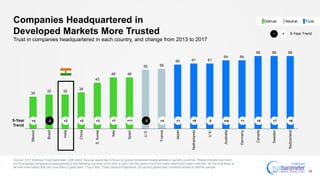
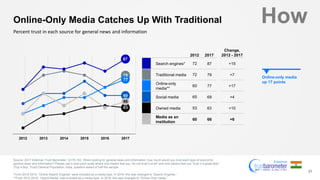
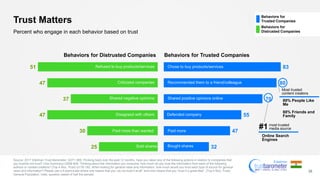
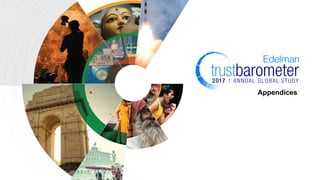
![Business on the Brink of Distrust
Source: 2017 Edelman Trust Barometer. Q11-620. [TRACKING] [BUSINESS IN GENERAL] Below is a list of institutions. For each one, please indicate how much you
trust that institution to do what is right using a nine-point scale where one means that you “do not trust them at all” and nine means that you “trust them a great deal.“
(Top 4 Box, Trust) General Population, 28-country global total.
GDP 5 = U.S., China, Japan, Germany, U.K.
14
Percent trust in business, and change from 2016 to 2017
Distrusted in 13 countries
50%
52 51
29
34
39 40 41 41 43 43 45 45 46 46 48 50 50
55 56 56 58 58 60 61
64 64
67 67
74 76
Global28
GDP5
S.Korea
HongKong
Russia
Poland
Ireland
Japan
Germany
Turkey
Argentina
U.K.
Spain
Sweden
Australia
France
Canada
Italy
Malaysia
S.Africa
Singapore
U.S.
Netherlands
Brazil
Colombia
UAE
China
Mexico
India
Indonesia
-4 +4 -2 -2 -4 -2 +7 +4 -3 -6 -3 -3 -9 +5 +5-4 -5-1 0-8 -1 -2+1-2 -2 +1+1 +2 -6+1
Declines in 18 countries
Y-to-Y Change+−
NeutralDistrust Trust](https://image.slidesharecdn.com/edelmanindia-trustbarometer2017-india-170303055630/85/2017-Edelman-Trust-Barometer-India-14-320.jpg)


- India bucks the global trend of declining trust in institutions, with trust increasing across government, business, media and NGOs from 2016 to 2017. - Trust in all four institutions remains above 50% in India, compared to a global average of under 50%. - The gap between India's informed public and mass population is decreasing, with both groups trusting institutions more than the global average. - Trust in NGOs and media has remained steady in India from 2013-2017, while trust in government has seen sustained growth over the past five years.


![[rokonz.com] Glossary of Semantic SEO Part-3.pdf](https://cdn.slidesharecdn.com/ss_thumbnails/rokonz-260123200835-55123e1e-thumbnail.jpg?width=640&height=640&fit=bounds)

![[rokonz.com] Glossary of Semantic SEO Part-1.pdf](https://cdn.slidesharecdn.com/ss_thumbnails/rokonz-260123200456-440e4060-thumbnail.jpg?width=640&height=640&fit=bounds)


