In 2018, trust in Australia continues to decline across all four key institutions: media, business, government and NGOs. This has resulted with Australia sitting just four percentage points above the world’s least trusting country, Russia.
Trust in media has fallen to a new all-time-low of 31 percent, and 60 percent of Aussies are disengaged with news from major organizations.
Read more: http://edl.mn/2sdBiUc
2. 2
Methodology
2018 Edelman
Trust Barometer
Online Survey in 28 Countries
18 years of data
33,000+ respondents total
All fieldwork was conducted between
October 28 and November 20, 2017
General Online Population
7 years in 25+ countries
Ages 18+
1,150 respondents per country
All slides show general online
population data unless otherwise noted
Mass Population
All population not including informed public
Represents 85% of total global population
Informed Public
10 years in 20+ countries
Represents 15% of total global
population
500 respondents in U.S. and China;
200 in all other countries
Must meet 4 criteria:
Ages 25-64
University educated
In top 25% of household income per
age group in each country
Significant media consumption and
engagement in business news
28-country global data margin of error: General population +/-
0.6% (N=32,200), informed public +/- 1.2% (N=6,200), mass
population +/- 0.6% (26,000+), half-sample global general online
population +/- 0.8 (N=16,100).
Country-specific data margin of error: General population +/- 2.9
(N=1,150), informed public +/- 6.9% (N = min 200, varies by
country), China and U.S. +/- 4.4% (N=500), mass population +/-
3.0 to 3.6 (N =min 740, varies by country).
4. Source: 2018 Edelman Trust Barometer. TRU_INS. Below is a list of institutions. For each one, please indicate how much you trust that institution to do
what is right using a nine-point scale, where one means that you “do not trust them at all” and nine means that you “trust them a great deal.” (Top 4 Box,
Trust) Informed Public and General Population, 28-country global total.
4
Percent trust in each institution, and change from 2017 to 2018
No Global Recovery in Trust
53 52
41 43
53 52
43 43
67
65
53 53
64 64
53 53
-3 -1 0 0
Business MediaNGOs Government
0 0 +2 0
Informed
Public
General
Population
20182017
Y-to-Y Change− +0
5. Source: 2018 Edelman Trust Barometer.
The Trust Index is an average of a country's trust in the institutions
of government, business, media and NGOs. General population,
28-country global total.
5
Average trust in institutions,
general population, 2017 vs. 2018
Trust Index
A World
of Distrust
Biggest changes in
47 Global
72 India
69 Indonesia
67 China
60 Singapore
60 UAE
53 The Netherlands
52 Mexico
52 U.S.
50 Colombia
49 Canada
48 Brazil
48 Italy
48 Malaysia
45 Argentina
44 Hong Kong
44 Spain
43 Turkey
42 Australia
42 S. Africa
41 Germany
40 France
40 U.K.
38 S. Korea
37 Sweden
36 Ireland
35 Japan
35 Poland
34 Russia
U.S. -9
China +7
S. Korea +6
UAE +6
Italy -5
Trust
(60-100)
Neutral
(50-59)
Distrust
(1-49)
Trust decline in the U.S. is
the steepest ever measured
48 Global
74 China
71 Indonesia
68 India
66 UAE
58 Singapore
54 Mexico
54 The Netherlands
53 Malaysia
49 Canada
47 Argentina
47 Colombia
47 Spain
46 Turkey
45 Hong Kong
44 Brazil
44 S. Korea
43 Italy
43 U.S.
41 Germany
41 Sweden
40 Australia
40 France
39 Poland
39 U.K.
38 Ireland
38 S. Africa
37 Japan
36 Russia
2017
General Population
2018
General Population
Global Trust Index remains at distruster level
20 of 28 countries are distrusters, up 1 from 2017
6. Source: 2018 Edelman Trust Barometer.
The Trust Index is an average of a country's trust in the institutions
of government, business, media and NGOs. Informed public,
28-country global total.
6
Average trust in institutions,
informed public, 2017 vs. 2018
Trust Index
Informed Public
Declines to Neutral
60 Global
80 India
79 China
78 Indonesia
77 UAE
71 Singapore
68 U.S.
62 Canada
62 The Netherlands
61 Italy
61 Mexico
57 Malaysia
57 Spain
56 France
56 U.K.
55 Colombia
54 Australia
54 Germany
53 Hong Kong
51 Argentina
51 Brazil
50 S. Korea
50 Turkey
49 Japan
49 S. Africa
47 Sweden
45 Russia
44 Ireland
43 Poland
2017
Informed Public
2018
Informed Public
Biggest changes in
U.S. -23
Argentina +9
Sweden +9
Malaysia +8
Turkey +7
Australia up 1 point, but still in neutral.
Trust
(60-100)
Neutral
(50-59)
Distrust
(1-49)
59 Global
83 China
81 Indonesia
77 India
76 UAE
70 Singapore
67 The Netherlands
65 Malaysia
65 Mexico
62 Canada
60 Argentina
57 Italy
57 Turkey
56 France
56 Sweden
55 Australia
55 Spain
54 Germany
52 U.K.
51 Brazil
50 Colombia
50 S. Korea
49 Hong Kong
48 Ireland
48 Poland
47 Russia
46 Japan
45 S. Africa
45 U.S.
8. Flashback to 2017:
The System is Broken
8
Distrustful nation:
Australians lose
faith in politics,
media and business
We really don’t
trust our
government or
institutions
anymore
Trust in the financial
sector in Australia
and elsewhere has
plummeted
How business
can tackle the
trust deficit
9. Source: 2018 Edelman Trust Barometer. TRU_INS. Below is a list of institutions. For each one, please indicate how much you trust that institution to do
what is right using a nine-point scale, where one means that you “do not trust them at all” and nine means that you “trust them a great deal.” (Top 4 Box,
Trust) Informed Public and General Population, Australia.
9
Percent trust in each institution, and change from 2017 to 2018, in Australia
Trust Declines Among General Population
52
48
37
32
48
45
35
31
66
60
51
40
65
57
47
50
-1 -3 -4 +10
Business MediaNGOs Government
-4 -3 -2 -1
Informed
Public
General
Population
20182017
Y-to-Y Change− +0
Business MediaNGOs Government
10. 27 24 23 20 19 17 13 12 10 9 9 8 7 7 5 3 3 -1 -2 -3
-10 -10 -13 -13 -17 -17 -21
-37
China
UAE
S.Korea
Sweden
Malaysia
Poland
Turkey
Spain
Russia
Ireland
Indonesia
Mexico
Japan
Argentina
HongKong
TheNetherlands
Germany
France
U.K.
Canada
Singapore
Australia
Colombia
India
S.Africa
Brazil
Italy
U.S.
16 countries with
Typical Changes in Trust
Source: 2018 Edelman Trust Barometer. Trust Volatility Measure. The net year-over-year (2017-2018) percentage point change across the four institutions
(TRU_INS). General population, 28-country global total. For more details on how the Trust Volatility Measure was calculated, please refer to the Technical
Appendix.
10
Aggregate percentage point change in trust in the four institutions, and change from 2017 to 2018
2018 The Global Polarisation of Trust
Countries with extreme
Trust Gains
Countries with extreme Trust Losses
11. 11
Government Most Broken
in Australia
Which institution is the
most broken?
Source: 2018 Edelman Trust Barometer. ATT_STE. Please indicate which institution – Government, Media, Business or NGO’s – is best described by each of the
following statements? General population, 28-country global total and Australia.
Business
42%
Government
56%
Government
Government Government✓
Government Path to Better
Future in Australia
Which institution is most likely
to lead to a better future?
Global Global
NGOs
Business
✓
23%
%
30%
% %
22%
20%
21%
✓
✓
13. Source: 2018 Edelman Trust Barometer. INS_EXP_GOV. BASE: BLOCK A AND B RESPONDENTS [SPLIT SAMPLE] Below is a list of potential
expectations or responsibilities that a social institution might have. Thinking about the government in general, how would you characterize each using the
following three-point scale.
13
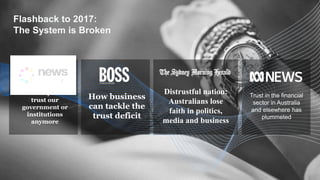
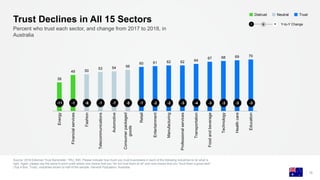
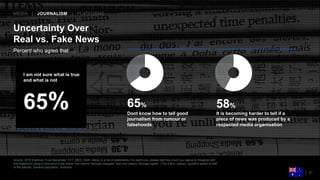
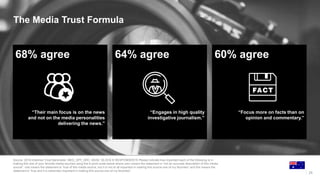
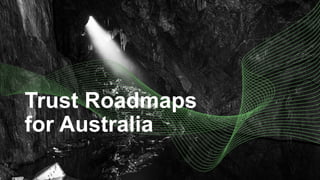
The Executive Order for
Government Trust
77% agree
“Focus on infrastructure
development projects, such as
schools, roads, and hospitals.”
32%
believe this is being delivered
73% agree
“Drive the economic prosperity of
our country.”
23%
believe this is being delivered
14. 52
36 36
40 41 42 42 43 43 44 44 45 46 47 48 49 49
53 54 56 57
60 60
64
68 70
74 74
78
Global28
HongKong
S.Korea
Ireland
Russia
France
Japan
Poland
U.K.
Argentina
Germany
Australia
Turkey
Sweden
U.S.
Canada
Spain
S.Africa
Italy
Singapore
Brazil
Malaysia
The
Netherlands
Colombia
UAE
Mexico
China
India
Indonesia
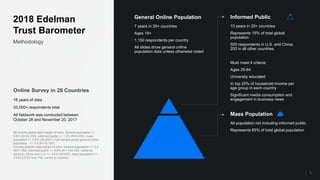
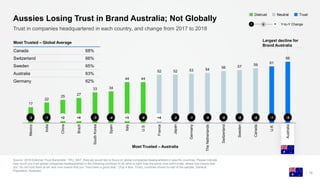
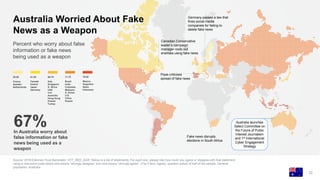
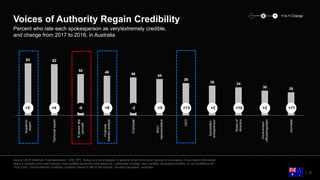
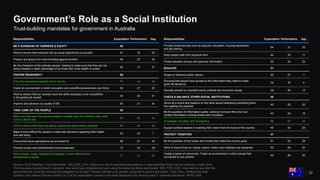
Source: 2018 Edelman Trust Barometer. TRU_INS. [BUSINESS IN GENERAL] Below is a list of institutions. For each one, please indicate how much you trust that
institution to do what is right using a nine-point scale where one means that you “do not trust them at all” and nine means that you “trust them a great deal.“ (Top 4 Box,
Trust) General Population, 28-country global total.
14
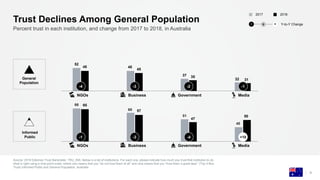
Percent trust in business, and change from 2017 to 2018
Trust in Australian Business Continues to Slide
l llllllllllllllllllllllllllll0 +2 +7 -1 +2 -8 +1 +3 -2 -1 +1 -3 +3 +1 -10 -1 +3 -3 -1 -2 -4 +4 0 0 +4 +3 +7 0 +2
Distrusted in 16 countries
TrustNeutralDistrust
Y-to-Y Change− +0
15. Source: 2018 Edelman Trust Barometer. TRU_IND. Please indicate how much you trust businesses in each of the following industries to do what is
right. Again, please use the same 9-point scale where one means that you “do not trust them at all” and nine means that you “trust them a great deal”.
(Top 4 Box, Trust), industries shown to half of the sample. General Population, Australia.
15
Percent who trust each sector, and change from 2017 to 2018, in
Australia
Trust Declines in All 15 Sectors
39
49 50
53 54 56
60 61 62 62 64
67 68 69 70
Energy
Financialservices
Fashion
Telecommunications
Automotive
Consumerpackaged
goods
Retail
Entertainment
Manufacturing
Professionalservices
Transportation
Foodandbeverage
Technology
Healthcare
Education
l l l l l l l l l l l l l l l-11 -1 -6 -1 -7 -5 -7 -2 -2 -3 -4 -3 -3 -3 -3
TrustNeutralDistrust
Y-to-Y Change− +0
16. 17
22
25
27
33 34
44 44
52 52 53 54
56 57
59
61
66
Mexico
India
China
Brazil
SouthKorea
Spain
Italy
U.S.
France
Japan
Germany
TheNetherlands
Switzerland
Sweden
Canada
U.K.
Australia
Source: 2018 Edelman Trust Barometer. TRU_NAT. Now we would like to focus on global companies headquartered in specific countries. Please indicate
how much you trust global companies headquartered in the following countries to do what is right. Use the same nine-point scale, where one means that
you “do not trust them at all” and nine means that you “trust them a great deal.” (Top 4 Box, Trust), countries shown to half of the sample. General
Population, Australia.
16
Trust in companies headquartered in each country, and change from 2017 to 2018
Aussies Losing Trust in Brand Australia; Not Globally
l l l l l l l l l l l l l l l l l-2 -1 +2 +5 -3 -4 +3 -6 +4 -2 -1 -5 -6 -8 -8 -1 -9
Largest decline for
Brand Australia
TrustNeutralDistrust
Y-to-Y Change− +0
Most Trusted – Global Average
Canada 68%
Switzerland 66%
Sweden 65%
Australia 63%
Germany 62%
Most Trusted – Australia
17. Source: 2018 Edelman Trust Barometer. TRU_NAT. Now we would like to focus on global companies headquartered in specific countries. Please indicate
how much you trust global companies headquartered in the following countries to do what is right. Use the same nine-point scale, where one means that
you “do not trust them at all” and nine means that you “trust them a great deal.” (Top 4 Box, Trust), countries asked of half of the sample. General
Population; 28-country global total, APAC total and APACMEA markets.
17
Australia Excels in Exporting Trust Ahead of APAC
Percent trust in companies headquartered in each market
GLOBAL Australia China Hong Kong India Indonesia Japan Malaysia Singapore S. Africa S. Korea UAE APAC
U.S. 50 44 66 44 78 73 48 49 59 50 57 67 58
UK 57 61 73 59 75 78 48 56 66 60 60 73 64
France 56 52 75 53 74 75 47 51 57 52 60 69 60
Germany 62 53 81 63 78 76 55 56 65 61 68 77 66
Italy 50 44 74 47 68 72 40 49 53 49 53 68 55
Brazil 34 27 65 25 61 62 24 38 34 34 30 57 41
China 36 25 90 27 42 64 7 46 34 32 16 61 39
India 32 22 45 15 86 55 24 36 30 26 27 54 38
Japan 60 52 48 62 83 86 66 72 77 48 44 82 65
Sweden 65 57 77 74 69 74 55 64 74 54 68 71 68
The Netherlands 61 54 75 69 71 73 51 63 70 54 63 69 66
Canada 68 59 78 76 80 76 53 66 75 61 67 79 70
Spain 50 34 72 49 71 70 36 56 58 44 46 67 55
Switzerland 66 56 81 77 78 78 57 71 76 60 70 78 71
S. Korea 43 33 46 48 67 78 12 63 61 33 50 63 51
Mexico 32 17 57 27 61 59 18 39 37 22 29 51 38
Australia 63 66 71 72 79 74 49 70 74 59 60 75 68
Neutral
Trust
Distrust
APACMEA
Locationofcompanyheadquarters
APAC and MEA markets
19. 43
30 31 32 32 32 33 33 34 35 35
39 40 42 42 43 43 43 44 45 47 48 49
52
55 56
61
68
71
Global28
Turkey
Australia
Japan
Sweden
U.K.
France
Ireland
Poland
Russia
S.Africa
Argentina
S.Korea
Germany
U.S.
Brazil
Colombia
HongKong
Spain
Italy
Malaysia
Mexico
Canada
Singapore
TheNetherlands
UAE
India
Indonesia
China
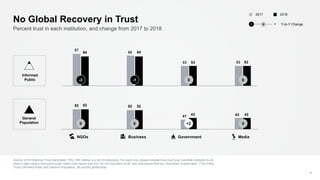
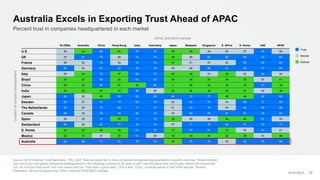
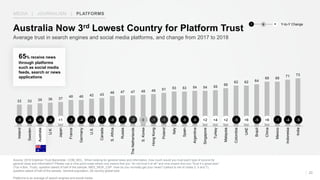
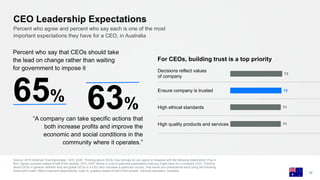
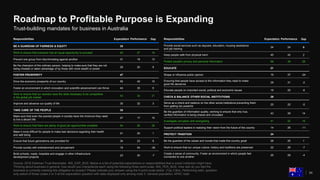
Source: 2018 Edelman Trust Barometer. TRU_INS. [MEDIA IN GENERAL] Below is a list of institutions. For each one, please indicate how much you trust
that institution to do what is right using a nine-point scale where one means that you “do not trust them at all” and nine means that you “trust them a great
deal.“ (Top 4 Box, Trust) General population, 28-country global total.
19
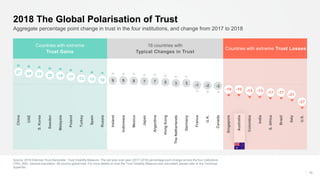
Percent trust in media, and change from 2017 to 2018
Media Now Least Trusted Institution Globally
TrustNeutralDistrust
Distrusted in 22 of 28 of countries
l llllllllllllllllllllllllllll0 +5 -1 0 -1 0 0 +4 +3 +4 -4 -1 0 0 -5 -5 -2 +1 0 -3 +5 +1 +4 -2 +1 +12 -5 +1 +6
Y-to-Y Change− +0
20. Source: 2018 Edelman Trust Barometer. Trust-building mandates Analysis. The most effective trust building mandates for each institution. INS_EXP_MED. Below is a list of potential expectations or
responsibilities that a social institution might have. Thinking about the media in general, how would you characterize each using the following three-point scale. INS_PER_MED. How well do you feel the
media is currently meeting this obligation to society? Please indicate your answer using the 5-point scale below. (Top 2 Box, Performing well), question only asked of those codes 2 or 3 at the expectation
question with data displayed only among code 3. General population, Australia. For more details on the Trust-building mandates Analysis, please refer to the Technical Appendix.
Source: 2018 Edelman Trust Barometer. MED_CON. What consequences are you experiencing as a direct result of the media not doing a good job fulfilling its responsibilities? Question asked of those who
answered codes 1-3 at MED_RSP. General population, Australia.
20
Top three trust-building mandates for
media, and percent who say the media is
performing well or very well against
them, in Australia
Media Failing
to Meet Highest
Priority Mandate Trust-Building Mandate Performance Score
Guard information quality 26
Educate on important social, political
and economic issues
45
Investigate corruption and
wrongdoing
46
%
%
%
MEDIA | JOURNALISM | PLATFORMS
21. Source: 2018 Edelman Trust Barometer. ATT_MED_AGR. Below is a list of statements. For each one, please rate how much you agree or disagree with
that statement using a nine-point scale where one means “strongly disagree” and nine means “strongly agree”. (Top 4 Box, Agree), question asked of half
of the sample. General population, Australia.
21
Percent who agree that …
Uncertainty Over
Real vs. Fake News
65%
Dont know how to tell good
journalism from rumour or
falsehoods
58%
It is becoming harder to tell if a
piece of news was produced by a
respected media organisation
MEDIA | JOURNALISM | PLATFORMS
I am not sure what is true
and what is not
65%
22. Source: 2018 Edelman Trust Barometer. ATT_MED_AGR. Below is a list of statements. For each one, please rate how much you agree or disagree with that statement
using a nine-point scale where one means “strongly disagree” and nine means “strongly agree”. (Top 4 Box, Agree), question asked of half of the sample. General
population, Australia.
22
Percent who worry about false
information or fake news
being used as a weapon
Australia Worried About Fake
News as a Weapon
Pope criticizes
spread of fake news
Fake news disrupts
elections in South Africa
Germany passes a law that
fines social media
companies for failing to
delete fake news
Australia launches
Select Committee on
the Future of Public
Interest Journalism
and 1st International
Cyber Engagement
Strategy
In Australia worry about
false information or fake
news being used as a
weapon
67%
Canadian Conservative
leader’s campaign
manager roots out
enemies using fake news
55-60 61-65 66-70 71-75 76-80
France
Sweden
Netherlands
Canada
Ireland
Japan
Germany
Italy
Singapore
S. Africa
UAE
U.K.
Australia
Hong Kong
Poland
Turkey
Brazil
India
Colombia
Malaysia
S. Korea
U.S.
China
Russia
Mexico
Argentina
Spain
Indonesia
23. 33 33 35 36 37
40 40 42 43
46 47 47 48 49 51 53 53 54 54 55
58
62 62 64
68 68
71 73
Ireland
Sweden
Australia
U.K.
Japan
France
Germany
U.S.
Canada
S.Africa
Russia
TheNetherlands
S.Korea
HongKong
Poland
Italy
Spain
Argentina
Singapore
Turkey
Malaysia
Colombia
UAE
Brazil
China
Mexico
Indonesia
India
Source: 2018 Edelman Trust Barometer. COM_MCL. When looking for general news and information, how much would you trust each type of source for
general news and information? Please use a nine-point scale where one means that you “do not trust it at all” and nine means that you “trust it a great deal.”
(Top 4 Box, Trust), question asked of half of the sample. MED_NEW_CSP. How do you normally get your news? (callout is net of codes 2, 5 and 7),
question asked of half of the sample. General population, 28-country global total.
Platforms is an average of search engines and social media.
23
Average trust in search engines and social media platforms, and change from 2017 to 2018
Australia Now 3rd Lowest Country for Platform Trust
65% receive news
through platforms
such as social media
feeds, search or news
applications
llllllllllllllllllllllllllll-8 -4 -8 -4 +1 -3 -4 -11 -1 -8 -1 -3 0 -1 -1 -5 -6 -6 +2 +4 +2 -5 +6 -5 +6 -1 -4 -5
MEDIA | JOURNALISM | PLATFORMS
Y-to-Y Change− +0
24. Source: 2018 Edelman Trust Barometer. COM_MCL. When looking for general news and information, how much would you trust each type of source for
general news and information? Please use a nine-point scale where one means that you “do not trust it at all” and nine means that you “trust it a great deal.”
(Top 4 Box, Trust), question asked of half of the sample. General population, Australia.
Journalism is an average of traditional media and online-only media. Platforms is an average of search engines and social media.
24
Percent trust in each source for general news
and information, 2012 to 2018, in Australia
While Trust in Platforms Declines,
Trust in Journalism Rebounds
Platforms
-8
Journalism
+11
Average trust in search engines
and social media platforms
Average trust in traditional
and online-only media
48
40
45
40
47
41
52
44
36
39
43
44
43
35
2012 2013 2014 2015 2016 2017 2018
MEDIA | JOURNALISM | PLATFORMS
25. Source: 2018 Edelman Trust Barometer. MED_SPF_SRC. BASE: BLOCK B RESPONDENTS Please indicate how important each of the following is in
making this one of your favorite media sources using the 6-point scale below where zero means the statement is “not an accurate description of this media
source”, one means the statement is “true of this media source, but it is not at all important in making this source one of my favorites” and five means the
statement is “true and it is extremely important in making this source one of my favorites”.
25
The Media Trust Formula
60% agree
“Focus more on facts than on
opinion and commentary.”
64% agree
“Engages in high quality
investigative journalism.”
68% agree
“Their main focus is on the news
and not on the media personalities
delivering the news.”
27. 63 62
50 48 46 44
39
36 34
30 28
Academic
expert
Technicalexpert
Apersonlike
yourself
Financial
industryanalyst
Employee
NGO
representative
CEO
Successful
entrepreneur
Boardof
directors
Government
official/regulator
Journalist
Source: 2018 Edelman Trust Barometer. CRE_PPL. Below is a list of people. In general, when forming an opinion of a company, if you heard information
about a company from each person, how credible would the information be—extremely credible, very credible, somewhat credible, or not credible at all?
(Top 2 Box, Very/Extremely Credible), question asked of half of the sample. General population, Australia.
27
Percent who rate each spokesperson as very/extremely credible,
and change from 2017 to 2018, in Australia
Voices of Authority Regain Credibility
+5 +4 -6 +9 -2 +5 +13 +2 +10 +2 +11
− Y-to-Y Change+0
28. CEO Leadership Expectations
Source: 2018 Edelman Trust Barometer. CEO_AGR. Thinking about CEOs, how strongly do you agree or disagree with the following statements? (Top 4
Box, Agree), question asked of half of the sample. CEO_EXP. Below is a list of potential expectations that you might have for a company CEO. Thinking
about CEOs in general, whether they are global CEOs or a CEO who oversees a particular country, how would you characterize each using the following
three-point scale? (Most important responsibility, code 3), question asked of half of the sample. General population, Australia.
28
Percent who agree and percent who say each is one of the most
important expectations they have for a CEO, in Australia
Percent who say that CEOs should take
the lead on change rather than waiting
for government to impose it
71
71
72
73
For CEOs, building trust is a top priority
65%
Ensure company is trusted
Decisions reflect values
of company
High ethical standards
High quality products and services
“A company can take specific actions that
both increase profits and improve the
economic and social conditions in the
community where it operates.”
63%
30. Source: 2018 Edelman Trust Barometer. TMA_SIE_SHV. Please indicate how much you agree or disagree with the following statements. (Top 4 Box,
Agree), question asked of half of the sample. CEO_AGR. Thinking about CEOs, how strongly do you agree or disagree with the following statements?
(Top4 Box, Agree), question asked of half of the sample. General population, Australia.
30
Percent who agree that …
Business Must Show
Commitment to Long-Term
49%
Companies that only
think about themselves
and their profits are
bound to fail
66%
CEOs are driven more
by greed than a desire
to make a positive
difference in the world
31. 72
57 57
60 60 62 64 65 66 68 68
71 71 71 71 72 72 72 73 74 75 76
79 80 81 82 83
86
90
Global28
Japan
S.Korea
Argentina
France
Turkey
Russia
Spain
Ireland
HongKong
Poland
Germany
S.Africa
Sweden
U.K.
Brazil
Italy
Malaysia
Singapore
Australia
Canada
UAE
U.S.
Mexico
TheNetherlands
China
Colombia
India
Indonesia
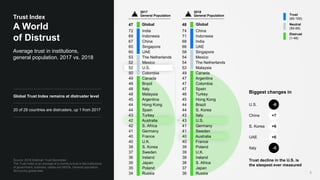
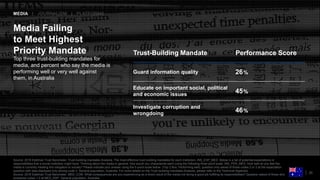
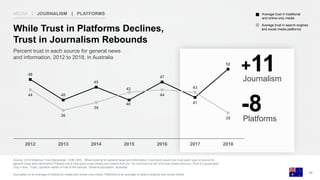
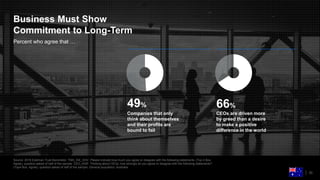
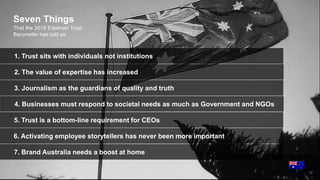
Source: 2018 Edelman Trust Barometer. TRU_INS. [YOUR EMPLOYER] Below is a list of institutions. For each one, please indicate how much you trust that institution to do what is right using a
nine-point scale where one means that you “do not trust them at all” and nine means that you “trust them a great deal.“ (Top 4 Box, Trust) General population, 28-country global total.
Note: 2016 data was taken from Q525-526. Thinking about your own company and other companies in your industry, please indicate how much you trust each to do what is right using a 9-point
scale where one means that you “do not trust them at all” and nine means that you “trust them a great deal”. (Top 4 Box, Trust), question asked of half of the sample. General population, 28-country
global total.
31
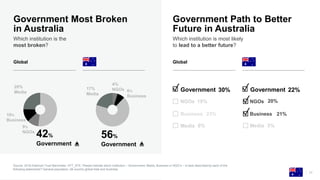
Percent trust in employer, and change from 2016 to 2018
Australia has 2nd Biggest Increase in Employer
Trust Worldwide
TrustNeutralDistrust
l llllllllllllllllllllllllllll+7 +17 +2 -18 +12 -2 +16 +2 +6 +9 +12 +9 -1 +21 +14 -5 +14 -4 0 +20 +11 0 +15 -9 +19 +3 -2 +3 +13
Change, 2016 to 2018− +0
+20
33. 3333
Trust-building mandate for government in APAC
Source: 2018 Edelman Trust Barometer. INS_EXP_GOV. Below is a list of potential expectations or responsibilities that a social institution might have.
Thinking about government in general, how would you characterize each using the following three-point scale. INS_PER_GOV. How well do you feel the
government is currently meeting this obligation to society? Please indicate your answer using the 5-point scale below. (Top 2 Box, Performing well),
question only asked of those codes 2 or 3 at the expectation question with data displayed only among code 3. General population, APAC total.
Responsibilities Expectation Performance Gap
BE A GUARDIAN OF FAIRNESS & EQUITY 50
Work to ensure that everyone has an equal opportunity to succeed 51 18 33
Prevent one group from discriminating against another 48 22 26
Be the champion of the ordinary person, helping to make sure that they are not
being cheated or taken advantage of by those with more wealth or power
50 13 37
FOSTER PROSPERITY 56
Drive the economic prosperity of our country 73 23 50
Foster an environment in which innovation and scientific advancement can thrive 52 27 25
Work to ensure that our workers have the skills necessary to be competitive
in the global job market
44 23 21
Improve and advance our quality of life 55 21 34
TAKE CARE OF THE PEOPLE 50
Make sure that even the poorest people in society have the minimum they need
to live a decent life
64 20 44
Work to ensure that there are plenty of good job opportunities available 58 20 38
Make it more difficult for people to make bad decisions regarding their health
and well being
23 22 1
Ensure that future generations are provided for 56 21 35
Provide society with entertainment and amusement 13 33 -20
Build schools, roads, hospitals and engage in other infrastructure
development projects
77 32 45
Responsibilities Expectation Performance Gap
Provide social services such as daycare, education, housing assistance
and job training
64 31 33
Keep people safe from physical harm 44 33 11
Protect people's privacy and personal information 55 32 23
EDUCATE 31
Shape or influence public opinion 20 21 -1
Ensuring that people have access to the information they need to make
good life decisions
34 30 4
Educate people on important social, political and economic issues 39 26 13
CHECK & BALANCE OTHER SOCIAL INSTITUTIONS 48
Serve as a check and balance on the other social institutions preventing them
from getting too powerful
40 20 20
Be the guardian of information quality, working to ensure that only true,
verified information is being shared and circulated
40 24 16
Investigate corruption and wrongdoing 66 22 44
Support political leaders in realizing their vision from the future of the country 45 25 20
PROTECT TRADITION 47
Be the guardian of the values and morals that made this country great 51 22 29
Work to ensure that our unique culture, history and traditions are preserved 50 26 24
Create a sense of community. Foster an environment in which people feel
connected to one another
40 20 20
Trust-building mandate for government in APACTrust-building mandates for government in Australia
Government’s Role as a Social Institution
34. Roadmap to Profitable Purpose is Expanding
34
Trust-building mandates for business in Australia
Responsibilities Expectation Performance Gap
Provide social services such as daycare, education, housing assistance
and job training
24 24 0
Keep people safe from physical harm 45 43 2
Protect people's privacy and personal information 66 38 28
EDUCATE 21
Shape or influence public opinion 15 37 -24
Ensuring that people have access to the information they need to make
good life decisions
29 31 -2
Educate people on important social, political and economic issues 19 25 -6
CHECK & BALANCE OTHER SOCIAL INSTITUTIONS 29
Serve as a check and balance on the other social institutions preventing them
from getting too powerful
20 25 -5
Be the guardian of information quality, working to ensure that only true,
verified information is being shared and circulated
43 29 14
Investigate corruption and wrongdoing 41 22 19
Support political leaders in realizing their vision from the future of the country 14 25 -11
PROTECT TRADITION 24
Be the guardian of the values and morals that made this country great 26 25 1
Work to ensure that our unique culture, history and traditions are preserved 22 29 -7
Create a sense of community. Foster an environment in which people feel
connected to one another
25 29 -4
Source: 2018 Edelman Trust Barometer. INS_EXP_BUS. Below is a list of potential expectations or responsibilities that a social institution might have.
Thinking about business in general, how would you characterize each using the following three-point scale. INS_PER_BUS. How well do you feel the
business is currently meeting this obligation to society? Please indicate your answer using the 5-point scale below. (Top 2 Box, Performing well), question
only asked of those codes 2 or 3 at the expectation question with data displayed only among code 3. General population, APAC total.
Responsibilities Expectation Performance Gap
BE A GUARDIAN OF FAIRNESS & EQUITY 35
Work to ensure that everyone has an equal opportunity to succeed 45 27 18
Prevent one group from discriminating against another 31 18 13
Be the champion of the ordinary person, helping to make sure that they are not
being cheated or taken advantage of by those with more wealth or power
29 20 9
FOSTER PROSPERITY 47
Drive the economic prosperity of our country 55 40 15
Foster an environment in which innovation and scientific advancement can thrive 44 35 9
Work to ensure that our workers have the skills necessary to be competitive
in the global job market
53 32 21
Improve and advance our quality of life 35 32 3
TAKE CARE OF THE PEOPLE 35
Make sure that even the poorest people in society have the minimum they need
to live a decent life
27 17 10
Work to ensure that there are plenty of good job opportunities available 54 26 28
Make it more difficult for people to make bad decisions regarding their health
and well being
21 20 1
Ensure that future generations are provided for 34 23 9
Provide society with entertainment and amusement 18 54 -36
Build schools, roads, hospitals and engage in other infrastructure
development projects
23 30 -7
35. 35
That the 2018 Edelman Trust
Barometer has told us
Seven Things
1. Trust sits with individuals not institutions
2. The value of expertise has increased
3. Journalism as the guardians of quality and truth
4. Businesses must respond to societal needs as much as Government and NGOs
5. Trust is a bottom-line requirement for CEOs
6. Activating employee storytellers has never been more important
7. Brand Australia needs a boost at home