Download to read offline
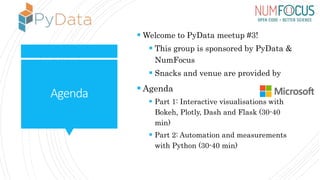
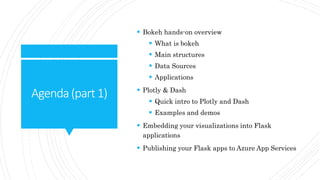


The document outlines the agenda for PyData Meetup #3, focusing on interactive visualizations using tools like Bokeh, Plotly, and Dash, along with automation techniques using Python. It includes hands-on overviews of these visualization libraries, integrating them with Flask applications, and deploying to Azure. Resources and documentation supporting the presentation are also provided.