Download to read offline
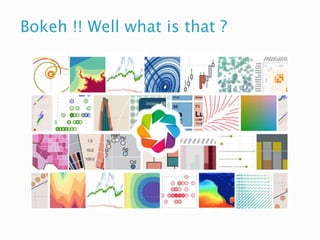

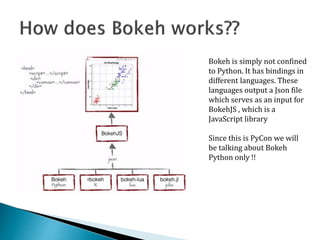
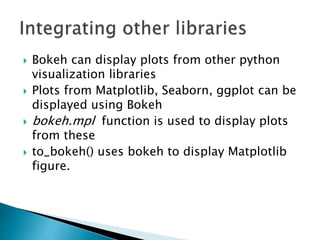


Bokeh is an interactive Python visualization library that targets modern web browsers for presentation. It aims to provide elegant and concise construction of novel graphics in D3.js style, with high-performance interactivity over large or streaming datasets. Bokeh can help create interactive plots, dashboards, and data applications. It outputs JSON files that serve as input for the BokehJS JavaScript library. While it has bindings for other languages, this discussion will focus on Bokeh's Python capabilities, which include basic and advanced charting features. Bokeh can also display plots from libraries like Matplotlib, Seaborn, and ggplot.