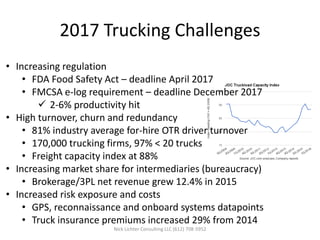
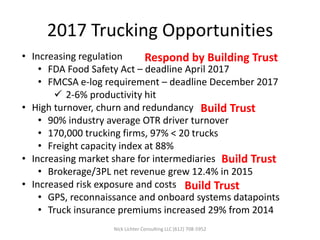
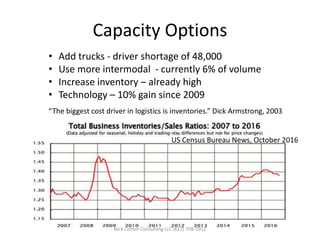
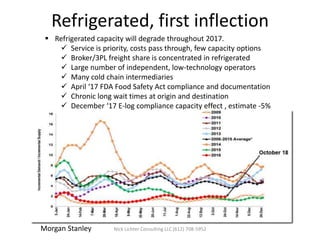
Nick Lichter Consulting LLC (612) 708-5952
Trucking 2017
Key facts for planning capacity,
service and costs in the year ahead.
2017 Trucking Challenges
• Increasing regulation
• FDA Food Safety Act – deadline April 2017
• FMCSA e-log requirement – deadline December 2017
 2-6% productivity hit
• High turnover, churn and redundancy
• 81% industry average for-hire OTR driver turnover
• 170,000 trucking firms, 97% < 20 trucks
• Freight capacity index at 88%
• Increasing market share for intermediaries (bureaucracy)
• Brokerage/3PL net revenue grew 12.4% in 2015
• Increased risk exposure and costs
• GPS, reconnaissance and onboard systems datapoints
• Truck insurance premiums increased 29% from 2014
Nick Lichter Consulting LLC (612) 708-5952
2017 Trucking Opportunities
• Increasing regulation
• FDA Food Safety Act – deadline April 2017
• FMCSA e-log requirement – deadline December 2017
 2-6% productivity hit
• High turnover, churn and redundancy
• 90% industry average OTR driver turnover
• 170,000 trucking firms, 97% < 20 trucks
• Freight capacity index at 88%
• Increasing market share for intermediaries (bureaucracy)
• Brokerage/3PL net revenue grew 12.4% in 2015
• Increased risk exposure and costs
• GPS, reconnaissance and onboard systems datapoints
• Truck insurance premiums increased 29% from 2014
Respond by Building Trust
Build Trust
Build Trust
Build Trust
Nick Lichter Consulting LLC (612) 708-5952
Capacity Options
• Add trucks - driver shortage of 48,000
• Use more intermodal - currently 6% of volume
• Increase inventory – already high
• Technology – 10% gain since 2009
ā€œThe biggest cost driver in logistics is inventories.ā€ Dick Armstrong, 2003
Nick Lichter Consulting LLC (612) 708-5952
US Census Bureau News, October 2016
Capacity Options
• Add trucks - driver shortage of 48,000
• Use more intermodal - currently 6% of volume
• Increase inventory – already high
• Technology – 10% gain since 2009
ā€œThe biggest cost driver in logistics is inventories.ā€ Dick Armstrong, 2003
Nick Lichter Consulting LLC (612) 708-5952
Cost impact
Service impact
Cost impact
Cost impact
US Census Bureau News, October 2016
Service Options
• Truck/Rail Intermodal – ~700 mile trip length
 Threshold costs of 3-4%
 Rail prices linehaul at 95% of OTR
 Additional 1-2 days transit time
 Drayage coordination
 Limited load/unload nodes
 Scheduling issues
 Multi-party risks
• 3PL/Brokerage – 15% gross margin
 Co-broker regulation
 Multi-party risks
 Rate accelerators (both up and down)
• Private fleet – driver shortage
 Liability
 Market focus
• OTR for-hire – 4+% net profit
 Cost pressure from drivers, equipment, insurance
 Contract or dedicated
Nick Lichter Consulting LLC (612) 708-5952
Service Options
• Truck/Rail Intermodal – ~700 mile trip length
 Threshold costs of 3-4%
 Rail prices linehaul at 95% of OTR
 Additional 1-2 days transit time
 Drayage coordination
 Limited load/unload nodes
 Scheduling issues
 Multi-party risks
• 3PL/Brokerage – 15% gross margin
 Co-broker regulation
 Multi-party risks
 Rate accelerators (both up and down)
• Private fleet – driver shortage
 Liability
 Market focus
• OTR for-hire – 4+% net profit
 Cost pressure from drivers, equipment, insurance
 Contract or dedicated
Service impact
Cost impact
Cost/Service/Capacity impact
Cost/Capacity impact
Nick Lichter Consulting LLC (612) 708-5952
Total trucking
revenues
$726.4 million
(JOC.com)
45%
Private
Fleet.
(ATA)
55%
OTR
For-hire
(ATA)
Primarily price-based trucking.
Revenues are paid by outside
parties. Rates are determined by
market conditions.
Primarily cost-based trucking.
ā€œRevenuesā€ are internal to the
company. ā€œRatesā€ are too.
2015 Trucking Market
=~ 7% Brokers/3PL React to market conditions.
• Leverage rates up when trucks are
scarce.
• Leverage rates down when there is
overcapacity.
Brokerage/3PL growing 3X industry
Nick Lichter Consulting LLC (612) 708-5952
Total trucking
revenues
$726.4 million
backhaul
Broker leverage on rates
7% Brokers/3PL
• 7% of overall market
• 12.7% OTR market
• ~ 25% backhaul market
• ~ 50% spot (instant) market
OTR
For-hire
12.7% Brokers/3PL
25%Brokers/3PL
spot
50%Brokers/3PL
Nick Lichter Consulting LLC (612) 708-5952
The Swing Factor
Nick Lichter Consulting LLC (612) 708-5952
ā€œThe swing factor is IP (US Industrial Production), which is likely to be
weak until late Q3 2016 or early Q4 2016.ā€ Thom Albrecht BBC Capital
Partners, Logistics Management, July 2016
Peak IP
August 2014
Cost Control Options
Nick Lichter Consulting LLC (612) 708-5952
Service/Capacity impact
Peak contract
rates, ~August 2014
Refrigerated, first inflection
Nick Lichter Consulting LLC (612) 708-5952
ļ‚§ Refrigerated capacity will degrade throughout 2017.
 Service is priority, costs pass through, few capacity options
 Broker/3PL freight share is concentrated in refrigerated
 Large number of independent, low-technology operators
 Many cold chain intermediaries
 April ā€˜17 FDA Food Safety Act compliance and documentation
 Chronic long wait times at origin and destination
 December ā€˜17 E-log compliance capacity effect , estimate -5%
Morgan Stanley
2017 Outlook Summary
• Freight market capacity, service and cost are inter-related
• Overall US market expected to grow ~ 2.4%.
• Trucking industry faces capacity and productivity constraints due to driver shortage,
e-log compliance, high inventories.
• Refrigerated market is especially exposed.
 Many small carriers not yet e-log compliant
 Many cold chain intermediaries – slow to adapt
• Industry cost pressures from driver wages, insurance and rising equipment
costs will push rates upwards. My estimate is 5-10% higher than 2015 levels.
• Domino effect into other freight market sectors .
• Brokerage/3PL own a growing market share. They accelerate and magnify
rate increases. Expect increasingly frequent rate actions from Q2 2017.
Build trust and capture opportunity in this dynamic market.
Nick Lichter Consulting LLC
W5286 Boma Road
La Crosse, WI 54601
(612) 708 5952
nlichter2@gmail.com
Building Trust Between Shippers,
Carriers and Intermediaries
What’s best for your stakeholders?
Where is the spend that matters?
Where are the biggest challenges?
What services are on the table?
When is your timeframe for results?
Who are you going to work with?
What’s your bottom line?
Why?
Build trust and capture opportunity in this dynamic market.
Nick Lichter Consulting LLC
W5286 Boma Road
La Crosse, WI 54601
(612) 708 5952
nlichter2@gmail.com

2017 Freight Outlook

  • 1.
    Nick Lichter ConsultingLLC (612) 708-5952 Trucking 2017 Key facts for planning capacity, service and costs in the year ahead.
  • 2.
    2017 Trucking Challenges •Increasing regulation • FDA Food Safety Act – deadline April 2017 • FMCSA e-log requirement – deadline December 2017  2-6% productivity hit • High turnover, churn and redundancy • 81% industry average for-hire OTR driver turnover • 170,000 trucking firms, 97% < 20 trucks • Freight capacity index at 88% • Increasing market share for intermediaries (bureaucracy) • Brokerage/3PL net revenue grew 12.4% in 2015 • Increased risk exposure and costs • GPS, reconnaissance and onboard systems datapoints • Truck insurance premiums increased 29% from 2014 Nick Lichter Consulting LLC (612) 708-5952
  • 3.
    2017 Trucking Opportunities •Increasing regulation • FDA Food Safety Act – deadline April 2017 • FMCSA e-log requirement – deadline December 2017  2-6% productivity hit • High turnover, churn and redundancy • 90% industry average OTR driver turnover • 170,000 trucking firms, 97% < 20 trucks • Freight capacity index at 88% • Increasing market share for intermediaries (bureaucracy) • Brokerage/3PL net revenue grew 12.4% in 2015 • Increased risk exposure and costs • GPS, reconnaissance and onboard systems datapoints • Truck insurance premiums increased 29% from 2014 Respond by Building Trust Build Trust Build Trust Build Trust Nick Lichter Consulting LLC (612) 708-5952
  • 4.
    Capacity Options • Addtrucks - driver shortage of 48,000 • Use more intermodal - currently 6% of volume • Increase inventory – already high • Technology – 10% gain since 2009 ā€œThe biggest cost driver in logistics is inventories.ā€ Dick Armstrong, 2003 Nick Lichter Consulting LLC (612) 708-5952 US Census Bureau News, October 2016
  • 5.
    Capacity Options • Addtrucks - driver shortage of 48,000 • Use more intermodal - currently 6% of volume • Increase inventory – already high • Technology – 10% gain since 2009 ā€œThe biggest cost driver in logistics is inventories.ā€ Dick Armstrong, 2003 Nick Lichter Consulting LLC (612) 708-5952 Cost impact Service impact Cost impact Cost impact US Census Bureau News, October 2016
  • 6.
    Service Options • Truck/RailIntermodal – ~700 mile trip length  Threshold costs of 3-4%  Rail prices linehaul at 95% of OTR  Additional 1-2 days transit time  Drayage coordination  Limited load/unload nodes  Scheduling issues  Multi-party risks • 3PL/Brokerage – 15% gross margin  Co-broker regulation  Multi-party risks  Rate accelerators (both up and down) • Private fleet – driver shortage  Liability  Market focus • OTR for-hire – 4+% net profit  Cost pressure from drivers, equipment, insurance  Contract or dedicated Nick Lichter Consulting LLC (612) 708-5952
  • 7.
    Service Options • Truck/RailIntermodal – ~700 mile trip length  Threshold costs of 3-4%  Rail prices linehaul at 95% of OTR  Additional 1-2 days transit time  Drayage coordination  Limited load/unload nodes  Scheduling issues  Multi-party risks • 3PL/Brokerage – 15% gross margin  Co-broker regulation  Multi-party risks  Rate accelerators (both up and down) • Private fleet – driver shortage  Liability  Market focus • OTR for-hire – 4+% net profit  Cost pressure from drivers, equipment, insurance  Contract or dedicated Service impact Cost impact Cost/Service/Capacity impact Cost/Capacity impact Nick Lichter Consulting LLC (612) 708-5952
  • 8.
    Total trucking revenues $726.4 million (JOC.com) 45% Private Fleet. (ATA) 55% OTR For-hire (ATA) Primarilyprice-based trucking. Revenues are paid by outside parties. Rates are determined by market conditions. Primarily cost-based trucking. ā€œRevenuesā€ are internal to the company. ā€œRatesā€ are too. 2015 Trucking Market Nick Lichter Consulting LLC (612) 708-5952
  • 9.
    Total trucking revenues $726.4 million (JOC.com) 45% Private Fleet. (ATA) 55% OTR For-hire (ATA) Primarilyprice-based trucking. Revenues are paid by outside parties. Rates are determined by market conditions. Primarily cost-based trucking. ā€œRevenuesā€ are internal to the company. ā€œRatesā€ are too. 2015 Trucking Market =~ 7% Brokers/3PL React to market conditions. • Leverage rates up when trucks are scarce. • Leverage rates down when there is overcapacity. Brokerage/3PL growing 3X industry Nick Lichter Consulting LLC (612) 708-5952
  • 10.
    Total trucking revenues $726.4 million backhaul Brokerleverage on rates 7% Brokers/3PL • 7% of overall market • 12.7% OTR market • ~ 25% backhaul market • ~ 50% spot (instant) market OTR For-hire 12.7% Brokers/3PL 25%Brokers/3PL spot 50%Brokers/3PL Nick Lichter Consulting LLC (612) 708-5952
  • 11.
    The Swing Factor NickLichter Consulting LLC (612) 708-5952 ā€œThe swing factor is IP (US Industrial Production), which is likely to be weak until late Q3 2016 or early Q4 2016.ā€ Thom Albrecht BBC Capital Partners, Logistics Management, July 2016 Peak IP August 2014
  • 12.
    Cost Control Options NickLichter Consulting LLC (612) 708-5952 Service/Capacity impact Peak contract rates, ~August 2014
  • 13.
    Refrigerated, first inflection NickLichter Consulting LLC (612) 708-5952 ļ‚§ Refrigerated capacity will degrade throughout 2017.  Service is priority, costs pass through, few capacity options  Broker/3PL freight share is concentrated in refrigerated  Large number of independent, low-technology operators  Many cold chain intermediaries  April ā€˜17 FDA Food Safety Act compliance and documentation  Chronic long wait times at origin and destination  December ā€˜17 E-log compliance capacity effect , estimate -5% Morgan Stanley
  • 14.
    2017 Outlook Summary •Freight market capacity, service and cost are inter-related • Overall US market expected to grow ~ 2.4%. • Trucking industry faces capacity and productivity constraints due to driver shortage, e-log compliance, high inventories. • Refrigerated market is especially exposed.  Many small carriers not yet e-log compliant  Many cold chain intermediaries – slow to adapt • Industry cost pressures from driver wages, insurance and rising equipment costs will push rates upwards. My estimate is 5-10% higher than 2015 levels. • Domino effect into other freight market sectors . • Brokerage/3PL own a growing market share. They accelerate and magnify rate increases. Expect increasingly frequent rate actions from Q2 2017. Build trust and capture opportunity in this dynamic market. Nick Lichter Consulting LLC W5286 Boma Road La Crosse, WI 54601 (612) 708 5952 nlichter2@gmail.com
  • 15.
    Building Trust BetweenShippers, Carriers and Intermediaries What’s best for your stakeholders? Where is the spend that matters? Where are the biggest challenges? What services are on the table? When is your timeframe for results? Who are you going to work with? What’s your bottom line? Why? Build trust and capture opportunity in this dynamic market. Nick Lichter Consulting LLC W5286 Boma Road La Crosse, WI 54601 (612) 708 5952 nlichter2@gmail.com