Download to read offline

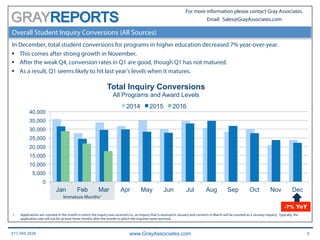
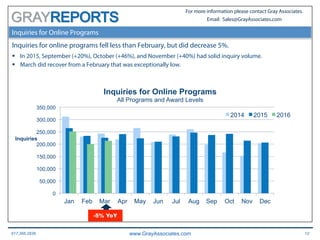
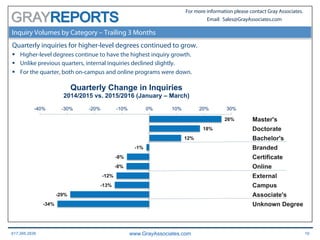
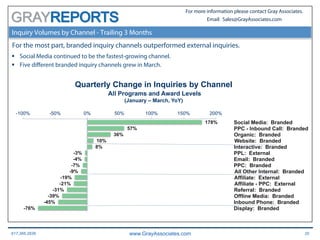


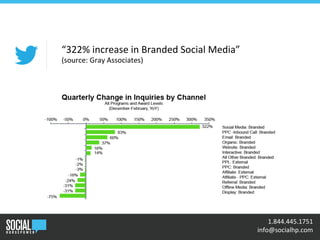

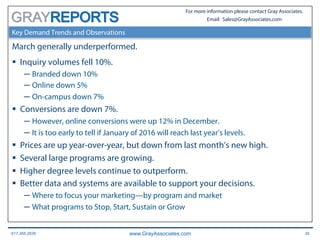


The document from Gray Associates presents trends in higher education inquiries and conversions, highlighting a 10% decline in overall inquiry volumes and a significant drop in both branded and external inquiries. Several programs, including criminal justice and registered nursing, saw growth despite a general downturn, while on-campus program inquiries fell by 7%. The analysis emphasizes fluctuating conversion rates and the need for education institutions to adapt to changing demand patterns.


![Gray Associates - Understanding Program Economics [Live Webcast]](https://cdn.slidesharecdn.com/ss_thumbnails/grayassociates-understandingprogrameconomicswebcast9112018-180911193942-thumbnail.jpg?width=640&height=640&fit=bounds)


