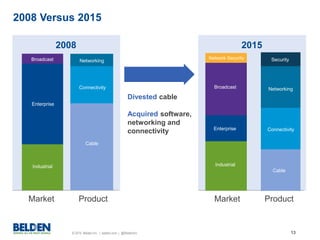
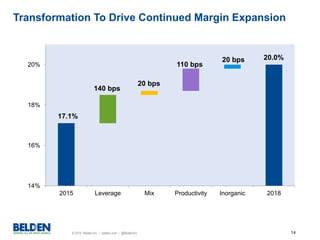
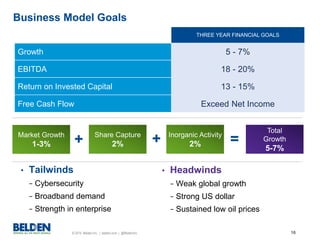
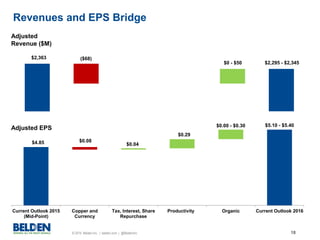
© 2015 Belden Inc. | belden.com | @BeldenInc
December 2015
Belden
Leading the Way to an
Interconnected World
© 2015 Belden Inc. | belden.com | @BeldenInc 2
Leading The Way to an Interconnected World
Delivering highly-engineered signal transmission
solutions for mission-critical applications in a diverse set of global markets
Business Platforms Applications Vertical Markets
Data
Sound
Video
Industrial
Enterprise
Broadcast
© 2015 Belden Inc. | belden.com | @BeldenInc 3
Five Business Platforms Delivering
Innovative Connectivity Solutions
Broadcast Enterprise
Industrial
Connectivity
Industrial IT
Solutions
Network
Security
• Industrial and I/O
Connectors
• Industrial Cable
• Distribution Boxes
• Customized
Connectivity Solutions
• Ethernet Switches
• Wireless Systems
• Routers and
Gateways
• Security Devices
• Network Management
Software
• Copper and Fiber
Connectivity
• Racks and Enclosures
• Ethernet, Fiber Optic
and Coaxial Cabling
• Custom Infrastructure
Solutions
• Routers and Interfaces
• Broadcast Connectors
• Broadband
Connectivity
• Multi-Viewers and
Monitoring and Control
Systems
• Playout Systems
• Vulnerability
Assessment
• Security Configuration
Management
• Log Intelligence
• Analytics and
Reporting
© 2015 Belden Inc. | belden.com | @BeldenInc 4
A Global Signal Transmission Solutions Company
Broadcast
Enterprise
Connectivity
Industrial
Connectivity
Industrial IT
Network
Security
Market Size1
$4.9B $3.3B $4.0B $1.3B $4.3B
3-Year Market
Growth Rate
1-3% 1-3% 0-2% 1-3% 10-12%
Market Share1
19% 14% 16% 20% 4%
TTM Revenue2
$914.3M $446.6M $635.3M $257.5M $165.0M
TTM EBITDA
Margin3 15.2% 15.2% 16.1% 18.5% 25.3%
Key Markets
• Broadband
• Broadcast
Studios
• Mobile
Production
• Finance
• Healthcare
• Commercial
Buildings
• Discrete
• Process
• Energy
• Transportation
• Finance
• Energy
• Retail
• Government
• Industrial
1. Served addressable market.
2. Based on 12 trailing months. Network Security figures are expected 2015 results.
3. See appendix for additional operating segment information.
© 2015 Belden Inc. | belden.com | @BeldenInc 5
Financial Performance
Revenues (M) EBITDA Margin1 Return on
Invested Capital2 Free Cash Flow4
2005 $1,246 8.5% 4.1% $37M
2015E3 $2,363 17.1% 11.7% ~$180M
Variance 6.6% CAGR
Improvement of
860 bps
Average of
13.1%
17.1% CAGR
Driving best-in-class shareholder value
1. Non-GAAP results. See appendix for reconciliation to comparable GAAP results.
2. Excluding excess cash, Average of 2012-2015.
3. Based on midpoint of guidance.
4. See appendix for reconciliation to comparable GAAP results.
© 2015 Belden Inc. | belden.com | @BeldenInc 6
A Disciplined Capital Deployment Strategy
Innovation and
Market Expansion
Share
Repurchase
M&A
Invest in
growth opportunities
Repurchase Belden stock
at attractive prices
Identify product and market
opportunities, and acquire with
a disciplined approach
• Product innovation
• Productivity
improvement
• Capital expenditure
• Repurchased 7.4 million
shares at $47.43 average
• ~16% of outstanding
shares
• $350M invested since
2011
• $2.8 billion invested
since 2007
• >15% Cash ROIC on
acquisitions made
before 2012
2015 ROIC* = 11.7%
Deploy capital to highest ROIC project
* ROIC excluding excess cash based on mid-point of guidance
© 2015 Belden Inc. | belden.com | @BeldenInc 7
Connectivity Peers
Cable Peers
10.0%
20.0%
30.0%
40.0%
50.0%
2005 2006 2007 2008 2009 2010 2011 2012 2013 2014 2015
YTD
A Common Misperception About Belden
“Belden is a Wire and Cable company.”
Improvement of
1,870 bps
Belden’s Gross Profit Margin Exceeds Connectivity Peers
1. Adjusted results. See appendix for reconciliation to comparable GAAP results.
© 2015 Belden Inc. | belden.com | @BeldenInc 8
10%
12%
14%
16%
18%
20%
2010 2011 2012 2013 2014 2015
Consistent Margin Progression
We have shown the ability to consistently
improve margins in a low-growth environment
EBITDA
Margin
Goal:
18 - 20%
11.9% 11.7%
13.0%
15.7% 15.5%
EBITDA Margin (%)1
17.1%2
Peer Average
1. Non-GAAP results. See appendix for reconciliation to comparable GAAP results.
2. 2015 based on mid-point of guidance
© 2015 Belden Inc. | belden.com | @BeldenInc 9
10 Year EPS Growth
0%
5%
10%
15%
20%
25%
Peer A S&P 500 Peer B Peer C Peer D Belden
Since 2005, Belden has generated
upper quartile EPS growth of 22%
© 2015 Belden Inc. | belden.com | @BeldenInc 10
High Quality Earnings: Free Cash Flow Generation
Delivering 22% CAGR in free cash flow per share
0
1
2
3
4
5
6
2005 2006 2007 2008 2009 2010 2011 2012 2013 2014 2015
FCF per Share1
1. Non-GAAP results. See appendix for reconciliation to comparable GAAP results
2. Excludes the cash payments for the Broadcast restructuring program that began in Q3 2015. Based on
management’s best estimate.
$2.41
$3.07
$3.38
$2.47
$0.71
$1.80
$4.872
$3.03 $3.16
$4.28
$4.46
22% CAGR
© 2015 Belden Inc. | belden.com | @BeldenInc 11
The Cost of Capital Has Decreased
Belden’s cost of capital has benefited from a more
balanced capital structure
0.9x
0.7x
3.0x
2.2x
2.6x
3.6x
3.1x12.1% 12.2%
10.7%
9.3%
9.7%
8.8% 8.8%
5.0%
7.0%
9.0%
11.0%
13.0%
0.0x
0.5x
1.0x
1.5x
2.0x
2.5x
3.0x
3.5x
4.0x
2010 2011 2012 2013 2014 2015 2016
Net Leverage Ratio WACC
© 2015 Belden Inc. | belden.com | @BeldenInc 12
4.2x
4.9x 4.9x
4.7x 4.6x
4.2x
4.4x
0.0x
1.0x
2.0x
3.0x
4.0x
5.0x
6.0x
2010 2011 2012 2013 2014 2015 2016
Net Interest Coverage Ratio Has Been Consistent
Incurrence
Covenant
Belden generates more than 2x the required EBITDA
Net Interest Coverage Ratio
© 2015 Belden Inc. | belden.com | @BeldenInc 13
2008 Versus 2015
Market
Broadcast
Enterprise
Industrial
Product
Networking
Connectivity
Cable
2008
Market Product
2015
Divested cable
Acquired software,
networking and
connectivity
Network Security Security
Broadcast
Enterprise
Industrial
Networking
Connectivity
Cable
© 2015 Belden Inc. | belden.com | @BeldenInc 14
Transformation To Drive Continued Margin Expansion
14%
16%
18%
20%
2015 Leverage Mix Productivity Inorganic 2018
140 bps
20 bps
110 bps
20 bps 20.0%
17.1%
© 2015 Belden Inc. | belden.com | @BeldenInc 15
Opportunity Exists to Drive Increased Shareholder Value
4x
8x
12x
16x
EV/EBITDAMultiple
10% 15% 20% 25% 30%5%
EBITDA-Capex Margin
A
B
C
Increased free cash flow margin drives multiple expansion
Legacy Peers
E
C
D
A
B
Best In Class
Peers
F
R2 = 0.9705
2008
Today
© 2015 Belden Inc. | belden.com | @BeldenInc 16
Business Model Goals
THREE YEAR FINANCIAL GOALS
Growth 5 - 7%
EBITDA 18 - 20%
Return on Invested Capital 13 - 15%
Free Cash Flow Exceed Net Income
• Headwinds
− Weak global growth
− Strong US dollar
− Sustained low oil prices
• Tailwinds
− Cybersecurity
− Broadband demand
− Strength in enterprise
Market Growth
1-3%
Share Capture
2%
Inorganic Activity
2%
Total
Growth
5-7%
=+ +
© 2015 Belden Inc. | belden.com | @BeldenInc 17
Continued Focus on Productivity Improvement
Industrial Platform Cost Measures
Industrial Tailwinds
• Internet of Things
• Industrial automation
• Market-leading portfolio
Industrial Headwinds
• Stronger US dollar
• Industrial production
• Continued low oil prices
• Capacity utilization rates
Year
Cash
Investment
Savings
EPS
Impact
2016 $23M $6M $0.11
2017 $15M $17M $0.32
2018 - $22M $0.41
© 2015 Belden Inc. | belden.com | @BeldenInc 18
$2,363 ($68)
$0 - $50 $2,295 - $2,345
$4.85
$0.29
$5.10 - $5.40
$0.08
$0.04
$0.00 - $0.30
Current Outlook 2015
(Mid-Point)
Copper and
Currency
Tax, Interest, Share
Repurchase
Productivity Organic Current Outlook 2016
Revenues and EPS Bridge
Adjusted
Revenue ($M)
Adjusted EPS
© 2015 Belden Inc. | belden.com | @BeldenInc 19
2016 Assumptions
Copper price of $2.05 for 2016 versus $2.50 in 2015
Euro of $1.05 in 2016 vs. $1.11 in 2015
Interest expenses of ~$95 million for 2016
Tax rate of 20% for 2016
$0.29 of favorable impact to EPS from productivity
improvement programs
1: Source: Approximate IMF Crude Oil forecast.
© 2015 Belden Inc. | belden.com | @BeldenInc 20
Outlook
Fiscal Year 2016*
Revenues
of between
$2.295 billion
and $2.345
billion
EPS
of between
$5.10 and $5.40
per diluted share
*Adjusted results. See appendix for reconciliation to comparable GAAP results
Organic Growth of 0 to 2% Growth of 5 to 11%
© 2015 Belden Inc. | belden.com | @BeldenInc 21
GAAP to Non-GAAP Reconciliation
BELDEN INC.
RECONCILIATION OF NON-GAAP MEASURES
2016 REVENUES AND EARNINGS GUIDANCE
Year Ended
December 31, 2016
Adjusted revenues $2.295 - $2.345 billion
Deferred revenue adjustments ($7 million)
GAAP revenues $2.288 - $2.338 billion
Adjusted income from continuing operations per diluted share $5.10 - $5.40
Amortization of intangible assets ($1.70)
Severance, restructuring, and integration costs ($0.61)
Deferred gross profit adjustments ($0.11)
GAAP income from continuing operations per diluted share $2.68 - $2.98
Our guidance for revenues and income from continuing operations per diluted share is based upon the extent of information currently
available regarding events and conditions that will impact our future operating results for 2016. Our actual results are likely to be
impacted by other additional events for which information is not available, such as asset impairments, purchase accounting effects
related to acquisitions, severance and other restructuring costs, gains (losses) recognized on the disposal of tangible assets, gains
(losses) on debt extinguishment, discontinued operations, and other gains (losses) related to events or conditions that are not yet
known.
© 2015 Belden Inc. | belden.com | @BeldenInc 22
Appendix
© 2015 Belden Inc. | belden.com | @BeldenInc 23
Q3 2015 Earnings Release
Conference Call Presentation
© 2015 Belden Inc. | belden.com | @BeldenInc 24
• Generated revenues of $590.1 million;
• Achieved gross profit margins of 40.8%, increasing 320 basis
points from 37.6% in the year-ago period;
• Expanded EBITDA margins to 16.5%, increasing 80 basis points
from 15.7% in the year-ago period;
• Repurchased approximately 698,000 shares of Belden common
stock; and
• Raised the expected range of full-year adjusted income from
continuing operations per diluted share to $4.80 – 4.90.
Q3 2015 Highlights
Adjusted results. See Appendix for reconciliation to comparable GAAP results.
© 2015 Belden Inc. | belden.com | @BeldenInc 25
Revenue $41.4M
EBITDA Margin 27.2%
Revenue $59.2M
EBITDA Margin 17.7%
Revenue $113.8M
EBITDA Margin 16.0%
Revenue $147.7M
EBITDA Margin 15.7%
3rd Quarter Segment Overview
Revenue $228.1M
EBITDA Margin 15.3%
Broadcast
Enterprise
Connectivity
Industrial
Connectivity
Industrial
IT
Network
Security
Camera Mounted
Fiber Solutions
Signal Processing
& Routing
Precision A/V
Cable and Connectivity
Monitoring
Systems
Automation Playout
& Branding
Systems
Industrial and
I/O Connectors
Industrial
Cables
IP/Networking
Cables
I/O Modules/
Active
Distribution
Boxes
Customer-Specific
Wiring
Copper and Fiber
Connectivity
Racks and
Enclosures
Ethernet,
Fiber Optic and Coaxial
Cables, Security
& Routing
Wireless Switches Connectivity
Vulnerability AssessmentTargeted Attack Detection Threat Analytics
Adjusted results. See Appendix for reconciliation to comparable GAAP results.
© 2015 Belden Inc. | belden.com | @BeldenInc 26
Q3 2015 Q2 2015 Q3 2014
Revenue $590.1M $598.5M $613.1M
Gross profit $240.7M $249.5M $230.2M
Gross profit percentage 40.8% 41.7% 37.6%
EBITDA $97.5M $100.1M $96.3M
EBITDA percentage 16.5% 16.7% 15.7%
Income from continuing operations $48.9M $52.2M $50.4M
Income from continuing operations per
diluted share
$1.14 $1.21 $1.15
Q3 2015 Financial Summary
Adjusted results. See Appendix for reconciliation to comparable GAAP results.
© 2015 Belden Inc. | belden.com | @BeldenInc 27
Segment Results
Broadcast
Enterprise
Connectivity
Industrial
Connectivity
Industrial IT
Network
Security
Consolidated
Q3 2015
Revenue $228.1M $113.8M $147.7M $59.2M $41.4M $590.1M
EBITDA(1) $34.9M $18.2M $23.2M $10.5M $11.2M $97.5M
EBITDA Margin 15.3% 16.0% 15.7% 17.7% 27.2% 16.5%
Q2 2015
Revenue $219.4M $117.3M $160.9M $61.3M $39.6M $598.5M
EBITDA(1) $31.6M $21.1M $28.7M $10.2M $8.8M $100.1M
EBITDA Margin 14.4% 18.0% 17.8% 16.6% 22.1% 16.7%
Q3 2014(2)
Revenue $256.6M $115.3M $171.1M $70.1M $613.1M
EBITDA(1) $38.5M $17.7M $26.5M $13.6M $96.3M
EBITDA Margin 15.0% 15.4% 15.5% 19.4% 15.7%
Adjusted results. See Appendix for reconciliation to comparable GAAP results.
(1) Consolidated results include income from our equity method investment.
(2) Consolidated results for these periods exclude the impact of Network Security as Tripwire acquisition was completed in 2015
© 2015 Belden Inc. | belden.com | @BeldenInc 28
Q3 2015 Q2 2015 Q3 2014
Cash and cash equivalents $241.9M $208.4M $449.1M
Inventory turns 6.7x 6.0X 7.0 x
Days sales outstanding 63 days 64 days 62 days
PP&E turns 7.4x 7.3x 7.6x
Total debt principal amount $1.91B $1.92B $1.54B
Balance Sheet Highlights
© 2015 Belden Inc. | belden.com | @BeldenInc 29
Cash Flow Highlights
(1) Adjusted for cash payment of $9.0M in Q3 2014 related to the integration of Grass Valley. See Appendix for reconciliation to comparable GAAP results.
(2) Capital expenditures, net of proceeds from the disposal of tangible assets. See Appendix for reconciliation.
(3) Free cash flow is not a term defined by generally accepted accounting principles (GAAP) and our definition may or may not be used consistently with other companies that define this term. See Appendix
for reconciliation to comparable GAAP results.
(4) Net of cash acquired.
Q3 2015 Q2 2015 Q3 2014
Cash flows from operating activities $ 86.9M $ 53.3M $ 63.2M(1)
Less: Net capital expenditures(2) $ 11.8M $ 11.7M $ 8.3M
Free cash flow (3) $ 75.1M $ 41.6M $ 54.9M
Cash used to acquire businesses(4) $ 0.0M $ 0.0M $ 1.6M
Share repurchases and dividends $ 41.2M $ 2.1M $ 33.2M
© 2015 Belden Inc. | belden.com | @BeldenInc
2015 Broadcast
Market
Conditions
© 2015 Belden Inc. | belden.com | @BeldenInc 31
Broadcast Platform
Broadcast Platform
Broadcast Cable
Broadband Connectivity
Broadcast IT
42%
40%
18%
15%
35%
50%
20%
20%
16%
8%
10%
6%
21%
Routers and
Interfaces
Digital Media &
Workflow
(i.e. Content manager,
graphics, branding)
Monitoring &
Control
Editing
Systems
Software & Services
Grass Valley
Content Creation
68%
Playout
32%
Switchers, Cameras, Editing,
DM&W, Routers & Interfaces,
S&S
Monitoring & Control,
Routers & Interfaces,
S&S, DM&W
© 2015 Belden Inc. | belden.com | @BeldenInc 32
Changes Within the Grass Valley Market
Combined, these dynamics have created a perfect storm in 2015
Decreasing U.S.
Advertising
Spend Impacts
Capex
Decisions
Increased
Digital/OTT
Viewing
Impacts Capex
Decisions
Macro-
Economic
Headwinds
Impacting
International
Demand
© 2015 Belden Inc. | belden.com | @BeldenInc 33
Restructured the
business for regional
outlook
$30M of annual savings
Macro-Economic Headwinds Impact International Demand
What is happening? What does this mean for
Grass Valley?
International Revenues
• Stronger USD reducing
purchasing power
• Govt-sponsored broadcasters
impacted by austerity
measures and oil prices
~60%
of Grass Valley
(20%)
Upgrade cycle is elongated
Long-
Term
Short-
Term
USD/EUR Oil Prices
© 2015 Belden Inc. | belden.com | @BeldenInc 34
Live
48%
News
20%
Playout
32%
Decreased U.S. Advertising Spend Impacts Capex Decisions
What is happening? What does this mean for
Grass Valley?
68% of product portfolio to
Live Environment
Content creation
continues in high demandLong-
Term
Short-
Term
Live
48%
News
20%
Playout
32%
National TV
Advertising Growth1
1. Standard Media Index
© 2015 Belden Inc. | belden.com | @BeldenInc 35
Increased Digital/OTT Viewing Impacts Capex Decisions
What is happening? What does this mean for
Grass Valley?
30%
43%
49%
58%
61%
64%
10%
30%
50%
70%
2009 2010 2011 2012 2013 2014E
Percent of Video
Over Internet1
Organic investment in Digital
Media applications
Content creation continues
in high demandLong-
Term
Short-
Term
Live
48%
News
20%
Playout
32%
Investment shifted to OTT platforms by
current GV customers
1. Sandvine Global Internet Phenomena Report
Live
48%
News
20%
Playout
32%
© 2015 Belden Inc. | belden.com | @BeldenInc 36
However, OTT Consumption Requires Faster
Internet Speeds
Online Mr
10 a.m.
2 p.m.
6 p.m.
10 p.m.
2 a.m.
Streaming
64%
Current Home Infrastructure
We provide unique, patented solutions for in-home connectivity. As consumption
increases, the home and distribution network will need upgrades.
Average Broadband
Speed is 16 Mbps
48 Mbps Average Fixed
Broadband speed by 2018
Belden
Entry
Not
Belden

2015 investor deck december v1

  • 1.
    © 2015 BeldenInc. | belden.com | @BeldenInc December 2015 Belden Leading the Way to an Interconnected World
  • 2.
    © 2015 BeldenInc. | belden.com | @BeldenInc 2 Leading The Way to an Interconnected World Delivering highly-engineered signal transmission solutions for mission-critical applications in a diverse set of global markets Business Platforms Applications Vertical Markets Data Sound Video Industrial Enterprise Broadcast
  • 3.
    © 2015 BeldenInc. | belden.com | @BeldenInc 3 Five Business Platforms Delivering Innovative Connectivity Solutions Broadcast Enterprise Industrial Connectivity Industrial IT Solutions Network Security • Industrial and I/O Connectors • Industrial Cable • Distribution Boxes • Customized Connectivity Solutions • Ethernet Switches • Wireless Systems • Routers and Gateways • Security Devices • Network Management Software • Copper and Fiber Connectivity • Racks and Enclosures • Ethernet, Fiber Optic and Coaxial Cabling • Custom Infrastructure Solutions • Routers and Interfaces • Broadcast Connectors • Broadband Connectivity • Multi-Viewers and Monitoring and Control Systems • Playout Systems • Vulnerability Assessment • Security Configuration Management • Log Intelligence • Analytics and Reporting
  • 4.
    © 2015 BeldenInc. | belden.com | @BeldenInc 4 A Global Signal Transmission Solutions Company Broadcast Enterprise Connectivity Industrial Connectivity Industrial IT Network Security Market Size1 $4.9B $3.3B $4.0B $1.3B $4.3B 3-Year Market Growth Rate 1-3% 1-3% 0-2% 1-3% 10-12% Market Share1 19% 14% 16% 20% 4% TTM Revenue2 $914.3M $446.6M $635.3M $257.5M $165.0M TTM EBITDA Margin3 15.2% 15.2% 16.1% 18.5% 25.3% Key Markets • Broadband • Broadcast Studios • Mobile Production • Finance • Healthcare • Commercial Buildings • Discrete • Process • Energy • Transportation • Finance • Energy • Retail • Government • Industrial 1. Served addressable market. 2. Based on 12 trailing months. Network Security figures are expected 2015 results. 3. See appendix for additional operating segment information.
  • 5.
    © 2015 BeldenInc. | belden.com | @BeldenInc 5 Financial Performance Revenues (M) EBITDA Margin1 Return on Invested Capital2 Free Cash Flow4 2005 $1,246 8.5% 4.1% $37M 2015E3 $2,363 17.1% 11.7% ~$180M Variance 6.6% CAGR Improvement of 860 bps Average of 13.1% 17.1% CAGR Driving best-in-class shareholder value 1. Non-GAAP results. See appendix for reconciliation to comparable GAAP results. 2. Excluding excess cash, Average of 2012-2015. 3. Based on midpoint of guidance. 4. See appendix for reconciliation to comparable GAAP results.
  • 6.
    © 2015 BeldenInc. | belden.com | @BeldenInc 6 A Disciplined Capital Deployment Strategy Innovation and Market Expansion Share Repurchase M&A Invest in growth opportunities Repurchase Belden stock at attractive prices Identify product and market opportunities, and acquire with a disciplined approach • Product innovation • Productivity improvement • Capital expenditure • Repurchased 7.4 million shares at $47.43 average • ~16% of outstanding shares • $350M invested since 2011 • $2.8 billion invested since 2007 • >15% Cash ROIC on acquisitions made before 2012 2015 ROIC* = 11.7% Deploy capital to highest ROIC project * ROIC excluding excess cash based on mid-point of guidance
  • 7.
    © 2015 BeldenInc. | belden.com | @BeldenInc 7 Connectivity Peers Cable Peers 10.0% 20.0% 30.0% 40.0% 50.0% 2005 2006 2007 2008 2009 2010 2011 2012 2013 2014 2015 YTD A Common Misperception About Belden “Belden is a Wire and Cable company.” Improvement of 1,870 bps Belden’s Gross Profit Margin Exceeds Connectivity Peers 1. Adjusted results. See appendix for reconciliation to comparable GAAP results.
  • 8.
    © 2015 BeldenInc. | belden.com | @BeldenInc 8 10% 12% 14% 16% 18% 20% 2010 2011 2012 2013 2014 2015 Consistent Margin Progression We have shown the ability to consistently improve margins in a low-growth environment EBITDA Margin Goal: 18 - 20% 11.9% 11.7% 13.0% 15.7% 15.5% EBITDA Margin (%)1 17.1%2 Peer Average 1. Non-GAAP results. See appendix for reconciliation to comparable GAAP results. 2. 2015 based on mid-point of guidance
  • 9.
    © 2015 BeldenInc. | belden.com | @BeldenInc 9 10 Year EPS Growth 0% 5% 10% 15% 20% 25% Peer A S&P 500 Peer B Peer C Peer D Belden Since 2005, Belden has generated upper quartile EPS growth of 22%
  • 10.
    © 2015 BeldenInc. | belden.com | @BeldenInc 10 High Quality Earnings: Free Cash Flow Generation Delivering 22% CAGR in free cash flow per share 0 1 2 3 4 5 6 2005 2006 2007 2008 2009 2010 2011 2012 2013 2014 2015 FCF per Share1 1. Non-GAAP results. See appendix for reconciliation to comparable GAAP results 2. Excludes the cash payments for the Broadcast restructuring program that began in Q3 2015. Based on management’s best estimate. $2.41 $3.07 $3.38 $2.47 $0.71 $1.80 $4.872 $3.03 $3.16 $4.28 $4.46 22% CAGR
  • 11.
    © 2015 BeldenInc. | belden.com | @BeldenInc 11 The Cost of Capital Has Decreased Belden’s cost of capital has benefited from a more balanced capital structure 0.9x 0.7x 3.0x 2.2x 2.6x 3.6x 3.1x12.1% 12.2% 10.7% 9.3% 9.7% 8.8% 8.8% 5.0% 7.0% 9.0% 11.0% 13.0% 0.0x 0.5x 1.0x 1.5x 2.0x 2.5x 3.0x 3.5x 4.0x 2010 2011 2012 2013 2014 2015 2016 Net Leverage Ratio WACC
  • 12.
    © 2015 BeldenInc. | belden.com | @BeldenInc 12 4.2x 4.9x 4.9x 4.7x 4.6x 4.2x 4.4x 0.0x 1.0x 2.0x 3.0x 4.0x 5.0x 6.0x 2010 2011 2012 2013 2014 2015 2016 Net Interest Coverage Ratio Has Been Consistent Incurrence Covenant Belden generates more than 2x the required EBITDA Net Interest Coverage Ratio
  • 13.
    © 2015 BeldenInc. | belden.com | @BeldenInc 13 2008 Versus 2015 Market Broadcast Enterprise Industrial Product Networking Connectivity Cable 2008 Market Product 2015 Divested cable Acquired software, networking and connectivity Network Security Security Broadcast Enterprise Industrial Networking Connectivity Cable
  • 14.
    © 2015 BeldenInc. | belden.com | @BeldenInc 14 Transformation To Drive Continued Margin Expansion 14% 16% 18% 20% 2015 Leverage Mix Productivity Inorganic 2018 140 bps 20 bps 110 bps 20 bps 20.0% 17.1%
  • 15.
    © 2015 BeldenInc. | belden.com | @BeldenInc 15 Opportunity Exists to Drive Increased Shareholder Value 4x 8x 12x 16x EV/EBITDAMultiple 10% 15% 20% 25% 30%5% EBITDA-Capex Margin A B C Increased free cash flow margin drives multiple expansion Legacy Peers E C D A B Best In Class Peers F R2 = 0.9705 2008 Today
  • 16.
    © 2015 BeldenInc. | belden.com | @BeldenInc 16 Business Model Goals THREE YEAR FINANCIAL GOALS Growth 5 - 7% EBITDA 18 - 20% Return on Invested Capital 13 - 15% Free Cash Flow Exceed Net Income • Headwinds − Weak global growth − Strong US dollar − Sustained low oil prices • Tailwinds − Cybersecurity − Broadband demand − Strength in enterprise Market Growth 1-3% Share Capture 2% Inorganic Activity 2% Total Growth 5-7% =+ +
  • 17.
    © 2015 BeldenInc. | belden.com | @BeldenInc 17 Continued Focus on Productivity Improvement Industrial Platform Cost Measures Industrial Tailwinds • Internet of Things • Industrial automation • Market-leading portfolio Industrial Headwinds • Stronger US dollar • Industrial production • Continued low oil prices • Capacity utilization rates Year Cash Investment Savings EPS Impact 2016 $23M $6M $0.11 2017 $15M $17M $0.32 2018 - $22M $0.41
  • 18.
    © 2015 BeldenInc. | belden.com | @BeldenInc 18 $2,363 ($68) $0 - $50 $2,295 - $2,345 $4.85 $0.29 $5.10 - $5.40 $0.08 $0.04 $0.00 - $0.30 Current Outlook 2015 (Mid-Point) Copper and Currency Tax, Interest, Share Repurchase Productivity Organic Current Outlook 2016 Revenues and EPS Bridge Adjusted Revenue ($M) Adjusted EPS
  • 19.
    © 2015 BeldenInc. | belden.com | @BeldenInc 19 2016 Assumptions Copper price of $2.05 for 2016 versus $2.50 in 2015 Euro of $1.05 in 2016 vs. $1.11 in 2015 Interest expenses of ~$95 million for 2016 Tax rate of 20% for 2016 $0.29 of favorable impact to EPS from productivity improvement programs 1: Source: Approximate IMF Crude Oil forecast.
  • 20.
    © 2015 BeldenInc. | belden.com | @BeldenInc 20 Outlook Fiscal Year 2016* Revenues of between $2.295 billion and $2.345 billion EPS of between $5.10 and $5.40 per diluted share *Adjusted results. See appendix for reconciliation to comparable GAAP results Organic Growth of 0 to 2% Growth of 5 to 11%
  • 21.
    © 2015 BeldenInc. | belden.com | @BeldenInc 21 GAAP to Non-GAAP Reconciliation BELDEN INC. RECONCILIATION OF NON-GAAP MEASURES 2016 REVENUES AND EARNINGS GUIDANCE Year Ended December 31, 2016 Adjusted revenues $2.295 - $2.345 billion Deferred revenue adjustments ($7 million) GAAP revenues $2.288 - $2.338 billion Adjusted income from continuing operations per diluted share $5.10 - $5.40 Amortization of intangible assets ($1.70) Severance, restructuring, and integration costs ($0.61) Deferred gross profit adjustments ($0.11) GAAP income from continuing operations per diluted share $2.68 - $2.98 Our guidance for revenues and income from continuing operations per diluted share is based upon the extent of information currently available regarding events and conditions that will impact our future operating results for 2016. Our actual results are likely to be impacted by other additional events for which information is not available, such as asset impairments, purchase accounting effects related to acquisitions, severance and other restructuring costs, gains (losses) recognized on the disposal of tangible assets, gains (losses) on debt extinguishment, discontinued operations, and other gains (losses) related to events or conditions that are not yet known.
  • 22.
    © 2015 BeldenInc. | belden.com | @BeldenInc 22 Appendix
  • 23.
    © 2015 BeldenInc. | belden.com | @BeldenInc 23 Q3 2015 Earnings Release Conference Call Presentation
  • 24.
    © 2015 BeldenInc. | belden.com | @BeldenInc 24 • Generated revenues of $590.1 million; • Achieved gross profit margins of 40.8%, increasing 320 basis points from 37.6% in the year-ago period; • Expanded EBITDA margins to 16.5%, increasing 80 basis points from 15.7% in the year-ago period; • Repurchased approximately 698,000 shares of Belden common stock; and • Raised the expected range of full-year adjusted income from continuing operations per diluted share to $4.80 – 4.90. Q3 2015 Highlights Adjusted results. See Appendix for reconciliation to comparable GAAP results.
  • 25.
    © 2015 BeldenInc. | belden.com | @BeldenInc 25 Revenue $41.4M EBITDA Margin 27.2% Revenue $59.2M EBITDA Margin 17.7% Revenue $113.8M EBITDA Margin 16.0% Revenue $147.7M EBITDA Margin 15.7% 3rd Quarter Segment Overview Revenue $228.1M EBITDA Margin 15.3% Broadcast Enterprise Connectivity Industrial Connectivity Industrial IT Network Security Camera Mounted Fiber Solutions Signal Processing & Routing Precision A/V Cable and Connectivity Monitoring Systems Automation Playout & Branding Systems Industrial and I/O Connectors Industrial Cables IP/Networking Cables I/O Modules/ Active Distribution Boxes Customer-Specific Wiring Copper and Fiber Connectivity Racks and Enclosures Ethernet, Fiber Optic and Coaxial Cables, Security & Routing Wireless Switches Connectivity Vulnerability AssessmentTargeted Attack Detection Threat Analytics Adjusted results. See Appendix for reconciliation to comparable GAAP results.
  • 26.
    © 2015 BeldenInc. | belden.com | @BeldenInc 26 Q3 2015 Q2 2015 Q3 2014 Revenue $590.1M $598.5M $613.1M Gross profit $240.7M $249.5M $230.2M Gross profit percentage 40.8% 41.7% 37.6% EBITDA $97.5M $100.1M $96.3M EBITDA percentage 16.5% 16.7% 15.7% Income from continuing operations $48.9M $52.2M $50.4M Income from continuing operations per diluted share $1.14 $1.21 $1.15 Q3 2015 Financial Summary Adjusted results. See Appendix for reconciliation to comparable GAAP results.
  • 27.
    © 2015 BeldenInc. | belden.com | @BeldenInc 27 Segment Results Broadcast Enterprise Connectivity Industrial Connectivity Industrial IT Network Security Consolidated Q3 2015 Revenue $228.1M $113.8M $147.7M $59.2M $41.4M $590.1M EBITDA(1) $34.9M $18.2M $23.2M $10.5M $11.2M $97.5M EBITDA Margin 15.3% 16.0% 15.7% 17.7% 27.2% 16.5% Q2 2015 Revenue $219.4M $117.3M $160.9M $61.3M $39.6M $598.5M EBITDA(1) $31.6M $21.1M $28.7M $10.2M $8.8M $100.1M EBITDA Margin 14.4% 18.0% 17.8% 16.6% 22.1% 16.7% Q3 2014(2) Revenue $256.6M $115.3M $171.1M $70.1M $613.1M EBITDA(1) $38.5M $17.7M $26.5M $13.6M $96.3M EBITDA Margin 15.0% 15.4% 15.5% 19.4% 15.7% Adjusted results. See Appendix for reconciliation to comparable GAAP results. (1) Consolidated results include income from our equity method investment. (2) Consolidated results for these periods exclude the impact of Network Security as Tripwire acquisition was completed in 2015
  • 28.
    © 2015 BeldenInc. | belden.com | @BeldenInc 28 Q3 2015 Q2 2015 Q3 2014 Cash and cash equivalents $241.9M $208.4M $449.1M Inventory turns 6.7x 6.0X 7.0 x Days sales outstanding 63 days 64 days 62 days PP&E turns 7.4x 7.3x 7.6x Total debt principal amount $1.91B $1.92B $1.54B Balance Sheet Highlights
  • 29.
    © 2015 BeldenInc. | belden.com | @BeldenInc 29 Cash Flow Highlights (1) Adjusted for cash payment of $9.0M in Q3 2014 related to the integration of Grass Valley. See Appendix for reconciliation to comparable GAAP results. (2) Capital expenditures, net of proceeds from the disposal of tangible assets. See Appendix for reconciliation. (3) Free cash flow is not a term defined by generally accepted accounting principles (GAAP) and our definition may or may not be used consistently with other companies that define this term. See Appendix for reconciliation to comparable GAAP results. (4) Net of cash acquired. Q3 2015 Q2 2015 Q3 2014 Cash flows from operating activities $ 86.9M $ 53.3M $ 63.2M(1) Less: Net capital expenditures(2) $ 11.8M $ 11.7M $ 8.3M Free cash flow (3) $ 75.1M $ 41.6M $ 54.9M Cash used to acquire businesses(4) $ 0.0M $ 0.0M $ 1.6M Share repurchases and dividends $ 41.2M $ 2.1M $ 33.2M
  • 30.
    © 2015 BeldenInc. | belden.com | @BeldenInc 2015 Broadcast Market Conditions
  • 31.
    © 2015 BeldenInc. | belden.com | @BeldenInc 31 Broadcast Platform Broadcast Platform Broadcast Cable Broadband Connectivity Broadcast IT 42% 40% 18% 15% 35% 50% 20% 20% 16% 8% 10% 6% 21% Routers and Interfaces Digital Media & Workflow (i.e. Content manager, graphics, branding) Monitoring & Control Editing Systems Software & Services Grass Valley Content Creation 68% Playout 32% Switchers, Cameras, Editing, DM&W, Routers & Interfaces, S&S Monitoring & Control, Routers & Interfaces, S&S, DM&W
  • 32.
    © 2015 BeldenInc. | belden.com | @BeldenInc 32 Changes Within the Grass Valley Market Combined, these dynamics have created a perfect storm in 2015 Decreasing U.S. Advertising Spend Impacts Capex Decisions Increased Digital/OTT Viewing Impacts Capex Decisions Macro- Economic Headwinds Impacting International Demand
  • 33.
    © 2015 BeldenInc. | belden.com | @BeldenInc 33 Restructured the business for regional outlook $30M of annual savings Macro-Economic Headwinds Impact International Demand What is happening? What does this mean for Grass Valley? International Revenues • Stronger USD reducing purchasing power • Govt-sponsored broadcasters impacted by austerity measures and oil prices ~60% of Grass Valley (20%) Upgrade cycle is elongated Long- Term Short- Term USD/EUR Oil Prices
  • 34.
    © 2015 BeldenInc. | belden.com | @BeldenInc 34 Live 48% News 20% Playout 32% Decreased U.S. Advertising Spend Impacts Capex Decisions What is happening? What does this mean for Grass Valley? 68% of product portfolio to Live Environment Content creation continues in high demandLong- Term Short- Term Live 48% News 20% Playout 32% National TV Advertising Growth1 1. Standard Media Index
  • 35.
    © 2015 BeldenInc. | belden.com | @BeldenInc 35 Increased Digital/OTT Viewing Impacts Capex Decisions What is happening? What does this mean for Grass Valley? 30% 43% 49% 58% 61% 64% 10% 30% 50% 70% 2009 2010 2011 2012 2013 2014E Percent of Video Over Internet1 Organic investment in Digital Media applications Content creation continues in high demandLong- Term Short- Term Live 48% News 20% Playout 32% Investment shifted to OTT platforms by current GV customers 1. Sandvine Global Internet Phenomena Report Live 48% News 20% Playout 32%
  • 36.
    © 2015 BeldenInc. | belden.com | @BeldenInc 36 However, OTT Consumption Requires Faster Internet Speeds Online Mr 10 a.m. 2 p.m. 6 p.m. 10 p.m. 2 a.m. Streaming 64% Current Home Infrastructure We provide unique, patented solutions for in-home connectivity. As consumption increases, the home and distribution network will need upgrades. Average Broadband Speed is 16 Mbps 48 Mbps Average Fixed Broadband speed by 2018 Belden Entry Not Belden

Editor's Notes

  • #31 Can you really deploy your capital given your served markets? - prepared to move out of our served markets - introduce the idea within John’s presentation (business system is effective outside of our current markets – not isolated to signal transmission) - take that starting point and expand beyond (complexity of markets, channels, high mix/ low volume) - Gap between PAM and SAM isn’t all that attractive - Gap between PAM and TAM Growth story Add value prop at end Organic growth is still a priority (slide within John’s – specific to each platform) Transition to IP within Broadcast (why we do a good job) This is our 3rd time doing it - pull together a video or whitepaper - put together a counsel Demistifying a few things - Geographic mix, Copper price, currency, selling directly to a customer
  • #34 Moreover, you can be confident that the solutions that our customers will require tomorrow are on the Grass Valley roadmaps today. The scale and stability that Belden provides allows Grass Valley to continuously invest R&D monies. That investment creates differentiated solutions that increase the value you can offer to your customers.