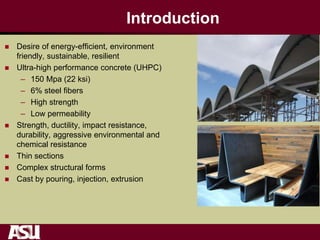
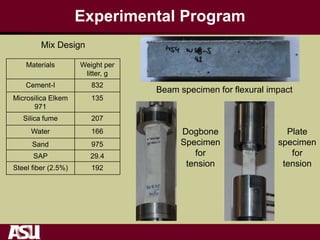
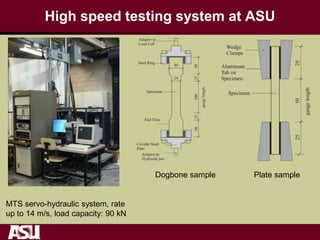
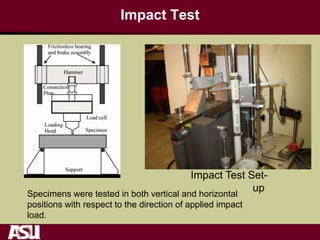
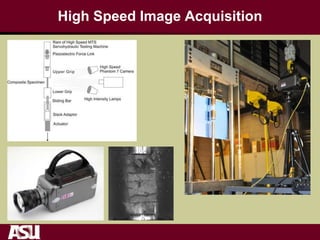
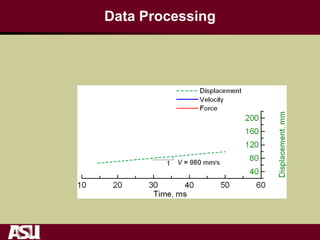
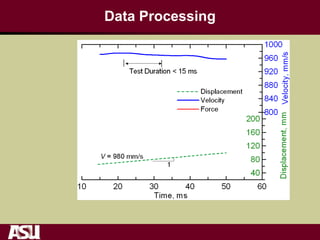
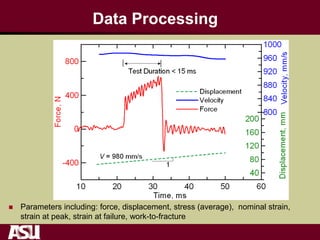
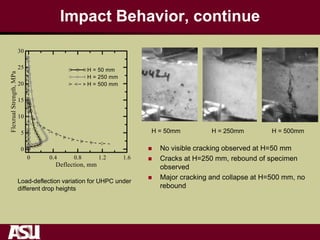
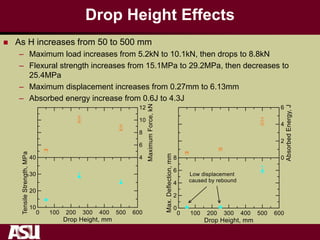
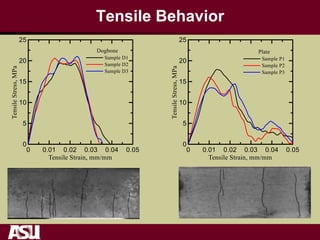
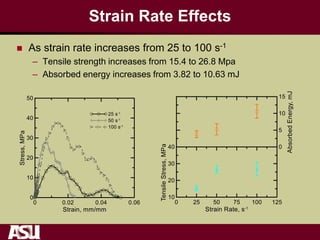
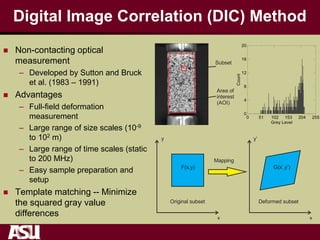
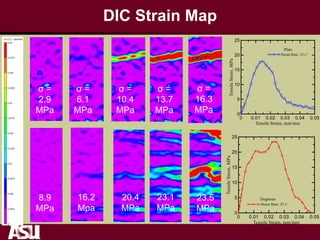
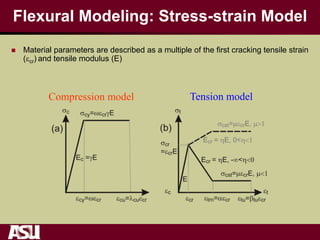
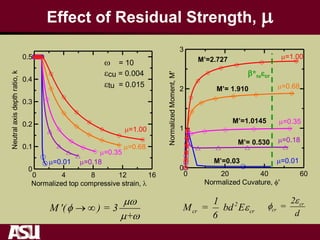
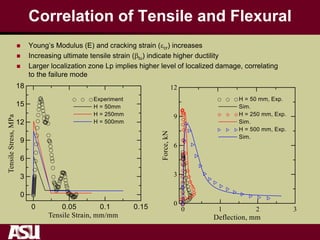
Tensile and Flexural Behavior of UHPC under High-
Speed Tensile and Impact Loads
Barzin Mobasher, Yiming Yao, Flavio A. Silva, Vikram Dey
School of Sustainable Engineering and the Built Environment
Ira A. Fulton Schools of Engineering
Arizona State University
Tempe, AZ 85287-5306
ACI Fall Convention, October, 2014, Washington DC
UHPC Behavior under Blast and Impact Load Effects
Outline
 Introduction
 Testing Methodology and Data Processing
 Flexural Impact Behavior
 Tensile Behavior
 Digital Image Correlation (DIC) Method
 Analytical Modelling of Flexural Response
 Summary
Introduction
 Desire of energy-efficient, environment
friendly, sustainable, resilient
 Ultra-high performance concrete (UHPC)
– 150 Mpa (22 ksi)
– 6% steel fibers
– High strength
– Low permeability
 Strength, ductility, impact resistance,
durability, aggressive environmental and
chemical resistance
 Thin sections
 Complex structural forms
 Cast by pouring, injection, extrusion
Impact, Blast, Dynamic Events
 Cases for dynamic loading:
– blast explosions
– projectiles
– earthquakes
– fast moving traffic
– wind gusts, wind driven objects,
– machine vibrations.
 Inherent brittleness and low tensile
strength, dynamic loading can cause
severe damage.
 Mechanical properties at high strain
rates for analysis of structural
components.
Experimental Program
Materials Weight per
litter, g
Cement-I 832
Microsilica Elkem
971
135
Silica fume 207
Water 166
Sand 975
SAP 29.4
Steel fiber (2.5%) 192
Mix Design
Beam specimen for flexural impact
Dogbone
Specimen
for
tension
Plate
specimen
for
tension
High speed testing system at ASU
MTS servo-hydraulic system, rate
up to 14 m/s, load capacity: 90 kN
Dogbone sample Plate sample
Impact Test
Impact Test Set-
up
Specimens were tested in both vertical and horizontal
positions with respect to the direction of applied impact
load.
High Speed Image Acquisition
Data Processing
Data Processing
Data Processing
 Parameters including: force, displacement, stress (average), nominal strain,
strain at peak, strain at failure, work-to-fracture
Frequency Analysis and Low-pass filter
Design
100 1000 10000
Frequency (Hz)
0
0.005
0.01
0.015
0.02
0.025
FourierAmplitude(g-s)
Hammer
Raw Signal
Filtered Signal
Modal analysis tests were conducted to identify the predominant
frequencies of the hammer and the test specimens. The predominant
frequency of the hammer is about 5 kHz
0.05 0.052 0.054 0.056 0.058 0.06
Time, sec
-400
-200
0
200
400
600
Acceleration,g
Acceleration of Specimen
h = 50.8 mm
Vertical Direction
Raw Data
Filtered Data
Impact Behavior
0 0.02 0.04 0.06 0.08
Time, sec
-400
0
400
800
Acceleration,g
Acceleration of ARG6B
h = 50 mm
h = 200 mm
h = 250 mm
Acceleration and Impact force for UHPC specimens at different drop heights
Impact Behavior, continue
Load-deflection variation for UHPC under
different drop heights
H = 50mm H = 250mm H = 500mm
 No visible cracking observed at H=50 mm
 Cracks at H=250 mm, rebound of specimen
observed
 Major cracking and collapse at H=500 mm, no
rebound
Drop Height Effects
 As H increases from 50 to 500 mm
– Maximum load increases from 5.2kN to 10.1kN, then drops to 8.8kN
– Flexural strength increases from 15.1MPa to 29.2MPa, then decreases to
25.4MPa
– Maximum displacement increases from 0.27mm to 6.13mm
– Absorbed energy increase from 0.6J to 4.3J
Tensile Behavior
Strain Rate Effects
 As strain rate increases from 25 to 100 s-1
– Tensile strength increases from 15.4 to 26.8 Mpa
– Absorbed energy increases from 3.82 to 10.63 mJ
Digital Image Correlation (DIC) Method
 Non-contacting optical
measurement
– Developed by Sutton and Bruck
et al. (1983 – 1991)
 Advantages
– Full-field deformation
measurement
– Large range of size scales (10-9
to 102 m)
– Large range of time scales (static
to 200 MHz)
– Easy sample preparation and
setup
 Template matching -- Minimize
the squared gray value
differences
Subset
Area of
interest
(AOI)
Original subset Deformed subset
F(x,y) G(x’,y’)
x
y
x’
y’
Mapping
DIC Strain Map
σ =
2.9
MPa
σ =
6.1
MPa
σ =
10.4
MPa
σ =
13.7
MPa
σ =
16.3
MPa
8.9
MPa
16.2
Mpa
20.4
MPa
23.1
MPa
23.5
MPa
Crack Width Measurement
-0.14
-0.253
-0.37
-0.49
-0.60
-0.72
-0.83
-0.95
-1.07
V (mm)
5.0
4.4
3.8
3.1
2.5
1.9
1.3
0.6
0.0
yy (%)
Flexural Modeling: Stress-strain Model
Tension modelCompression model
 Material parameters are described as a multiple of the first cracking tensile strain
(cr) and tensile modulus (E)
Stress and Strain Distribution
0 < β < 1 and λ < ω 1 < β < α and λ < ω
α < β < βtu and λ < ω
Moment-Curvature Diagram
M
f
f
c
0 < t < tu
k
d
C2
T1
T2
T3
C1
stressstrain Moment curvature
diagram
 Incrementally impose 0 < t < tu
 Strain Distribution
 Stress Distribution
 SF = 0, determine k (Neutral axis)
 M = SCiyci+ STiyti and f=c/kd
 Normalization M’=M/M0 and f’=f/fcr
 1 10
kd
c cF b f y dy 
 1 10
1
kd
c c
c
b
y f y ydy
F
 
Localization Rules
Moment
Curvature
M0
Mmax
Mfail
fj,Mj)
fj-1,Mj-1)
Loading
Unloading
Non-Localized
Zone
Localized
Zone
S S/2
cS
P Localized
Zone
Non-Localized
Zone
Axis of
Symmetry
1
1
( )j j
j j
M M
EI
f f 



 
• Flexural specimen is loaded beyond the peak strength;
• Distinct zones develop as the deformation localizes in the
cracking region an average response over the crack spacing
region ;
• Results are used as a smeared crack in conjunction with the
moment–curvature diagram
• Measurement from DIC
Effect of Residual Strength, m
0 4 8 12 16
Normalized top compressive strain, 
0
0.1
0.2
0.3
0.4
0.5
Neutralaxisdepthratio,k
m=0.01
m=0.35
m=0.68
m=1.00
m=0.18
 = 10
cu = 0.004
tu = 0.015
0 20 40 60
Normalized Cuvature, f'
0
1
2
3
NormalizedMoment,M'
m=0.01
m=0.35
m=0.68
m=1.00
m=0.18
cr
cr
2
=
d

f2
cr cr
1
M = bd E
6
M '( ) = 3
+
m
f
m 
 
M’= 1.910
M’=1.0145
M’= 0.530
M’=2.727
M’=0.03
*tucr
Effect of Localization Zone Size, Lp
• Affects the general softening behavior in the post
peak zone
• The simulated residual load capacity is not
sensitive
• Model parameters:
• b=40mm, h=40mm, L=125mm
• E=45GPa, cr=280m, a90, h0.011, m0.021,
tu300, g0.95, 8.33, cu27
~5mm
Localization
Shear
lagUniform
Simulation of Experiment Results
• Other model
parameters:
• g0.95, 8.33,
cu27
Drop height
(mm)
E (Gpa) cr (m) m h a tu Lp (mm)
50 35 180 0.11 -0.010 90 280 5
250 45 270 0.02 -0.011 90 300 5
500 42 250 0.06 -0.010 95 500 20
Correlation of Tensile and Flexural
 Young’s Modulus (E) and cracking strain (cr) increases
 Increasing ultimate tensile strain (tu) indicate higher ductility
 Larger localization zone Lp implies higher level of localized damage, correlating
to the failure mode
Summary
 High speed tensile and flexural impact test procedures for UHPC were
developed
 Tensile strength over 20 MPa was obtained and the flexural strength
exceeded 25 MPa
 Crack and failure behaviours were characterized by means of high
speed images
 Digital image correlation (DIC) method was used to determine the
inhomogeneous displacement/strain fields
 An optical method of crack width measurement using DIC is proposed
 Bilinear parametric model was able to predict the flexural impact
responses
Thank You!

2016 aci milwaukee_wi_2016_v3

  • 1.
    Tensile and FlexuralBehavior of UHPC under High- Speed Tensile and Impact Loads Barzin Mobasher, Yiming Yao, Flavio A. Silva, Vikram Dey School of Sustainable Engineering and the Built Environment Ira A. Fulton Schools of Engineering Arizona State University Tempe, AZ 85287-5306 ACI Fall Convention, October, 2014, Washington DC UHPC Behavior under Blast and Impact Load Effects
  • 2.
    Outline  Introduction  TestingMethodology and Data Processing  Flexural Impact Behavior  Tensile Behavior  Digital Image Correlation (DIC) Method  Analytical Modelling of Flexural Response  Summary
  • 3.
    Introduction  Desire ofenergy-efficient, environment friendly, sustainable, resilient  Ultra-high performance concrete (UHPC) – 150 Mpa (22 ksi) – 6% steel fibers – High strength – Low permeability  Strength, ductility, impact resistance, durability, aggressive environmental and chemical resistance  Thin sections  Complex structural forms  Cast by pouring, injection, extrusion
  • 4.
    Impact, Blast, DynamicEvents  Cases for dynamic loading: – blast explosions – projectiles – earthquakes – fast moving traffic – wind gusts, wind driven objects, – machine vibrations.  Inherent brittleness and low tensile strength, dynamic loading can cause severe damage.  Mechanical properties at high strain rates for analysis of structural components.
  • 5.
    Experimental Program Materials Weightper litter, g Cement-I 832 Microsilica Elkem 971 135 Silica fume 207 Water 166 Sand 975 SAP 29.4 Steel fiber (2.5%) 192 Mix Design Beam specimen for flexural impact Dogbone Specimen for tension Plate specimen for tension
  • 6.
    High speed testingsystem at ASU MTS servo-hydraulic system, rate up to 14 m/s, load capacity: 90 kN Dogbone sample Plate sample
  • 7.
    Impact Test Impact TestSet- up Specimens were tested in both vertical and horizontal positions with respect to the direction of applied impact load.
  • 8.
    High Speed ImageAcquisition
  • 9.
  • 10.
  • 11.
    Data Processing  Parametersincluding: force, displacement, stress (average), nominal strain, strain at peak, strain at failure, work-to-fracture
  • 12.
    Frequency Analysis andLow-pass filter Design 100 1000 10000 Frequency (Hz) 0 0.005 0.01 0.015 0.02 0.025 FourierAmplitude(g-s) Hammer Raw Signal Filtered Signal Modal analysis tests were conducted to identify the predominant frequencies of the hammer and the test specimens. The predominant frequency of the hammer is about 5 kHz 0.05 0.052 0.054 0.056 0.058 0.06 Time, sec -400 -200 0 200 400 600 Acceleration,g Acceleration of Specimen h = 50.8 mm Vertical Direction Raw Data Filtered Data
  • 13.
    Impact Behavior 0 0.020.04 0.06 0.08 Time, sec -400 0 400 800 Acceleration,g Acceleration of ARG6B h = 50 mm h = 200 mm h = 250 mm Acceleration and Impact force for UHPC specimens at different drop heights
  • 14.
    Impact Behavior, continue Load-deflectionvariation for UHPC under different drop heights H = 50mm H = 250mm H = 500mm  No visible cracking observed at H=50 mm  Cracks at H=250 mm, rebound of specimen observed  Major cracking and collapse at H=500 mm, no rebound
  • 15.
    Drop Height Effects As H increases from 50 to 500 mm – Maximum load increases from 5.2kN to 10.1kN, then drops to 8.8kN – Flexural strength increases from 15.1MPa to 29.2MPa, then decreases to 25.4MPa – Maximum displacement increases from 0.27mm to 6.13mm – Absorbed energy increase from 0.6J to 4.3J
  • 16.
  • 17.
    Strain Rate Effects As strain rate increases from 25 to 100 s-1 – Tensile strength increases from 15.4 to 26.8 Mpa – Absorbed energy increases from 3.82 to 10.63 mJ
  • 18.
    Digital Image Correlation(DIC) Method  Non-contacting optical measurement – Developed by Sutton and Bruck et al. (1983 – 1991)  Advantages – Full-field deformation measurement – Large range of size scales (10-9 to 102 m) – Large range of time scales (static to 200 MHz) – Easy sample preparation and setup  Template matching -- Minimize the squared gray value differences Subset Area of interest (AOI) Original subset Deformed subset F(x,y) G(x’,y’) x y x’ y’ Mapping
  • 19.
    DIC Strain Map σ= 2.9 MPa σ = 6.1 MPa σ = 10.4 MPa σ = 13.7 MPa σ = 16.3 MPa 8.9 MPa 16.2 Mpa 20.4 MPa 23.1 MPa 23.5 MPa
  • 20.
  • 21.
    Flexural Modeling: Stress-strainModel Tension modelCompression model  Material parameters are described as a multiple of the first cracking tensile strain (cr) and tensile modulus (E)
  • 22.
    Stress and StrainDistribution 0 < β < 1 and λ < ω 1 < β < α and λ < ω α < β < βtu and λ < ω
  • 23.
    Moment-Curvature Diagram M f f c 0 <t < tu k d C2 T1 T2 T3 C1 stressstrain Moment curvature diagram  Incrementally impose 0 < t < tu  Strain Distribution  Stress Distribution  SF = 0, determine k (Neutral axis)  M = SCiyci+ STiyti and f=c/kd  Normalization M’=M/M0 and f’=f/fcr  1 10 kd c cF b f y dy   1 10 1 kd c c c b y f y ydy F  
  • 24.
    Localization Rules Moment Curvature M0 Mmax Mfail fj,Mj) fj-1,Mj-1) Loading Unloading Non-Localized Zone Localized Zone S S/2 cS PLocalized Zone Non-Localized Zone Axis of Symmetry 1 1 ( )j j j j M M EI f f       • Flexural specimen is loaded beyond the peak strength; • Distinct zones develop as the deformation localizes in the cracking region an average response over the crack spacing region ; • Results are used as a smeared crack in conjunction with the moment–curvature diagram • Measurement from DIC
  • 25.
    Effect of ResidualStrength, m 0 4 8 12 16 Normalized top compressive strain,  0 0.1 0.2 0.3 0.4 0.5 Neutralaxisdepthratio,k m=0.01 m=0.35 m=0.68 m=1.00 m=0.18  = 10 cu = 0.004 tu = 0.015 0 20 40 60 Normalized Cuvature, f' 0 1 2 3 NormalizedMoment,M' m=0.01 m=0.35 m=0.68 m=1.00 m=0.18 cr cr 2 = d  f2 cr cr 1 M = bd E 6 M '( ) = 3 + m f m    M’= 1.910 M’=1.0145 M’= 0.530 M’=2.727 M’=0.03 *tucr
  • 26.
    Effect of LocalizationZone Size, Lp • Affects the general softening behavior in the post peak zone • The simulated residual load capacity is not sensitive • Model parameters: • b=40mm, h=40mm, L=125mm • E=45GPa, cr=280m, a90, h0.011, m0.021, tu300, g0.95, 8.33, cu27 ~5mm Localization Shear lagUniform
  • 27.
    Simulation of ExperimentResults • Other model parameters: • g0.95, 8.33, cu27 Drop height (mm) E (Gpa) cr (m) m h a tu Lp (mm) 50 35 180 0.11 -0.010 90 280 5 250 45 270 0.02 -0.011 90 300 5 500 42 250 0.06 -0.010 95 500 20
  • 28.
    Correlation of Tensileand Flexural  Young’s Modulus (E) and cracking strain (cr) increases  Increasing ultimate tensile strain (tu) indicate higher ductility  Larger localization zone Lp implies higher level of localized damage, correlating to the failure mode
  • 29.
    Summary  High speedtensile and flexural impact test procedures for UHPC were developed  Tensile strength over 20 MPa was obtained and the flexural strength exceeded 25 MPa  Crack and failure behaviours were characterized by means of high speed images  Digital image correlation (DIC) method was used to determine the inhomogeneous displacement/strain fields  An optical method of crack width measurement using DIC is proposed  Bilinear parametric model was able to predict the flexural impact responses
  • 30.