Download to read offline


![36.5%
HB-100-3-0SS
38.5%
HB-100-4-0SS
31.9%
HB-100-5-0SS
27.2%
HB-100-6-0
0
10
20
30
40
50
60
70
0
10
20
30
40
50
60
70
Ductility Ratio (%) = [Ei/(Ei+Ee)]
DuctilityRatio(%)=[Ei/(Ei+Ee)]
DuctilityRatio(%)=[Ei/(Ei+Ee)]
Beams
37
LMT
(Deflection)
Load
Shear
Force
<69%
70%-
74%
>75%
Ductility
Ratio
Brittle
Semi-
Ductile
Ductile
Failure
Mode
Results/Hybrid Beam Shear Test:Results/Hybrid Beam Shear Test:Results/Hybrid Beam Shear Test:Results/Hybrid Beam Shear Test:
Ductility RatioDuctility RatioDuctility RatioDuctility Ratio](https://image.slidesharecdn.com/82c6319d-4cfe-4ef1-85c8-15b37e74ec90-161013021405/85/Print_Reduced-37-320.jpg)


![60.31%
DB-132-3-0ES 56.48%
DB-132-4-0ES
0
20
40
60
80
100
0
20
40
60
80
100
5
DuctilityRatio(%)=[Ei/(Ei+Ee)]
DuctilityRatio(%)=[Ei/(Ei+Ee)]
Beams
48
<69%
70%-
74%
>75%
Ductility
Ratio
Brittle
Semi-
Ductile
Ductile
Failure
Mode
LMT
(Deflection)
Load
Shear
Force
Results/Ductal Beam Shear Test:Results/Ductal Beam Shear Test:Results/Ductal Beam Shear Test:Results/Ductal Beam Shear Test:
Ductility RatioDuctility RatioDuctility RatioDuctility Ratio](https://image.slidesharecdn.com/82c6319d-4cfe-4ef1-85c8-15b37e74ec90-161013021405/85/Print_Reduced-48-320.jpg)


![HB-100-3-0SS
SS-100-3-6*
SC-100-3-6*
HB-100-4-0SS
SS-100-4-6*
SC-100-4-6*
HB-100-5-0SS
SS-100-5-6*
SC-100-5-6*
HB-100-6-0
SS-100-6-6*
SC-100-6-6*
0
10
20
30
40
50
60
70
0
10
20
30
40
50
60
70
Ductility Ratio (%) = [Ei/(Ei+Ee)]
DuctilityRatio(%)=[Ei/(Ei+Ee)]
DuctilityRatio(%)=[Ei/(Ei+Ee)]
Beams
57
LMT
(Deflection)
Load
Shear
Force
LMT
(Deflection)
Load
Shear
Force
<69%
70%-
74%
>75%
Ductility
Ratio
Brittle
Semi-
Ductile
Ductile
Failure
Mode
Comparison BetweenComparison BetweenComparison BetweenComparison Between Hybrid &Hybrid &Hybrid &Hybrid & HSCHSCHSCHSC Beam*Beam*Beam*Beam* TestedTestedTestedTested
inininin Shear: Ductility RatioShear: Ductility RatioShear: Ductility RatioShear: Ductility Ratio](https://image.slidesharecdn.com/82c6319d-4cfe-4ef1-85c8-15b37e74ec90-161013021405/85/Print_Reduced-57-320.jpg)


![66
Comparison Between Ductal & HSC Beam** TestedComparison Between Ductal & HSC Beam** TestedComparison Between Ductal & HSC Beam** TestedComparison Between Ductal & HSC Beam** Tested
in Flexure: Ductility Ratioin Flexure: Ductility Ratioin Flexure: Ductility Ratioin Flexure: Ductility Ratio
58.9%
HSC Beam**
59.3%
Ductal Beam
0
20
40
60
80
100
0
20
40
60
80
100
Ductility Ratio (%) = [Ei/(Ei+Ee)]
DuctilityRatio(%)
DuctilityRatio(%)
Beams
<69%70%-74%>75%
Ductility
Ratio
Brittle
Semi-
Ductile
Ductile
Failure
Mode
Applied Load
Displacement
Ductal or HSC
Beam**](https://image.slidesharecdn.com/82c6319d-4cfe-4ef1-85c8-15b37e74ec90-161013021405/85/Print_Reduced-66-320.jpg)


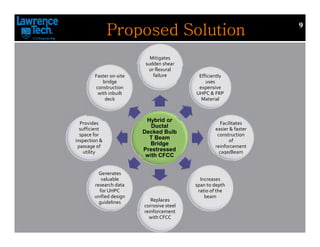
The document summarizes Ranjit Kumar Sharma's thesis defense on the structural behavior of hybrid and ductal decked bulb T beams prestressed with carbon fiber composite cables (CFCC). The experimental program involved shear and flexural testing of hybrid and ductal beams with varying shear span-to-depth ratios. Research findings showed the beams failed in diagonal shear or flexural compression. Crack patterns and load-deflection responses are presented. The research aims to examine shear behavior without stirrups and evaluate design guidelines for hybrid and ductal beams.


![[ Performance-Based Seismic Design ] Inelastic Behavior of Hollow Reinforced...](https://cdn.slidesharecdn.com/ss_thumbnails/research1-180829130530-thumbnail.jpg?width=640&height=640&fit=bounds)


