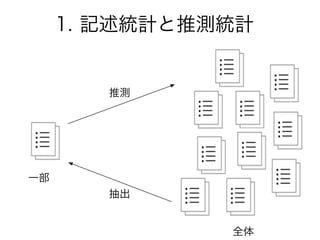
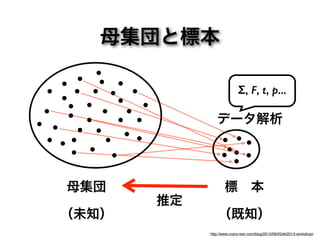
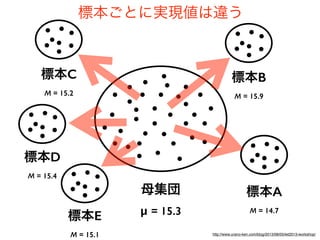
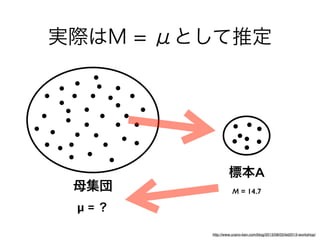
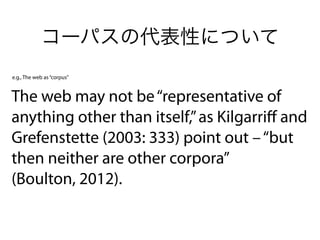
コーパスの代表性について
The web maynot be“representative of
anything other than itself,”as Kilgarriff and
Grefenstette (2003: 333) point out –“but
then neither are other corpora”
(Boulton, 2012).
e.g., The web as“corpus”
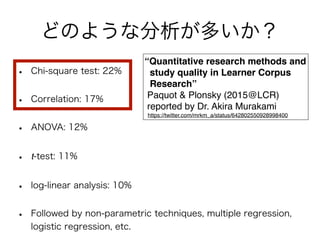
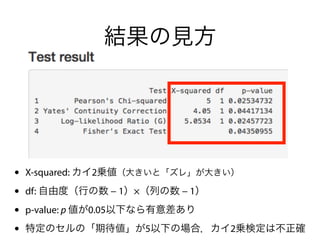
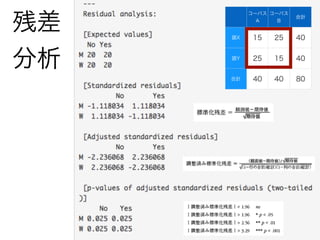
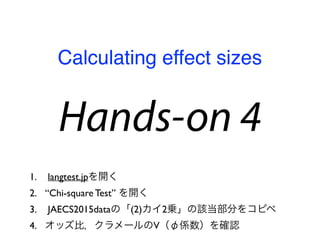
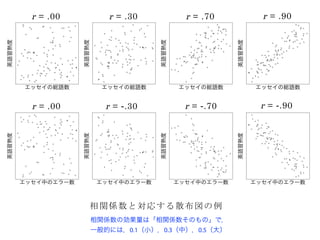
• Chi-square test:22%
• Correlation: 17%
• ANOVA: 12%
• t-test: 11%
• log-linear analysis: 10%
• Followed by non-parametric techniques, multiple regression,
logistic regression, etc.
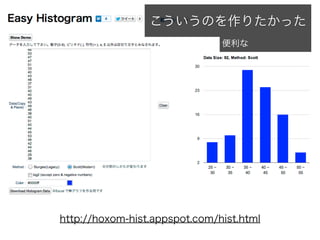
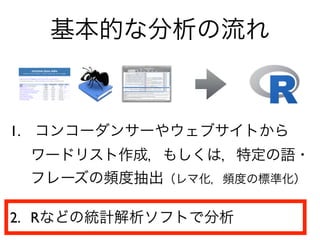
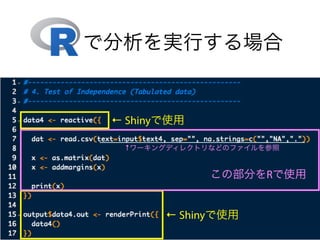
どのような分析が多いか?
“Quantitative research methods and
study quality in Learner Corpus
Research”
Paquot & Plonsky (2015@LCR)
reported by Dr. Akira Murakami
https://twitter.com/mrkm_a/status/642802550928998400
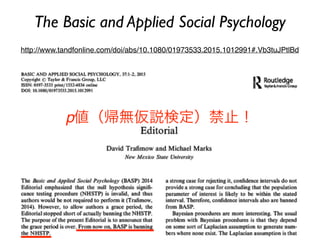
The Basic andApplied Social Psychology
http://www.tandfonline.com/doi/abs/10.1080/01973533.2015.1012991#.Vb3tuJPtlBd
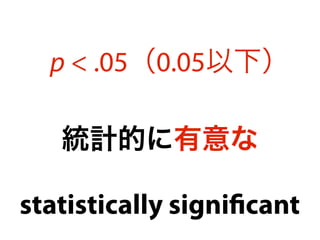
p値(帰無仮説検定)禁止!
72.
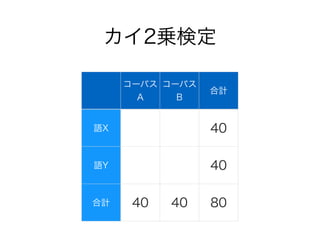
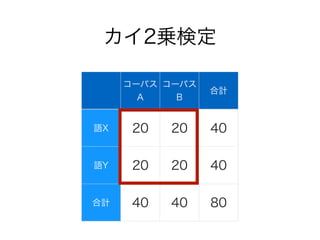
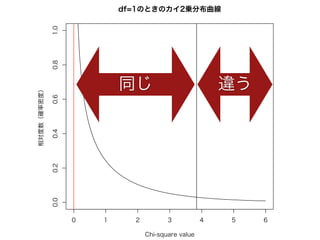
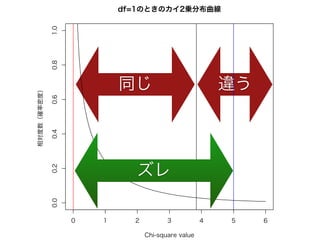
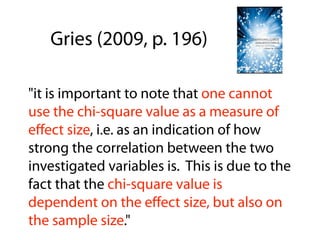
"it is importantto note that one cannot
use the chi-square value as a measure of
effect size, i.e. as an indication of how
strong the correlation between the two
investigated variables is. This is due to the
fact that the chi-square value is
dependent on the effect size, but also on
the sample size."
Gries (2009, p. 196)
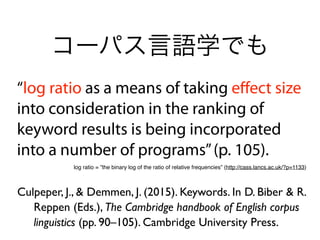
“log ratio asa means of taking effect size
into consideration in the ranking of
keyword results is being incorporated
into a number of programs”(p. 105).
Culpeper, J., & Demmen, J. (2015). Keywords. In D. Biber & R.
Reppen (Eds.), The Cambridge handbook of English corpus
linguistics (pp. 90–105). Cambridge University Press.
コーパス言語学でも
log ratio = ”the binary log of the ratio of relative frequencies” (http://cass.lancs.ac.uk/?p=1133)
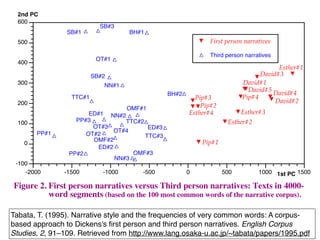
Tabata, T. (1995).Narrative style and the frequencies of very common words: A corpus-
based approach to Dickens's first person and third person narratives. English Corpus
Studies, 2, 91–109. Retrieved from http://www.lang.osaka-u.ac.jp/~tabata/papers/1995.pdf
-100
0
100
200
300
400
500
600
-2000 -1500 -1000 -500 0 500 1000 1500
2nd PC
1st PC
David#1
David#2
David#3
David#4
David#5
Esther#1
Esther#2
Esther#3Esther#4
Pip#1
Pip#2
Pip#3 Pip#4
SB#1
SB#2
SB#3
PP#1
PP#2
PP#3
OT#1
OT#2
OT#3
OT#4
NN#1
NN#2
NN#3
BH#1
BH#2
TTC#1
TTC#2
TTC#3
OMF#1
OMF#2
OMF#3
ED#1
ED#2
ED#3
First person narratives
Third person narratives
Figure 2. First person narratives versus Third person narratives: Texts in 4000-
word segments (based on the 100 most common words of the narrative corpus).
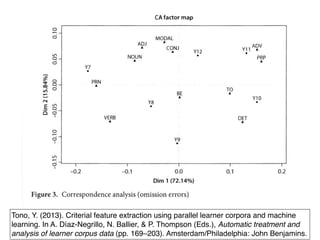
Tono, Y. (2013).Criterial feature extraction using parallel learner corpora and machine
learning. In A. Díaz-Negrillo, N. Ballier, & P. Thompson (Eds.), Automatic treatment and
analysis of learner corpus data (pp. 169–203). Amsterdam/Philadelphia: John Benjamins.
96.
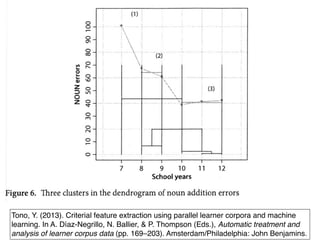
Tono, Y. (2013).Criterial feature extraction using parallel learner corpora and machine
learning. In A. Díaz-Negrillo, N. Ballier, & P. Thompson (Eds.), Automatic treatment and
analysis of learner corpus data (pp. 169–203). Amsterdam/Philadelphia: John Benjamins.
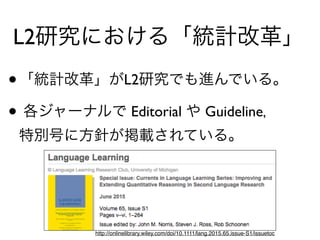
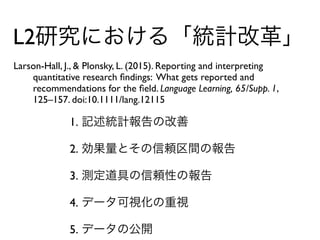
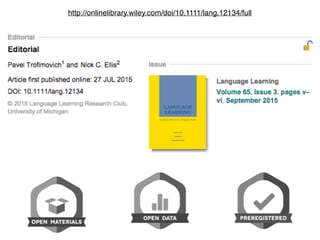
L2研究における「統計改革」
Larson-Hall, J., &Plonsky, L. (2015). Reporting and interpreting
quantitative research findings: What gets reported and
recommendations for the field. Language Learning, 65/Supp. 1,
125–157. doi:10.1111/lang.12115
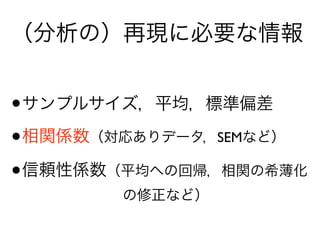
1. 記述統計報告の改善
2. 効果量とその信頼区間の報告
3. 測定道具の信頼性の報告
4. データ可視化の重視
5. データの公開
110.
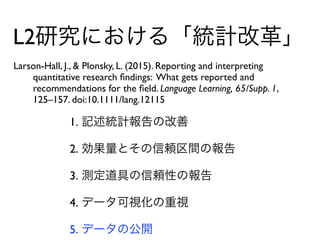
L2研究における「統計改革」
Larson-Hall, J., &Plonsky, L. (2015). Reporting and interpreting
quantitative research findings: What gets reported and
recommendations for the field. Language Learning, 65/Supp. 1,
125–157. doi:10.1111/lang.12115
1. 記述統計報告の改善
2. 効果量とその信頼区間の報告
3. 測定道具の信頼性の報告
4. データ可視化の重視
5. データの公開