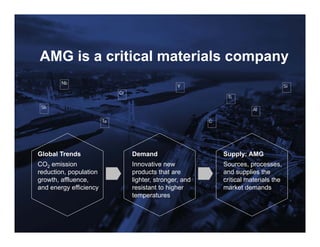
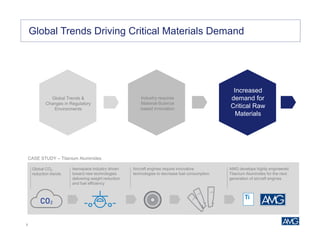
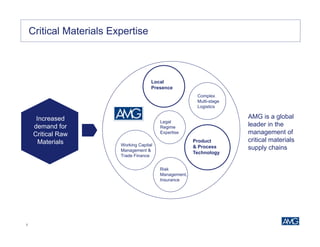
This investor presentation by AMG provides an overview of the company and the critical materials industry. AMG is a global leader in supplying critical materials to industries like aerospace, electronics, and clean energy. It has production facilities and sales offices around the world. The presentation discusses key global trends driving increased demand for critical materials, such as CO2 emission reduction and new technologies. It also outlines AMG's business segments, product portfolio, and financial highlights. Overall, the presentation aims to introduce investors to AMG's position as an expert in critical materials and its global operations.

![9
1.7
0.6 0.8 0.7
3.5
1.2
1.7
4.5
5.7
1.8
0
2.5
5
7.5
10
Scale
Metals
Note: Metal Positions are measured on a scale of 0 to 10, with 0 being the minimum price and 10 being the maximum price. They are calculated using the formula [(Mar 2005 month avg –
min. monthly avg) / (max. monthly avg – min. monthly avg) *10] where maximum and minimum monthly averages are measured over the period 1 Mar 2005 through 31 Mar 2015.
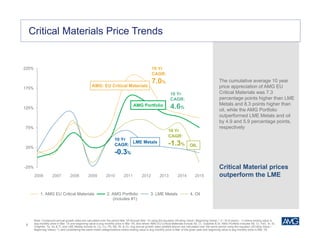
Critical Materials Prices: 10 Year Perspective
• Metal prices are measured on a
scale of 0 to 10, with 0 and 10
representing the minimum and
maximum average quarterly
prices occurring during the past
10 years
• The positions demonstrate the
current price level of each metal
with respect to their various
historical price points over the
past 10 years
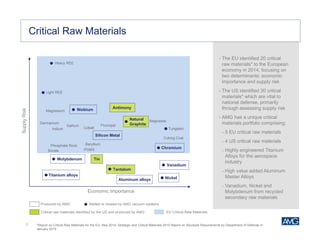
AMG has significant
potential upside within
certain critical materials
based on historical price
ranges
Cr
Mo Ni FeV
Ti
Sponge
Al
Si
Ta
Sb
Spec. Metals & Chem.Energy Transportation Infrastructure
Graphite](https://image.slidesharecdn.com/2015mayamginvestorpresentation-150507151645-lva1-app6892/85/Investor-Presentation-May-2015-9-320.jpg)