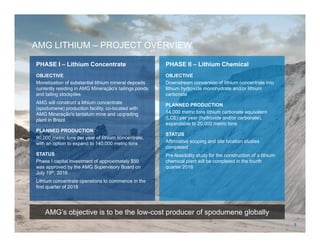
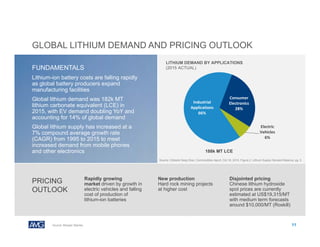
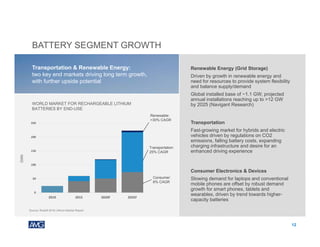
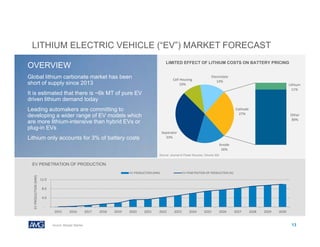
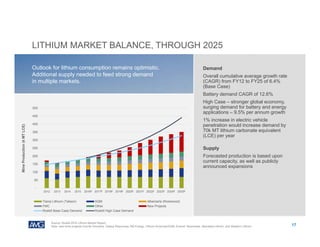
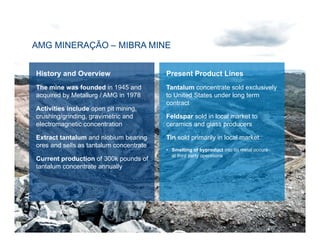
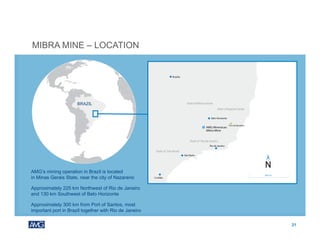
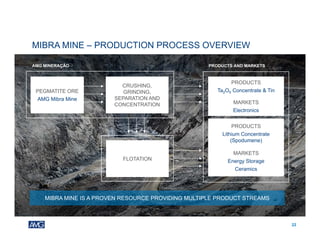
AMG
LITHIUM
AMG Advanced Metallurgical Group N.V.
Lithium Project Update July 20, 2016
TABLE OF CONTENTS
Project History 4
Project Overview 5
Project Strengths 6
Project Timeline 7
AMG Value Proposition 8
Market Fundamentals 9
AMG Mineração Mibra Mine 18
2
THIS DOCUMENT IS STRICTLY CONFIDENTIAL AND IS BEING PROVIDED TO YOU SOLELY FOR YOUR INFORMATION BY AMG
ADVANCED METALLURGICAL GROUP N.V. (THE “COMPANY”) AND MAY NOT BE REPRODUCED IN ANY FORM OR FURTHER
DISTRIBUTED TO ANY OTHER PERSON OR PUBLISHED, IN WHOLE OR IN PART, FOR ANY PURPOSE. FAILURE TO COMPLY WITH THIS
RESTRICTION MAY CONSTITUTE A VIOLATION OF APPLICABLE SECURITIES LAWS.
This presentation does not constitute or form part of, and should not be construed as, an offer to sell or issue or the solicitation of an offer to buy or
acquire securities of the Company or any of its subsidiaries nor should it or any part of it, nor the fact of its distribution, form the basis of, or be relied
on in connection with, any contract or commitment whatsoever.
This presentation has been prepared by, and is the sole responsibility of, the Company. This document, any presentation made in conjunction
herewith and any accompanying materials are for information only and are not a prospectus, offering circular or admission document. This
presentation does not form a part of, and should not be construed as, an offer, invitation or solicitation to subscribe for or purchase, or dispose of
any of the securities of the companies mentioned in this presentation. These materials do not constitute an offer of securities for sale in the United
States or an invitation or an offer to the public or form of application to subscribe for securities. Neither this presentation nor anything contained
herein shall form the basis of, or be relied on in connection with, any offer or commitment whatsoever. The information contained in this presentation
has not been independently verified. No representation or warranty, express or implied, is made as to, and no reliance should be placed on, the
fairness, accuracy or completeness of the information or the opinions contained herein. The Company and its advisors are under no obligation to
update or keep current the information contained in this presentation. To the extent allowed by law, none of the Company or its affiliates, advisors or
representatives accept any liability whatsoever (in negligence or otherwise) for any loss howsoever arising from any use of this presentation or its
contents or otherwise arising in connection with the presentation.
Certain statements in this presentation constitute forward-looking statements, including statements regarding the Company's financial position,
business strategy, plans and objectives of management for future operations. These statements, which contain the words "believe,” “expect,”
“anticipate,” “intends,” “estimate,” “forecast,” “project,” “will,” “may,” “should” and similar expressions, reflect the beliefs and expectations of the
management board of directors of the Company and are subject to risks and uncertainties that may cause actual results to differ materially. These
risks and uncertainties include, among other factors, the achievement of the anticipated levels of profitability, growth, cost and synergy of the
Company’s recent acquisitions, the timely development and acceptance of new products, the impact of competitive pricing, the ability to obtain
necessary regulatory approvals, and the impact of general business and global economic conditions. These and other factors could adversely affect
the outcome and financial effects of the plans and events described herein.
Neither the Company, nor any of its respective agents, employees or advisors intend or have any duty or obligation to supplement, amend, update
or revise any of the forward-looking statements contained in this presentation.
The information and opinions contained in this document are provided as at the date of this presentation and are subject to change without notice.
This document has not been approved by any competent regulatory or supervisory authority.
CAUTIONARY NOTE
3
AMG LITHIUM – PROJECT HISTORY
• 2002 – 2013: AMG began development of a pilot plant process route for the
flotation of Mica and Feldspar from tailings
• 2007 – 2008: Flotation equipment installed
• 2009 – 2010: Dry magnetic separator installed
• 2011: First set of samples produced and tested by industrial customer
• 2012: Electric rotate dryer was installed to enable batch trials for technical grade
Spodumene
• 2013: AMG provided 43,603kg of spodumene to industrial customer to develop a
tank test, following which pilot plant operations were halted
• 2015: The pilot plant received basic maintenance and wet magnetic separators
were rented, placing the pilot plant back into operational condition
4
AMG LITHIUM – PROJECT OVERVIEW
PHASE I – Lithium Concentrate
OBJECTIVE
Monetization of substantial lithium mineral deposits
currently residing in AMG Mineração's tailings ponds
and tailing stockpiles
AMG will construct a lithium concentrate
(spodumene) production facility, co-located with
AMG Mineração's tantalum mine and upgrading
plant in Brazil
PLANNED PRODUCTION
90,000 metric tons per year of lithium concentrate,
with an option to expand to 140,000 metric tons
STATUS
Phase I capital investment of approximately $50
was approved by the AMG Supervisory Board on
July 19th, 2016
Lithium concentrate operations to commence in the
first quarter of 2018
AMG’s objective is to be the low-cost producer of spodumene globally
PHASE II – Lithium Chemical
OBJECTIVE
Downstream conversion of lithium concentrate into
lithium hydroxide monohydrate and/or lithium
carbonate
PLANNED PRODUCTION
14,000 metric tons lithium carbonate equivalent
(LCE) per year (hydroxide and/or carbonate),
expandable to 20,000 metric tons
STATUS
Affirmative scoping and site location studies
completed
Pre-feasibility study for the construction of a lithium
chemical plant will be completed in the fourth
quarter 2016
5
AMG LITHIUM – PROJECT STRENGTHS
AMG has operated the Mibra mine for 38 years
• Existing management and mining infrastructure – not a new mine project
• Strong understanding of the mine geology
• AMG Mineração's last mineral resource estimate, published in 2013 and prepared in
accordance with National Instrument 43-101 Guidelines, and endorsed and signed-off by
Coffey, identified 19.3 million tons of measured, indicated and inferred resources, which
includes tantalum, niobium, tin and lithium
• Mining infrastructure already in place and operational
• Ore extraction and crushing costs absorbed by profitable tantalum operation
• Lithium concentrate (spodumene) plant will be fed via lithium deposits in existing tailings, as
well as incremental lithium-bearing tailings generated via tantalum production
• 2.8 million metric tons of spodumene plant feed stock already extracted in the form of on-site tailings
• AMG has operated a spodumene pilot plant since 2010 (see slide 7)
• Phase 2 lithium chemical plant pre-feasibility work being performed by Hatch, the world’s
leading builder of lithium plants
6
AMG LITHIUM – PROJECT TIMELINE
• Sample
production of
lithium
concentrate for
glass / ceramic
industry
• Updated 43-101
compliant
resource
statement – life of
mine extended
• Lithium
concentrate
(spodumene)
plant studies
completed Q4
2015 by Outotec
 Conceptual
study
 Pre-feasibility
study
• Spodumene plant
basic engineering
completed July
2016 by Outotec
• AMG
Supervisory
Board approval
July 19th, 2016
• Spodumene plant
construction to
commence Q3
2016
• Resource
expansion drilling
campaign to start
Q3 2016
• Updated 43-101
compliant
resource
statement to be
completed
• Spodumene plant
construction to be
completed Q4
2017
• Spodumene plant
to be at full
capacity Q3 2018
PHASE I
PHASE II • Hatch lithium
chemical plant
scoping and
location studies
completed Q2
2016
• Hatch lithium
chemical plant
pre-feasibility
study to be
completed Q4
2016
• Lithium
chemical plant
investment
decision Q2
2017
• Lithium chemical
plant construction
to be completed
Q3 2019
• Lithium
production
chemical ramp-up
expected during
Q4 2019
• Lithium chemical
plant production
to commence in
2020
2013-14 2015 2016 2017 2018-202010-12
• Spodumene
concentration
processing route
development
 Mineralogical
characterization
on tailings from
Ta2O5 plant
 Laboratorial
scale flotation
tests
 Pilot plant
operation
 Industrial
production
scoping study
7
AMG: MITIGATING
TECHNOLOGIES
Products and Processes saving
raw materials, energy and CO2
emissions during manufacturing
(i.e., recycling of Ferrovanadium)
AMG: ENABLING
TECHNOLOGIES
Products and Processes saving
CO2 emissions during use
(i.e., light-weighting and fuel efficiency in
the aerospace and automotive industries)
AMG HAS DEVELOPED INTO A LEADER
IN ENABLING TECHNOLOGIES
– LITHIUM FITS WELL WITHIN THIS STRATEGY
A GLOBAL IMPERATIVE FOR THE 21ST CENTURY
CO2 REDUCTION
LEADER IN ADVANCED TECHNOLOGIES
TO ADDRESS CO2 REDUCTION
AMG VALUE PROPOSITION
8
MARKET
FUNDAMENTALS
AMG Advanced Metallurgical Group N.V.
Lithium Project Update July 20, 2016
9
LITHIUM INDUSTRY BASICS & BATTERY VALUE CHAIN
HARD ROCK
LITHIUM
CONCENTRATE
(SPODUMENE)
10
CHEMICALS
CATHODE
PASTE
BRINE
BATTERIES
GLOBAL LITHIUM DEMAND AND PRICING OUTLOOK
11Source: Morgan Stanley
FUNDAMENTALS
Lithium-ion battery costs are falling rapidly
as global battery producers expand
manufacturing facilities
Global lithium demand was 182k MT
lithium carbonate equivalent (LCE) in
2015, with EV demand doubling YoY and
accounting for 14% of global demand
Global lithium supply has increased at a
7% compound average growth rate
(CAGR) from 1995 to 2015 to meet
increased demand from mobile phones
and other electronics
PRICING
OUTLOOK
Rapidly growing
market driven by growth in
electric vehicles and falling
cost of production of
lithium-ion batteries
New production
Hard rock mining projects
at higher cost
Disjointed pricing
Chinese lithium hydroxide
spot prices are currently
estimated at US$19,315/MT
with medium term forecasts
around $10,000/MT (Roskill)
Source: Citibank Deep Dive | Commodities report, Oct 16, 2015, Figure 2. Lithium Supply Demand Balance, pg. 5
LITHIUM DEMAND BY APPLICATIONS
(2015 ACTUAL)
Industrial 
Applications
66%
Consumer 
Electronics
28%
Electric 
Vehicles
6%
188k MT LCE
BATTERY SEGMENT GROWTH
12
Transportation & Renewable Energy:
two key end markets driving long term growth,
with further upside potential
Renewable Energy (Grid Storage)
Driven by growth in renewable energy and
need for resources to provide system flexibility
and balance supply/demand
Global installed base of ~1.1 GW, projected
annual installations reaching up to >12 GW
by 2025 (Navigant Research)
Transportation
Fast-growing market for hybrids and electric
vehicles driven by regulations on CO2
emissions, falling battery costs, expanding
charging infrastructure and desire for an
enhanced driving experience
Consumer Electronics & Devices
Slowing demand for laptops and conventional
mobile phones are offset by robust demand
growth for smart phones, tablets and
wearables, driven by trend towards higher-
capacity batteries
WORLD MARKET FOR RECHARGEABLE LITHIUM
BATTERIES BY END-USE
0
50
100
150
200
250
2010 2015 2020F 2025F
GWh
Renewable:
>30% CAGR
Source: Roskill 2016 Lithium Market Report
Transportation:
25% CAGR
Consumer:
6% CAGR
LITHIUM ELECTRIC VEHICLE (“EV”) MARKET FORECAST
13
OVERVIEW
Global lithium carbonate market has been
short of supply since 2013
It is estimated that there is ~6k MT of pure EV
driven lithium demand today
Leading automakers are committing to
developing a wider range of EV models which
are more lithium-intensive than hybrid EVs or
plug-in EVs
Lithium only accounts for 3% of battery costs
Source: Morgan Stanley
LIMITED EFFECT OF LITHIUM COSTS ON BATTERY PRICING
2015 2016 2017 2018 2019 2020 2021 2022 2023 2024 2025 2026 2027 2028 2029 2030
 ‐
 4.0
 8.0
 12.0
EV PRODUCTION (MM)
EV PRODUCTION (MM) EV PENETRATION OF PRODUCTION (%)
Anode
16%
Separator
33%
Cell Housing
10%
Electrolyte
14%
Lithium
11%
Other
89%
Cathode
27%
EV PENETRATION OF PRODUCTION
Source: Journal of Power Sources, Volume 320
GLOBAL LITHIUM SUPPLY
14Source: Morgan Stanley
FUNDAMENTALS
Global supply of lithium minerals has been
historically dominated by large-scale lithium brine
operations in South America
Global lithium supply has increased at a 7%
compound average growth rate (CAGR) from 1995
to 2015 to meet increased demand from mobile
phones and other electronics
2016 global lithium supply is around 164k MT LCE,
split roughly 50:50 between hard-rock and brines
99 
114 
126  124 
136  146 
164 
177  185 
127  135 
148  162 
172  182  189  197  208 
2010 2011 2012 2013 2014 2015 2016E 2017E 2018E
 ‐
 50
 100
 150
 200
 250
k MT LCE
Supply Demand
Chile
37%
Australia
33%
Argentina
11%
China
10%
US
3%
Zimbabwe
3%
Portugal
2%
Brazil
1%
LITHIUM SUPPLY AND DEMAND OVER TIME
LITHIUM SUPPLY BY COUNTRY
(2015 ACTUAL)
Source: Deutsche Bank
146k MT LCE
MARKET PRICE FORECASTS
– LITHIUM CONCENTRATE (SPODUMENE)
15
Source: Roskill 2016 Lithium Market Report
US$/MTLITHIUMCONCENTRATECIF
AMG expected
cost including
transportation
$206/MT (FOB)
0
100
200
300
400
500
600
700
800
2014 2015 2016 2017 2018 2019 2020 2021 2022 2023 2024 2025
Low Base High
LITHIUM PRODUCER / PROJECT COST POSITION
– LITHIUM CONCENTRATE (SPODUMENE)
16
0
50
100
150
200
250
300
350
400
GREENBUSHES
TIANQI LITHIUM1
(TALISON)
WHABOUCHI
NEMASKA
PILGANGOORA
PILBARA MINERALS2
MT. CATTLIN
GENERAL MINING/
GALAXY
MT. MARION
NEOMETALS
PILGANGOORA
ALTURA MINING
ROSE
CRITICAL ELEMENTS
CORP.
Source: Roskill 2016, Ehren Gonzalez Ltda, Hatch; Note – Operating costs
only, not including transportation
Note: AMG cost estimates per Outotec of $127/MT; includes production costs
and SG&A costs; does not include cost of transportation to port
Estimate of AMG
operating cost of
$127/MT
(excl. transportation)
US$/MTLITHIUMCONCENTRATE
1 Greenbushes cost includes G&A but excludes selling expenses
2 Pilbara Minerals figure includes credits from tantalite production; includes
transport and loading costs of $37/t concentrate
LITHIUM MARKET BALANCE, THROUGH 2025
17
Outlook for lithium consumption remains optimistic.
Additional supply needed to feed strong demand
in multiple markets.
Demand
Overall cumulative average growth rate
(CAGR) from FY12 to FY25 of 6.4%
(Base Case)
Battery demand CAGR of 12.6%
High Case – stronger global economy,
surging demand for battery and energy
applications – 9.5% per annum growth
1% increase in electric vehicle
penetration would increase demand by
70k MT lithium carbonate equivalent
(LCE) per year
MineProduction(kMTLCE)
Source: Roskill 2016 Lithium Market Report
Note: new mine projects include Orocobre, Galaxy Resources, RB Energy, Lithium Americas/SQM, Eramet, Neometals, Nemaska Lithium, and Western Lithium.
Supply
Forecasted production is based upon
current capacity, as well as publicly
announced expansions
-
50
100
150
200
250
300
350
400
450
500
2012 2013 2014 2015 2016F 2017F 2018F 2019F 2020F 2021F 2022F 2023F 2024F 2025F
Tianqi Lithium (Talison) SQM Albemarle (Rockwood)
FMC Other New Projects
Roskill Base Case Demand Roskill High Case Demand
AMG
MINERAÇÃO
MIBRA MINE
AMG Advanced Metallurgical Group N.V.
Lithium Project Update July 20, 2016
18
AMG MINERAÇÃO – MIBRA MINE
History and Overview
The mine was founded in 1945 and
acquired by Metallurg / AMG in 1978
Activities include open pit mining,
crushing/grinding, gravimetric and
electromagnetic concentration
Extract tantalum and niobium bearing
ores and sells as tantalum concentrate
Current production of 300k pounds of
tantalum concentrate annually
Present Product Lines
Tantalum concentrate sold exclusively
to United States under long term
contract
Feldspar sold in local market to
ceramics and glass producers
Tin sold primarily in local market
• Smelting of byproduct into tin metal occurs
at third party operations
19
MIBRA
MINE
AERIAL VIEW
20
MIBRA MINE – LOCATION
21
AMG’s mining operation in Brazil is located
in Minas Gerais State, near the city of Nazareno
Approximately 225 km Northwest of Rio de Janeiro
and 130 km Southwest of Belo Horizonte
Approximately 300 km from Port of Santos, most
important port in Brazil together with Rio de Janeiro
BRAZIL
MIBRA MINE – PRODUCTION PROCESS OVERVIEW
MIBRA MINE IS A PROVEN RESOURCE PROVIDING MULTIPLE PRODUCT STREAMS
AMG MINERAÇÃO PRODUCTS AND MARKETS
PRODUCTS
Ta2O5 Concentrate & Tin
MARKETS
Electronics
PRODUCTS
Lithium Concentrate
(Spodumene)
MARKETS
Energy Storage
Ceramics
PEGMATITE ORE
AMG Mibra Mine
CRUSHING,
GRINDING,
SEPARATION AND
CONCENTRATION
FLOTATION
22
MIBRA MINE – MINERAL RESOURCES
23
RESOURCE EXPANSION – OBJECTIVES
• Update new resource in the west area of the mine, not included in 2013 resource statement
• Upgrade existing mineral resources from Inferred to Indicated and / or Indicated to Measured
• Exercise to be completed 1H 2017
Source
MT Material
(ore/Tailings)
% Li20
Contained
MT Li20
Contained
in Ore
MT LCE
Contained
MT Li20
Contained in
Spodumene
Concentrate
MT
Spodumene
Concentrate
Ore source – 2013 19,360,000 1 146,363 361,019 90,745 1,463,630
Less consumption 3,214,584 3 15,517 38,274 9,620 155,167
Net Ore Balance 16,145,416 2 0.81% 130,846 322,745 81,125 1,308,463
Tailings-Ponds 1&2 4
2,070,110 1.00% 20,701 51,061 13,870 223,705
Net Ore & Tailings Ponds 18,215,526 151,547 373,807 94,994 1,532,168
Tailings-Stockpiles 4
750,000 1.15% 8,625 5,779 5,779 93,206
Total Resources 18,965,526 160,172 379,586 100,773 1,625,374
1 Ore balance per 2013 NI 43-101 Statement
2 Prior to resource expansion
3 AMG estimate of ore consumed in Ta and Feldspar production; residual quantities to tailings ponds
4 Preliminary AMG estimates
MIBRA MINE – MINE LIFE EXTENSION
– DRILLING CAMPAIGN & RESOURCE EXPANSION
24
Purpose & Benefits
Expand existing tantalum and
lithium resources in Mibra
Upgrade existing mineral resources
from ‘Inferred’ to ‘Indicated’ and / or
‘Indicated’ to ‘Measured’
Extend useful life of mine
Comply with legal requirements of
Mineral Right 831.043/2013 which
requires exploration be conducted
to maintain the license.
Objective
Upgrade existing mineral
resources from ‘Inferred’ to
‘Indicated’ and / or ‘Indicated’ to
‘Measured’
Objective
Update new resource in the west
area of the mine; not included in
2013 resource statement
Drill Plan- New Resource
Drill Holes Executed
Measured
Indicated
Inferred
ORE A RESOURCE
AMG Lithium

AMG Lithium

  • 1.
    AMG LITHIUM AMG Advanced MetallurgicalGroup N.V. Lithium Project Update July 20, 2016
  • 2.
    TABLE OF CONTENTS ProjectHistory 4 Project Overview 5 Project Strengths 6 Project Timeline 7 AMG Value Proposition 8 Market Fundamentals 9 AMG Mineração Mibra Mine 18 2
  • 3.
    THIS DOCUMENT ISSTRICTLY CONFIDENTIAL AND IS BEING PROVIDED TO YOU SOLELY FOR YOUR INFORMATION BY AMG ADVANCED METALLURGICAL GROUP N.V. (THE “COMPANY”) AND MAY NOT BE REPRODUCED IN ANY FORM OR FURTHER DISTRIBUTED TO ANY OTHER PERSON OR PUBLISHED, IN WHOLE OR IN PART, FOR ANY PURPOSE. FAILURE TO COMPLY WITH THIS RESTRICTION MAY CONSTITUTE A VIOLATION OF APPLICABLE SECURITIES LAWS. This presentation does not constitute or form part of, and should not be construed as, an offer to sell or issue or the solicitation of an offer to buy or acquire securities of the Company or any of its subsidiaries nor should it or any part of it, nor the fact of its distribution, form the basis of, or be relied on in connection with, any contract or commitment whatsoever. This presentation has been prepared by, and is the sole responsibility of, the Company. This document, any presentation made in conjunction herewith and any accompanying materials are for information only and are not a prospectus, offering circular or admission document. This presentation does not form a part of, and should not be construed as, an offer, invitation or solicitation to subscribe for or purchase, or dispose of any of the securities of the companies mentioned in this presentation. These materials do not constitute an offer of securities for sale in the United States or an invitation or an offer to the public or form of application to subscribe for securities. Neither this presentation nor anything contained herein shall form the basis of, or be relied on in connection with, any offer or commitment whatsoever. The information contained in this presentation has not been independently verified. No representation or warranty, express or implied, is made as to, and no reliance should be placed on, the fairness, accuracy or completeness of the information or the opinions contained herein. The Company and its advisors are under no obligation to update or keep current the information contained in this presentation. To the extent allowed by law, none of the Company or its affiliates, advisors or representatives accept any liability whatsoever (in negligence or otherwise) for any loss howsoever arising from any use of this presentation or its contents or otherwise arising in connection with the presentation. Certain statements in this presentation constitute forward-looking statements, including statements regarding the Company's financial position, business strategy, plans and objectives of management for future operations. These statements, which contain the words "believe,” “expect,” “anticipate,” “intends,” “estimate,” “forecast,” “project,” “will,” “may,” “should” and similar expressions, reflect the beliefs and expectations of the management board of directors of the Company and are subject to risks and uncertainties that may cause actual results to differ materially. These risks and uncertainties include, among other factors, the achievement of the anticipated levels of profitability, growth, cost and synergy of the Company’s recent acquisitions, the timely development and acceptance of new products, the impact of competitive pricing, the ability to obtain necessary regulatory approvals, and the impact of general business and global economic conditions. These and other factors could adversely affect the outcome and financial effects of the plans and events described herein. Neither the Company, nor any of its respective agents, employees or advisors intend or have any duty or obligation to supplement, amend, update or revise any of the forward-looking statements contained in this presentation. The information and opinions contained in this document are provided as at the date of this presentation and are subject to change without notice. This document has not been approved by any competent regulatory or supervisory authority. CAUTIONARY NOTE 3
  • 4.
    AMG LITHIUM –PROJECT HISTORY • 2002 – 2013: AMG began development of a pilot plant process route for the flotation of Mica and Feldspar from tailings • 2007 – 2008: Flotation equipment installed • 2009 – 2010: Dry magnetic separator installed • 2011: First set of samples produced and tested by industrial customer • 2012: Electric rotate dryer was installed to enable batch trials for technical grade Spodumene • 2013: AMG provided 43,603kg of spodumene to industrial customer to develop a tank test, following which pilot plant operations were halted • 2015: The pilot plant received basic maintenance and wet magnetic separators were rented, placing the pilot plant back into operational condition 4
  • 5.
    AMG LITHIUM –PROJECT OVERVIEW PHASE I – Lithium Concentrate OBJECTIVE Monetization of substantial lithium mineral deposits currently residing in AMG Mineração's tailings ponds and tailing stockpiles AMG will construct a lithium concentrate (spodumene) production facility, co-located with AMG Mineração's tantalum mine and upgrading plant in Brazil PLANNED PRODUCTION 90,000 metric tons per year of lithium concentrate, with an option to expand to 140,000 metric tons STATUS Phase I capital investment of approximately $50 was approved by the AMG Supervisory Board on July 19th, 2016 Lithium concentrate operations to commence in the first quarter of 2018 AMG’s objective is to be the low-cost producer of spodumene globally PHASE II – Lithium Chemical OBJECTIVE Downstream conversion of lithium concentrate into lithium hydroxide monohydrate and/or lithium carbonate PLANNED PRODUCTION 14,000 metric tons lithium carbonate equivalent (LCE) per year (hydroxide and/or carbonate), expandable to 20,000 metric tons STATUS Affirmative scoping and site location studies completed Pre-feasibility study for the construction of a lithium chemical plant will be completed in the fourth quarter 2016 5
  • 6.
    AMG LITHIUM –PROJECT STRENGTHS AMG has operated the Mibra mine for 38 years • Existing management and mining infrastructure – not a new mine project • Strong understanding of the mine geology • AMG Mineração's last mineral resource estimate, published in 2013 and prepared in accordance with National Instrument 43-101 Guidelines, and endorsed and signed-off by Coffey, identified 19.3 million tons of measured, indicated and inferred resources, which includes tantalum, niobium, tin and lithium • Mining infrastructure already in place and operational • Ore extraction and crushing costs absorbed by profitable tantalum operation • Lithium concentrate (spodumene) plant will be fed via lithium deposits in existing tailings, as well as incremental lithium-bearing tailings generated via tantalum production • 2.8 million metric tons of spodumene plant feed stock already extracted in the form of on-site tailings • AMG has operated a spodumene pilot plant since 2010 (see slide 7) • Phase 2 lithium chemical plant pre-feasibility work being performed by Hatch, the world’s leading builder of lithium plants 6
  • 7.
    AMG LITHIUM –PROJECT TIMELINE • Sample production of lithium concentrate for glass / ceramic industry • Updated 43-101 compliant resource statement – life of mine extended • Lithium concentrate (spodumene) plant studies completed Q4 2015 by Outotec  Conceptual study  Pre-feasibility study • Spodumene plant basic engineering completed July 2016 by Outotec • AMG Supervisory Board approval July 19th, 2016 • Spodumene plant construction to commence Q3 2016 • Resource expansion drilling campaign to start Q3 2016 • Updated 43-101 compliant resource statement to be completed • Spodumene plant construction to be completed Q4 2017 • Spodumene plant to be at full capacity Q3 2018 PHASE I PHASE II • Hatch lithium chemical plant scoping and location studies completed Q2 2016 • Hatch lithium chemical plant pre-feasibility study to be completed Q4 2016 • Lithium chemical plant investment decision Q2 2017 • Lithium chemical plant construction to be completed Q3 2019 • Lithium production chemical ramp-up expected during Q4 2019 • Lithium chemical plant production to commence in 2020 2013-14 2015 2016 2017 2018-202010-12 • Spodumene concentration processing route development  Mineralogical characterization on tailings from Ta2O5 plant  Laboratorial scale flotation tests  Pilot plant operation  Industrial production scoping study 7
  • 8.
    AMG: MITIGATING TECHNOLOGIES Products andProcesses saving raw materials, energy and CO2 emissions during manufacturing (i.e., recycling of Ferrovanadium) AMG: ENABLING TECHNOLOGIES Products and Processes saving CO2 emissions during use (i.e., light-weighting and fuel efficiency in the aerospace and automotive industries) AMG HAS DEVELOPED INTO A LEADER IN ENABLING TECHNOLOGIES – LITHIUM FITS WELL WITHIN THIS STRATEGY A GLOBAL IMPERATIVE FOR THE 21ST CENTURY CO2 REDUCTION LEADER IN ADVANCED TECHNOLOGIES TO ADDRESS CO2 REDUCTION AMG VALUE PROPOSITION 8
  • 9.
    MARKET FUNDAMENTALS AMG Advanced MetallurgicalGroup N.V. Lithium Project Update July 20, 2016 9
  • 10.
    LITHIUM INDUSTRY BASICS& BATTERY VALUE CHAIN HARD ROCK LITHIUM CONCENTRATE (SPODUMENE) 10 CHEMICALS CATHODE PASTE BRINE BATTERIES
  • 11.
    GLOBAL LITHIUM DEMANDAND PRICING OUTLOOK 11Source: Morgan Stanley FUNDAMENTALS Lithium-ion battery costs are falling rapidly as global battery producers expand manufacturing facilities Global lithium demand was 182k MT lithium carbonate equivalent (LCE) in 2015, with EV demand doubling YoY and accounting for 14% of global demand Global lithium supply has increased at a 7% compound average growth rate (CAGR) from 1995 to 2015 to meet increased demand from mobile phones and other electronics PRICING OUTLOOK Rapidly growing market driven by growth in electric vehicles and falling cost of production of lithium-ion batteries New production Hard rock mining projects at higher cost Disjointed pricing Chinese lithium hydroxide spot prices are currently estimated at US$19,315/MT with medium term forecasts around $10,000/MT (Roskill) Source: Citibank Deep Dive | Commodities report, Oct 16, 2015, Figure 2. Lithium Supply Demand Balance, pg. 5 LITHIUM DEMAND BY APPLICATIONS (2015 ACTUAL) Industrial  Applications 66% Consumer  Electronics 28% Electric  Vehicles 6% 188k MT LCE
  • 12.
    BATTERY SEGMENT GROWTH 12 Transportation& Renewable Energy: two key end markets driving long term growth, with further upside potential Renewable Energy (Grid Storage) Driven by growth in renewable energy and need for resources to provide system flexibility and balance supply/demand Global installed base of ~1.1 GW, projected annual installations reaching up to >12 GW by 2025 (Navigant Research) Transportation Fast-growing market for hybrids and electric vehicles driven by regulations on CO2 emissions, falling battery costs, expanding charging infrastructure and desire for an enhanced driving experience Consumer Electronics & Devices Slowing demand for laptops and conventional mobile phones are offset by robust demand growth for smart phones, tablets and wearables, driven by trend towards higher- capacity batteries WORLD MARKET FOR RECHARGEABLE LITHIUM BATTERIES BY END-USE 0 50 100 150 200 250 2010 2015 2020F 2025F GWh Renewable: >30% CAGR Source: Roskill 2016 Lithium Market Report Transportation: 25% CAGR Consumer: 6% CAGR
  • 13.
    LITHIUM ELECTRIC VEHICLE(“EV”) MARKET FORECAST 13 OVERVIEW Global lithium carbonate market has been short of supply since 2013 It is estimated that there is ~6k MT of pure EV driven lithium demand today Leading automakers are committing to developing a wider range of EV models which are more lithium-intensive than hybrid EVs or plug-in EVs Lithium only accounts for 3% of battery costs Source: Morgan Stanley LIMITED EFFECT OF LITHIUM COSTS ON BATTERY PRICING 2015 2016 2017 2018 2019 2020 2021 2022 2023 2024 2025 2026 2027 2028 2029 2030  ‐  4.0  8.0  12.0 EV PRODUCTION (MM) EV PRODUCTION (MM) EV PENETRATION OF PRODUCTION (%) Anode 16% Separator 33% Cell Housing 10% Electrolyte 14% Lithium 11% Other 89% Cathode 27% EV PENETRATION OF PRODUCTION Source: Journal of Power Sources, Volume 320
  • 14.
    GLOBAL LITHIUM SUPPLY 14Source:Morgan Stanley FUNDAMENTALS Global supply of lithium minerals has been historically dominated by large-scale lithium brine operations in South America Global lithium supply has increased at a 7% compound average growth rate (CAGR) from 1995 to 2015 to meet increased demand from mobile phones and other electronics 2016 global lithium supply is around 164k MT LCE, split roughly 50:50 between hard-rock and brines 99  114  126  124  136  146  164  177  185  127  135  148  162  172  182  189  197  208  2010 2011 2012 2013 2014 2015 2016E 2017E 2018E  ‐  50  100  150  200  250 k MT LCE Supply Demand Chile 37% Australia 33% Argentina 11% China 10% US 3% Zimbabwe 3% Portugal 2% Brazil 1% LITHIUM SUPPLY AND DEMAND OVER TIME LITHIUM SUPPLY BY COUNTRY (2015 ACTUAL) Source: Deutsche Bank 146k MT LCE
  • 15.
    MARKET PRICE FORECASTS –LITHIUM CONCENTRATE (SPODUMENE) 15 Source: Roskill 2016 Lithium Market Report US$/MTLITHIUMCONCENTRATECIF AMG expected cost including transportation $206/MT (FOB) 0 100 200 300 400 500 600 700 800 2014 2015 2016 2017 2018 2019 2020 2021 2022 2023 2024 2025 Low Base High
  • 16.
    LITHIUM PRODUCER /PROJECT COST POSITION – LITHIUM CONCENTRATE (SPODUMENE) 16 0 50 100 150 200 250 300 350 400 GREENBUSHES TIANQI LITHIUM1 (TALISON) WHABOUCHI NEMASKA PILGANGOORA PILBARA MINERALS2 MT. CATTLIN GENERAL MINING/ GALAXY MT. MARION NEOMETALS PILGANGOORA ALTURA MINING ROSE CRITICAL ELEMENTS CORP. Source: Roskill 2016, Ehren Gonzalez Ltda, Hatch; Note – Operating costs only, not including transportation Note: AMG cost estimates per Outotec of $127/MT; includes production costs and SG&A costs; does not include cost of transportation to port Estimate of AMG operating cost of $127/MT (excl. transportation) US$/MTLITHIUMCONCENTRATE 1 Greenbushes cost includes G&A but excludes selling expenses 2 Pilbara Minerals figure includes credits from tantalite production; includes transport and loading costs of $37/t concentrate
  • 17.
    LITHIUM MARKET BALANCE,THROUGH 2025 17 Outlook for lithium consumption remains optimistic. Additional supply needed to feed strong demand in multiple markets. Demand Overall cumulative average growth rate (CAGR) from FY12 to FY25 of 6.4% (Base Case) Battery demand CAGR of 12.6% High Case – stronger global economy, surging demand for battery and energy applications – 9.5% per annum growth 1% increase in electric vehicle penetration would increase demand by 70k MT lithium carbonate equivalent (LCE) per year MineProduction(kMTLCE) Source: Roskill 2016 Lithium Market Report Note: new mine projects include Orocobre, Galaxy Resources, RB Energy, Lithium Americas/SQM, Eramet, Neometals, Nemaska Lithium, and Western Lithium. Supply Forecasted production is based upon current capacity, as well as publicly announced expansions - 50 100 150 200 250 300 350 400 450 500 2012 2013 2014 2015 2016F 2017F 2018F 2019F 2020F 2021F 2022F 2023F 2024F 2025F Tianqi Lithium (Talison) SQM Albemarle (Rockwood) FMC Other New Projects Roskill Base Case Demand Roskill High Case Demand
  • 18.
    AMG MINERAÇÃO MIBRA MINE AMG AdvancedMetallurgical Group N.V. Lithium Project Update July 20, 2016 18
  • 19.
    AMG MINERAÇÃO –MIBRA MINE History and Overview The mine was founded in 1945 and acquired by Metallurg / AMG in 1978 Activities include open pit mining, crushing/grinding, gravimetric and electromagnetic concentration Extract tantalum and niobium bearing ores and sells as tantalum concentrate Current production of 300k pounds of tantalum concentrate annually Present Product Lines Tantalum concentrate sold exclusively to United States under long term contract Feldspar sold in local market to ceramics and glass producers Tin sold primarily in local market • Smelting of byproduct into tin metal occurs at third party operations 19
  • 20.
  • 21.
    MIBRA MINE –LOCATION 21 AMG’s mining operation in Brazil is located in Minas Gerais State, near the city of Nazareno Approximately 225 km Northwest of Rio de Janeiro and 130 km Southwest of Belo Horizonte Approximately 300 km from Port of Santos, most important port in Brazil together with Rio de Janeiro BRAZIL
  • 22.
    MIBRA MINE –PRODUCTION PROCESS OVERVIEW MIBRA MINE IS A PROVEN RESOURCE PROVIDING MULTIPLE PRODUCT STREAMS AMG MINERAÇÃO PRODUCTS AND MARKETS PRODUCTS Ta2O5 Concentrate & Tin MARKETS Electronics PRODUCTS Lithium Concentrate (Spodumene) MARKETS Energy Storage Ceramics PEGMATITE ORE AMG Mibra Mine CRUSHING, GRINDING, SEPARATION AND CONCENTRATION FLOTATION 22
  • 23.
    MIBRA MINE –MINERAL RESOURCES 23 RESOURCE EXPANSION – OBJECTIVES • Update new resource in the west area of the mine, not included in 2013 resource statement • Upgrade existing mineral resources from Inferred to Indicated and / or Indicated to Measured • Exercise to be completed 1H 2017 Source MT Material (ore/Tailings) % Li20 Contained MT Li20 Contained in Ore MT LCE Contained MT Li20 Contained in Spodumene Concentrate MT Spodumene Concentrate Ore source – 2013 19,360,000 1 146,363 361,019 90,745 1,463,630 Less consumption 3,214,584 3 15,517 38,274 9,620 155,167 Net Ore Balance 16,145,416 2 0.81% 130,846 322,745 81,125 1,308,463 Tailings-Ponds 1&2 4 2,070,110 1.00% 20,701 51,061 13,870 223,705 Net Ore & Tailings Ponds 18,215,526 151,547 373,807 94,994 1,532,168 Tailings-Stockpiles 4 750,000 1.15% 8,625 5,779 5,779 93,206 Total Resources 18,965,526 160,172 379,586 100,773 1,625,374 1 Ore balance per 2013 NI 43-101 Statement 2 Prior to resource expansion 3 AMG estimate of ore consumed in Ta and Feldspar production; residual quantities to tailings ponds 4 Preliminary AMG estimates
  • 24.
    MIBRA MINE –MINE LIFE EXTENSION – DRILLING CAMPAIGN & RESOURCE EXPANSION 24 Purpose & Benefits Expand existing tantalum and lithium resources in Mibra Upgrade existing mineral resources from ‘Inferred’ to ‘Indicated’ and / or ‘Indicated’ to ‘Measured’ Extend useful life of mine Comply with legal requirements of Mineral Right 831.043/2013 which requires exploration be conducted to maintain the license. Objective Upgrade existing mineral resources from ‘Inferred’ to ‘Indicated’ and / or ‘Indicated’ to ‘Measured’ Objective Update new resource in the west area of the mine; not included in 2013 resource statement Drill Plan- New Resource Drill Holes Executed Measured Indicated Inferred ORE A RESOURCE