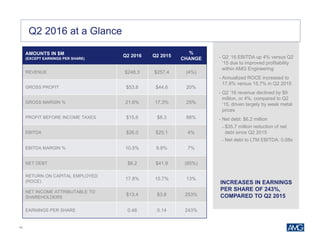
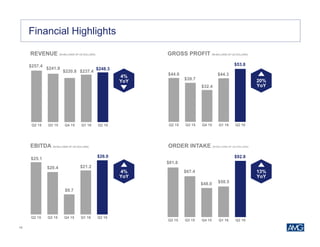
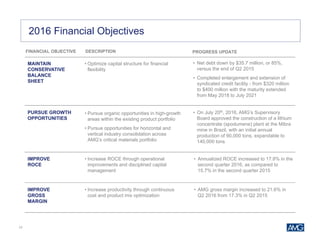
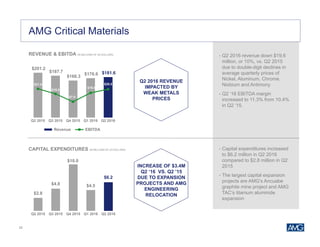
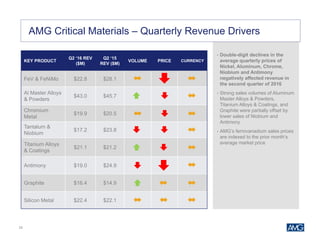
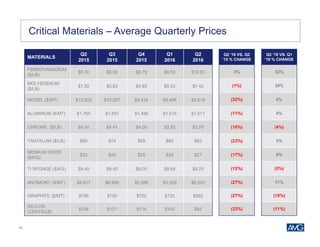
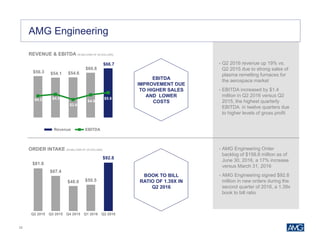
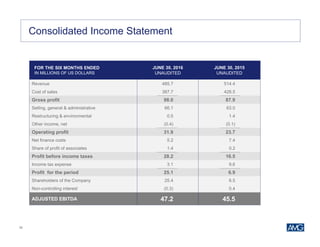
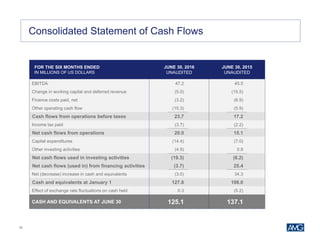
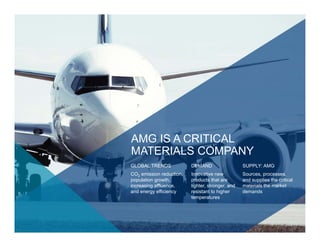
The document is an investor presentation by AMG Advanced Metallurgical Group N.V. that provides an overview of the company. It discusses AMG's business segments which involve sourcing, processing, and supplying critical raw materials. It highlights AMG's focus on enabling technologies to reduce CO2 emissions and notes several critical raw materials identified by the EU and US that AMG produces. The presentation provides financial highlights for Q2 2016, showing increases in earnings per share, EBITDA, and gross profit compared to Q2 2015. It outlines AMG's 2016 financial objectives of improving return on capital employed and gross margin while pursuing growth opportunities and maintaining a conservative balance sheet.
Mason Graphite Corporate Presentation - February 2016masongraphite
Mason Graphite is a Canadian mining and processing company focused on the development of its 100% owned Lac Guéret natural graphite deposit located in northeastern Québec. The Company is led by a highly experienced team that has over five decades of experience in graphite production, sales, and research and development. For more information, visit www.masongraphite.com.
TSX.V: LLG
This presentation was prepared for the 2015 Benchmark Minerals Intelligence Battery Raw Materials | Supply Chain 20/20 World Tour and was presented in NYC and Toronto by CEO Paul Gorman.
Lattice Energy LLC- Mystery of the Missing Nickel and Vanadium-Nov 6 2011Lewis Larsen
Mystery of apparently ‘missing’ Nickel and Vanadium: in the refereed paper “Hydrous pyrolysis of crude oil in gold-plated reactors,” Organic Geochemistry 18 pp. 745 - 756 (1992) J.A. Curiale (Unocal) et al. reported results of experiments in which crude oil samples subjected to hydrous pyrolysis showed significant decreases in concentrations of trace metals Nickel and Vanadium over time. In one experiment, Iraq/300, decreases in Ni and V were accompanied by modest shift in Carbon isotopic ratios.
In the above November 6, 2011, SlideShare presentation we discuss Curiale et al.’s experimental apparatus and their observations in the light of an alternative nuclear paradigm: the Widom-Larsen theory of LENRs in condensed matter. Curious readers can examine Curiale et al.’s published data, review our discussion and alternative interpretation of their results, and decide for themselves whether further experimental measurements looking for similar anomalies in products of various types of industrial pyrolysis processes might be interesting and useful for increasing our knowledge of such phenomena.
2. 2
About AMG 4
CO2 Reduction 5
Strong Capital Structure 6
Critical Raw Materials 7
Critical Materials Price Trends 8
Critical Materials Prices: 10 Year Perspective 9
AMG Business Segments 10
Global Footprint 11
Health and Safety Focus 13
Financial Highlights 14
Strategy & Outlook 26
Key Products & End Markets 30
Appendix 36
TABLE OF CONTENTS
3. 3
THIS DOCUMENT IS STRICTLY CONFIDENTIAL AND IS BEING PROVIDED TO YOU SOLELY FOR YOUR INFORMATION BY AMG
ADVANCED METALLURGICAL GROUP N.V. (THE “COMPANY”) AND MAY NOT BE REPRODUCED IN ANY FORM OR FURTHER
DISTRIBUTED TO ANY OTHER PERSON OR PUBLISHED, IN WHOLE OR IN PART, FOR ANY PURPOSE. FAILURE TO COMPLY WITH THIS
RESTRICTION MAY CONSTITUTE A VIOLATION OF APPLICABLE SECURITIES LAWS.
This presentation does not constitute or form part of, and should not be construed as, an offer to sell or issue or the solicitation of an offer to buy or
acquire securities of the Company or any of its subsidiaries nor should it or any part of it, nor the fact of its distribution, form the basis of, or be relied
on in connection with, any contract or commitment whatsoever.
This presentation has been prepared by, and is the sole responsibility of, the Company. This document, any presentation made in conjunction
herewith and any accompanying materials are for information only and are not a prospectus, offering circular or admission document. This
presentation does not form a part of, and should not be construed as, an offer, invitation or solicitation to subscribe for or purchase, or dispose of
any of the securities of the companies mentioned in this presentation. These materials do not constitute an offer of securities for sale in the United
States or an invitation or an offer to the public or form of application to subscribe for securities. Neither this presentation nor anything contained
herein shall form the basis of, or be relied on in connection with, any offer or commitment whatsoever. The information contained in this presentation
has not been independently verified. No representation or warranty, express or implied, is made as to, and no reliance should be placed on, the
fairness, accuracy or completeness of the information or the opinions contained herein. The Company and its advisors are under no obligation to
update or keep current the information contained in this presentation. To the extent allowed by law, none of the Company or its affiliates, advisors or
representatives accept any liability whatsoever (in negligence or otherwise) for any loss howsoever arising from any use of this presentation or its
contents or otherwise arising in connection with the presentation.
Certain statements in this presentation constitute forward-looking statements, including statements regarding the Company's financial position,
business strategy, plans and objectives of management for future operations. These statements, which contain the words "believe,” “expect,”
“anticipate,” “intends,” “estimate,” “forecast,” “project,” “will,” “may,” “should” and similar expressions, reflect the beliefs and expectations of the
management board of directors of the Company and are subject to risks and uncertainties that may cause actual results to differ materially. These
risks and uncertainties include, among other factors, the achievement of the anticipated levels of profitability, growth, cost and synergy of the
Company’s recent acquisitions, the timely development and acceptance of new products, the impact of competitive pricing, the ability to obtain
necessary regulatory approvals, and the impact of general business and global economic conditions. These and other factors could adversely affect
the outcome and financial effects of the plans and events described herein.
Neither the Company, nor any of its respective agents, employees or advisors intend or have any duty or obligation to supplement, amend, update
or revise any of the forward-looking statements contained in this presentation.
The information and opinions contained in this document are provided as at the date of this presentation and are subject to change without notice.
This document has not been approved by any competent regulatory or supervisory authority.
Cautionary Note
4. 4
SUPPLY: AMG
Sources, processes,
and supplies the critical
materials the market
demands
GLOBAL TRENDS
CO2 emission reduction,
population growth,
increasing affluence,
and energy efficiency
DEMAND
Innovative new
products that are
lighter, stronger, and
resistant to higher
temperatures
AMG IS A CRITICAL
MATERIALS COMPANY
5. 5
AMG: MITIGATING
TECHNOLOGIES
Products and Processes saving
raw materials, energy and CO2
emissions during manufacturing
(i.e., recycling of Ferrovanadium)
AMG: ENABLING
TECHNOLOGIES
Products and Processes saving
CO2 emissions during use
(i.e., light-weighting and fuel efficiency in
the aerospace and automotive industries)
AMG HAS DEVELOPED INTO A LEADER
IN ENABLING TECHNOLOGIES
A GLOBAL IMPERATIVE FOR THE 21ST CENTURY
CO2 REDUCTION
LEADER IN ADVANCED TECHNOLOGIES
TO ADDRESS CO2 REDUCTION
6. 6
6
• Refinanced credit facility in 2016,
providing a stable capital base
and liquidity for strategic growth
• Deleveraged balance sheet; zero
net debt at end of FY15
OPTIMIZED
CAPITAL STRUCTURE
• Rigorous process to review
strategic growth opportunities that
is both selective and opportunistic
• Organic growth strategy is focused
on areas of our portfolio that are
marked by strong demand growth
or supply limitations
• Financially and operationally
capable of quickly assessing
opportunities
• Initiated first dividend to
shareholders in 2015
• Reflecting AMG commitment to
return value to shareholders
DISCIPLINED ORGANIC
GROWTH & ACQUISITIONS
RETURN EXCESS CASH
TO SHAREHOLDERS
Strong capital structure, free of net debt, positioned for growth
Driving long-term sustainable growth and shareholder value
7. 7
Heavy REE
Niobium
Chromium
Light REE
Magnesium
Germanium
Indium
Gallium
Cobalt
Beryllium
PGMS
Fluorspar
Phosphate Rock
Borate
Magnesite
Tungsten
Coking Coal
Vanadium
Aluminum alloys
TinMolybdenum
Nickel
Antimony
Silicon Metal
Natural
Graphite
Tantalum
SUPPLYRISK
ECONOMIC IMPORTANCE
Critical Raw Materials
• The EU identified 20 critical
raw materials* to the European
economy in 2014, focusing on
two determinants: economic
importance and supply risk
• The US identified 30 critical
materials* which are vital to
national defense, primarily
through assessing supply risk
• AMG has a unique critical
materials portfolio comprising:
– 5 EU critical raw materials
– 4 US critical raw materials
– Highly engineered Titanium
Alloys for the aerospace
industry
– High value added Aluminum
Master Alloys
– Vanadium, Nickel and
Molybdenum from recycled
secondary raw materials
Melted or treated by AMG vacuum systemsProduced by AMG
Critical raw materials identified by the US and produced by AMG EU Critical Raw Materials
*Report on Critical Raw Materials for the EU, May 2014; Strategic and Critical Materials 2015 Report on Stockpile Requirements by Department of Defense in
January 2015.
Titanium alloys
Lithium
8. 8
Critical Materials Price Trends
CRITICAL MATERIAL
PRICES OUTPERFORM
THE LME
-50%
0%
50%
100%
150%
200%
1. AMG EU Critical Materials 2. AMG Portfolio
(includes #1)
3. LME Metals 4. Oil
10 Yr
CAGR:
-3.7%
10 Yr
CAGR:
2.2%
10 Yr
CAGR:
2.7%
10 Yr
CAGR:
-4.1%
2007 2008 2009 2010 2011 2012 2013 2014 2015 2016
AMG: EU Critical Materials
OIL
LME Metals
AMG Portfolio
Note: Compound annual growth rates are calculated over the period Jun ‘06 through Jun ‘16 using the equation ((Ending Value / Beginning Value) ^ (1 / # of years) - 1) where ending value is avg
monthly price in Jun ‘16 and beginning value is avg monthly price in Jun ‘06; and where AMG EU Critical Materials include Sb, Cr, Graphite & Si; AMG Portfolio includes Sb, Cr, FeV, Li, Nb, Si,
Sr, Graphite, Ta, Sn & Ti; and LME Metals include Al, Co, Cu, Pb, Mo, Ni, & Zn. Avg annual growth rates (plotted above) are calculated over the same period using the equation ((Ending Value /
Beginning Value) -1) and considering the same metal categorizations where ending value is avg monthly price in Jun of the given year and beginning value is avg monthly price in Jun ‘06.
The cumulative average 10 year
price appreciation of the AMG
Portfolio was 6.4 percentage
points higher than LME Metals and
6.8 points higher than oil, while the
AMG EU Critical Materials
outperformed LME Metals and oil
by 5.9 and 6.3 percentage points,
respectively
9. 9
Critical Materials Prices: 10 Year Perspective
AMG has significant
potential upside within
certain critical materials
based on historical price
ranges
Note: Metal Positions are measured on a scale of 0 to 10, with 0 being the minimum price and 10 being the maximum price. They are calculated using the formula [(Jun ‘06 month avg –
min. monthly avg) / (max. monthly avg – min. monthly avg) *10] where maximum and minimum monthly averages are measured over the period 1 Jun ‘06 through 30 Jun ‘16.
1.9
1.2
0.3
1.5
2.5
1.7
0.9
1.7
5.8
0.8
1.8
3.9
0.8
1.1 1.1
4.5
2.1 2.2
5.3
5.8
1.7
3.2
0
2.5
5
7.5
10
Scale
Metals
Jun 2016 Position Jun 2015 Position
Cr Mo Ni FeV Ti Al C Si Ta Sb
Highest
Price in
10 years
Lowest
Price in
10 years
[unchanged]
• Metal prices are measured on a
scale of 0 to 10, with 0 and 10
representing the minimum and
maximum average quarterly
prices occurring during the past
10 years
• The positions demonstrate the
current price level of each metal
with respect to their various
historical price points over the
past 10 years
Nb
10. 10
AMG Business Segments
AMG CRITICAL MATERIALS
AMG’S CONVERSION, MINING,
AND RECYCLING BUSINESSES
• VANADIUM
• SUPERALLOYS
• TITANIUM ALLOYS & COATINGS
• ALUMINUM ALLOYS
• TANTALUM & NIOBIUM
• ANTIMONY
• GRAPHITE
• SILICON
AMG ENGINEERING
AMG’S VACUUM SYSTEMS AND
SERVICES BUSINESS
• ENGINEERING
• HEAT TREATMENT SERVICES
12. 12
12
AMG Global Footprint – Engineering
Mexico City,
MEXICO
Port Huron
(MI), USA
Berlin,
GERMANY
Limbach,
GERMANY
Mumbai,
INDIA
Suzhou,
CHINA
Wixom
(MI), USA
Grenoble,
FRANCE
Headquarters Production Facility Heat Treatment Services
Hanau,
GERMANY
Head Office
13. 13
Health and Safety Focus
LEADING SAFETY INDICATORS
• The number of safety improvement items reported increased by
38% compared to the 12 month period ending June 2015. These
are essential in order to avoid potential injuries.
• Incident severity rate over the 12 months ending June 2016 is
down 9% from the previous 12 month period.
• Days away from work resulting from these lost time incidents are
down 7%.
RIGOROUS COMMITMENT
TO SAFETY REFLECTED IN
CONTINUALLY IMPROVING
SAFETY RECORDS
PERIOD ENDING
JUNE
LOST TIME
INCIDENTS
IN THE LAST 12
MONTHS
12 MONTH
AVERAGE LOST
TIME INCIDENT
RATE
12 MONTH
AVERAGE
INCIDENT
SEVERITY RATE
2015 35 1.29 0.15
2016 36 1.33 0.14
15. 15
AMOUNTS IN $M
(EXCEPT EARNINGS PER SHARE)
Q2 2016 Q2 2015
%
CHANGE
REVENUE $248.3 $257.4 (4%)
GROSS PROFIT $53.8 $44.6 20%
GROSS MARGIN % 21.6% 17.3% 25%
PROFIT BEFORE INCOME TAXES $15.6 $8.3 88%
EBITDA $26.0 $25.1 4%
EBITDA MARGIN % 10.5% 9.8% 7%
NET DEBT $6.2 $41.9 (85%)
RETURN ON CAPITAL EMPLOYED
(ROCE)
17.8% 15.7% 13%
NET INCOME ATTRIBUTABLE TO
SHAREHOLDERS
$13.4 $3.8 253%
EARNINGS PER SHARE 0.48 0.14 243%
Q2 2016 at a Glance
• Q2 ‘16 EBITDA up 4% versus Q2
‘15 due to improved profitability
within AMG Engineering
• Annualized ROCE increased to
17.8% versus 15.7% in Q2 2015
• Q2 ‘16 revenue declined by $9
million, or 4%, compared to Q2
‘15, driven largely by weak metal
prices
• Net debt: $6.2 million
– $35.7 million reduction of net
debt since Q2 2015
– Net debt to LTM EBITDA: 0.08x
INCREASES IN EARNINGS
PER SHARE OF 243%,
COMPARED TO Q2 2015
16. 16
$25.1
$20.4
$9.7
$21.2
$26.0
Q2 15 Q3 15 Q4 15 Q1 16 Q2 16
$257.4
$241.9
$220.8 $237.4
$248.3
Q2 15 Q3 15 Q4 15 Q1 16 Q2 16
$44.6
$39.7
$32.4
$44.3
$53.8
Q2 15 Q3 15 Q4 15 Q1 16 Q2 16
Financial HighlightsFinancial Highlights
REVENUE (IN MILLIONS OF US DOLLARS)
EBITDA (IN MILLIONS OF US DOLLARS)
GROSS PROFIT (IN MILLIONS OF US DOLLARS)
4%
YoY 20%
YoY
$81.8
$67.4
$48.0 $50.5
$92.8
Q2 15 Q3 15 Q4 15 Q1 16 Q2 16
ORDER INTAKE (IN MILLIONS OF US DOLLARS)
4%
YoY
13%
YoY
17. 17
IMPROVE
ROCE
IMPROVE
GROSS
MARGIN
• Increase ROCE through operational
improvements and disciplined capital
management
• Increase productivity through continuous
cost and product mix optimization
2016 Financial Objectives
FINANCIAL OBJECTIVE DESCRIPTION
PURSUE GROWTH
OPPORTUNITIES
MAINTAIN
CONSERVATIVE
BALANCE
SHEET
• Optimize capital structure for financial
flexibility
PROGRESS UPDATE
• Net debt down by $35.7 million, or 85%,
versus the end of Q2 2015
• Completed enlargement and extension of
syndicated credit facility - from $320 million
to $400 million with the maturity extended
from May 2018 to July 2021
• On July 20th, 2016, AMG’s Supervisory
Board approved the construction of a lithium
concentrate (spodumene) plant at the Mibra
mine in Brazil, with an initial annual
production of 90,000 tons, expandable to
140,000 tons
• Annualized ROCE increased to 17.8% in the
second quarter 2016, as compared to
15.7% in the second quarter 2015
• AMG gross margin increased to 21.6% in
Q2 2016 from 17.3% in Q2 2015
• Pursue organic opportunities in high-growth
areas within the existing product portfolio
• Pursue opportunities for horizontal and
vertical industry consolidation across
AMG’s critical materials portfolio
18. 18
Financial Data: ROCE & EBITDA
• Q2 ‘16 EBITDA up 4% versus
Q2 ’15 due to improved
profitability within AMG
Engineering
• Q2 2016 annualized ROCE
improved to 17.8% from 15.7%
in Q2 2015
• ROCE improvements are the
result of efficient use of capital
and improved profitability
ANNUALIZED ROCE
EBITDA (IN MILLIONS OF US DOLLARS)
$25.1
$20.4
$9.7
$21.2
$26.0
Q2 '15 Q3 '15 Q4 '15 Q1 '16 Q2 '16
Q2 ‘16 ROCE
IMPROVED TO
17.8% FROM
15.7% IN Q2 ‘15
Q2 ‘16 EBITDA
UP 4% VERSUS
Q2 ‘15
9.2%
7.4%
11.9% 12.0%
15.7%
17.8%
2012 2013 2014 2015 Q2 '15 Q2 '16
19. 19
$194.2
$160.5
$87.8
$41.9
$6.2
2012 2013 2014 Q2 '15 Q2 '16
-$10
$5
$20
$35
$50
Q1 Q2 Q3 Q4
2012 2013 2014 2015 2016
Financial Data: Net Debt & Operating Cash flowFinancial Data: Net Debt & Operating Cash Flow
• Net debt: $6.2 million
– $188.0 million reduction of net debt
since December 31, 2012
– Net Debt to LTM EBITDA:
0.08x
• AMG’s primary debt facility is a $400
million multicurrency term loan and
revolving credit facility
– 5 year term (until 2021) with an
accordion feature that allows the
Company, subject to certain
conditions, to increase the
commitment amount by up to $100
million
– In compliance with all debt
covenants
• Q2 ‘16 cash flows from operating
activities were $24.3M
• Cash flows from the first half of 2016
exceeded those from the first half of
2015 by 33%
NET DEBT (IN MILLIONS OF US DOLLARS)
OPERATING CASH FLOW (IN MILLIONS OF US DOLLARS)
$188M
REDUCTION IN
NET DEBT SINCE
2012
H1 2016 CASH
FLOW 33%
HIGHER THAN
H1 2015
22. 22
$201.2
$187.7
$166.3
$176.6 $181.6
$21.0
$15.5
$7.0
$16.5
$20.5
Q2 2015 Q3 2015 Q4 2015 Q1 2016 Q2 2016
Revenue EBITDA
$2.8
$4.8
$10.0
$4.5
$6.2
Q2 2015 Q3 2015 Q4 2015 Q1 2016 Q2 2016
Financial Data: Net Debt & Operating Cash flowAMG Critical Materials
REVENUE & EBITDA (IN MILLIONS OF US DOLLARS)
CAPITAL EXPENDITURES (IN MILLIONS OF US DOLLARS)
Q2 2016 REVENUE
IMPACTED BY
WEAK METALS
PRICES
INCREASE OF $3.4M
Q2 ‘16 VS. Q2 ’15
DUE TO EXPANSION
PROJECTS AND AMG
ENGINEERING
RELOCATION
• Q2 2016 revenue down $19.6
million, or 10%, vs. Q2 2015
due to double-digit declines in
average quarterly prices of
Nickel, Aluminum, Chrome,
Niobium and Antimony
• Q2 ‘16 EBITDA margin
increased to 11.3% from 10.4%
in Q2 ‘15.
• Capital expenditures increased
to $6.2 million in Q2 2016
compared to $2.8 million in Q2
2015
• The largest capital expansion
projects are AMG’s Ancuabe
graphite mine project and AMG
TAC’s titanium aluminide
expansion
23. 23
KEY PRODUCT
Q2 ‘16 REV
($M)
Q2 ‘15
REV ($M)
VOLUME PRICE CURRENCY
FeV & FeNiMo $22.8 $28.1
Al Master Alloys
& Powders
$43.0 $45.7
Chromium
Metal
$19.9 $20.5
Tantalum &
Niobium
$17.2 $23.8
Titanium Alloys
& Coatings
$21.1 $21.2
Antimony $19.0 $24.9
Graphite $16.4 $14.9
Silicon Metal $22.4 $22.1
AMG Critical Materials – Quarterly Revenue Drivers
• Double-digit declines in the
average quarterly prices of
Nickel, Aluminum, Chrome,
Niobium and Antimony
negatively affected revenue in
the second quarter of 2016
• Strong sales volumes of Aluminum
Master Alloys & Powders,
Titanium Alloys & Coatings, and
Graphite were partially offset by
lower sales of Niobium and
Antimony
• AMG’s ferrovanadium sales prices
are indexed to the prior month’s
average market price
25. 25
$56.3 $54.1 $54.6
$60.8
$66.7
$4.2 $4.9
$2.6
$4.6
$5.6
Revenue EBITDA
$81.8
$67.4
$48.0 $50.5
$92.8
Q2 2015 Q3 2015 Q4 2015 Q1 2016 Q2 2016
Financial Data: Net Debt & Operating Cash flowAMG Engineering
REVENUE & EBITDA (IN MILLIONS OF US DOLLARS)
ORDER INTAKE (IN MILLIONS OF US DOLLARS)
EBITDA
IMPROVEMENT DUE
TO HIGHER SALES
AND LOWER
COSTS
BOOK TO BILL
RATIO OF 1.39X IN
Q2 2016
• Q2 2016 revenue up 19% vs.
Q2 2015 due to strong sales of
plasma remelting furnaces for
the aerospace market
• EBITDA increased by $1.4
million in Q2 2016 versus Q2
2015, the highest quarterly
EBITDA in twelve quarters due
to higher levels of gross profit
• AMG Engineering Order
backlog of $158.8 million as of
June 30, 2016, a 17% increase
versus March 31, 2016
• AMG Engineering signed $92.8
million in new orders during the
second quarter of 2016, a 1.39x
book to bill ratio
27. 27
AMG: Ready for Growth
2012 2013 2014 2015 2016 to 2020
Cost Reduction
Product Mix Optimization
Supply Chain Excellence
Targeted W/C & Debt Levels
Scaling Profitable Growth
Cost-reduction and
capex discipline in
response to global
economic slowdown
Competitive advantage
through manufacturing
and supply chain
excellence, accelerating
cost-reduction efforts
Properly positioned,
financially and
operationally, to pursue
growth targets across
portfolio
Streamlined operations
and improved operating
performance by
eliminating low-margin
product lines
Further reduction in
both working capital
and net debt,
strengthening the
balance sheet
28. 28
28
Strategy
AMG’s overriding strategic objective is to achieve industry leadership while being
the low cost producer
INDUSTRY
CONSOLIDATION
PROCESS
INNOVATION
& PRODUCT
DEVELOPMENT
Pursue opportunities for horizontal and vertical industry consolidation
across AMG’s critical materials portfolio
Continue to focus on process innovation and product development to
improve the market position of AMG’s businesses
AMG’s strategy is to build its critical materials business through industry consolidation,
process innovation and product development
EXPANSION OF
EXISTING HIGH
GROWTH
BUSINESSES
Pursue opportunities in high-growth areas within the existing product
portfolio
29. 29
29
2016 Outlook
In this challenging environment, AMG will continue to reduce cost, optimize its
product portfolio and maintain a conservative balance sheet
AMG
AMG
ENGINEERING
In this challenging market environment, AMG expects 2016 full year
profitability to improve relative to 2015. AMG will also continue to generate
strong operating cash flows throughout the year.
AMG Engineering expects to return to historic levels of profitability in 2016.
Based on the strong order backlog at the end of 2015, and improved cost
position, management expects the business to continue to improve its
financial performance in 2016.
AMG CRITICAL
MATERIALS
Despite weak metals prices, AMG Critical Materials expects 2016 full year
profitability to improve relative to 2015.
CHANGE IN
DIVIDEND POLICY
The change in AMG’s dividend policy reflects a commitment to return value to
shareholders and is a result of an improved balance sheet, ample liquidity and
confidence in our ability to generate cash.
35. 35
AMG IS A GLOBAL SUPPLIER OF CRITICAL MATERIALS TO:
MARKET LEADING PRODUCER OF HIGHLY ENGINEERED SPECIALTY METALS
AND VACUUM FURNACE SYSTEMS
~3,000
Employees
~$1 billion
Annual Revenues
At the forefront of
CO2 Reduction
Q2 2016 REVENUE
AMG at a Glance
TRANSPORTATIONENERGY INFRASTRUCTURE SPECIALTY METALS
AND CHEMICALS
BY END MARKET: BY REGION:BY SEGMENT:
44% Europe
32% North America
20% Asia
4% ROW
27% Engineering
73% Critical
Materials
22% Infrastructure
23% Specialty Metals
& Chemicals
39% Transportation
16% Energy
37. 37
AS AT
IN MILLIONS OF US DOLLARS
JUNE 30, 2016
UNAUDITED
DECEMBER 31, 2015
Fixed assets 211.9 215.8
Goodwill and intangibles 33.7 28.9
Other non-current assets 71.0 70.2
Inventories 131.4 126.4
Receivables 143.2 124.3
Other current assets 37.2 29.3
Cash 125.1 127.8
TOTAL ASSETS 753.4 722.7
TOTAL EQUITY 166.4 153.6
Long term debt 118.3 112.2
Employee benefits 136.7 137.9
Other long term liabilities 63.8 69.8
Current debt 13.0 14.5
Accounts payable 129.4 108.0
Advance payments 41.5 44.2
Accruals 43.9 42.9
Other current liabilities 40.5 39.6
TOTAL LIABILITIES 587.1 569.1
TOTAL EQUITY AND LIABILITIES 753.4 722.7
Consolidated Balance Sheet
38. 38
FOR THE SIX MONTHS ENDED
IN MILLIONS OF US DOLLARS
JUNE 30, 2016
UNAUDITED
JUNE 30, 2015
UNAUDITED
Revenue 485.7 514.4
Cost of sales 387.7 426.5
Gross profit 98.0 87.9
Selling, general & administrative 66.1 63.0
Restructuring & environmental 0.5 1.4
Other income, net (0.4) (0.1)
Operating profit 31.9 23.7
Net finance costs 5.2 7.4
Share of profit of associates 1.4 0.2
Profit before income taxes 28.2 16.5
Income tax expense 3.1 9.6
Profit for the period 25.1 6.9
Shareholders of the Company 25.4 6.5
Non-controlling interest (0.3) 0.4
ADJUSTED EBITDA 47.2 45.5
Consolidated Income Statement
39. 39
Consolidated Statement of Cash Flows
FOR THE SIX MONTHS ENDED
IN MILLIONS OF US DOLLARS
JUNE 30, 2016
UNAUDITED
JUNE 30, 2015
UNAUDITED
EBITDA 47.2 45.5
Change in working capital and deferred revenue (5.0) (15.5)
Finance costs paid, net (3.2) (6.9)
Other operating cash flow (15.3) (5.9)
Cash flows from operations before taxes 23.7 17.2
Income tax paid (3.7) (2.2)
Net cash flows from operations 20.0 15.1
Capital expenditures (14.4) (7.0)
Other investing activities (4.9) 0.8
Net cash flows used in investing activities (19.3) (6.2)
Net cash flows (used in) from financing activities (3.7) 25.4
Net (decrease) increase in cash and equivalents (3.0) 34.3
Cash and equivalents at January 1 127.8 108.0
Effect of exchange rate fluctuations on cash held 0.3 (5.2)
CASH AND EQUIVALENTS AT JUNE 30 125.1 137.1