The document is an investor presentation by AMG Advanced Metallurgical Group N.V. It provides an overview of AMG's business segments which involve sourcing, processing, and supplying critical raw materials. It discusses AMG's focus on enabling technologies to reduce CO2 emissions and highlights several critical raw materials in its portfolio. The presentation also provides financial highlights such as revenue, EBITDA, gross profit and net debt figures for fiscal years 2015-2016 showing overall growth. It outlines AMG's strategic goals of improving return on capital employed, gross margins, and pursuing growth opportunities while maintaining a conservative balance sheet.

![9
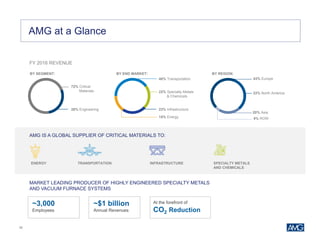
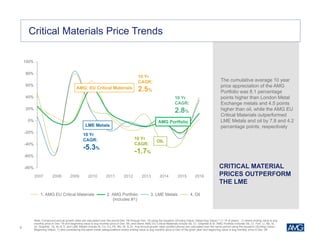
Critical Materials Prices: 10 Year Perspective
AMG has significant
potential upside within
certain critical materials
based on historical price
ranges
Note: Metal Positions are measured on a scale of 0 to 10, with 0 being the minimum price and 10 being the maximum price. They are calculated using the formula [(Dec ‘06 month avg –
min. monthly avg) / (max. monthly avg – min. monthly avg) *10] where maximum and minimum monthly averages are measured over the period 1 Dec ‘06 through 31 Dec ‘16.
1.8
0.8 0.7
1.7
2.5 2.3
0.9
3.6
5.8
0.3
2.62.6
0.2 0.2 0.2
3.8
1.2
2.2
4.7
5.8
0.0
0.8
0
2.5
5
7.5
10
Scale
Metals
Dec 2016 Position Dec 2015 Position
Cr Mo Ni FeV Ti Al C Si Ta Sb
Highest
Price in
10 years
Lowest
Price in
10 years
[unchanged]
• Metal prices are measured on a
scale of 0 to 10, with 0 and 10
representing the minimum and
maximum average quarterly
prices occurring during the past
10 years
• The positions demonstrate the
current price level of each metal
with respect to their various
historical price points over the
past 10 years
Nb](https://image.slidesharecdn.com/amginvestorpresentationmarch2017final-170309135756/85/AMG-Investor-Presentation-March-2017-9-320.jpg)