Downloaded 247 times

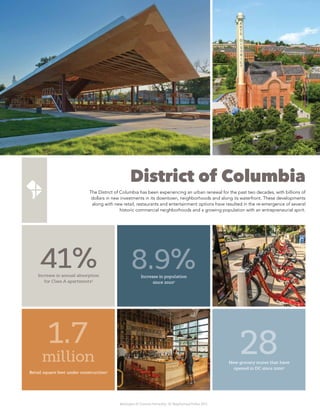
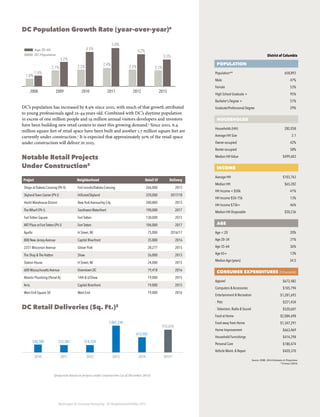
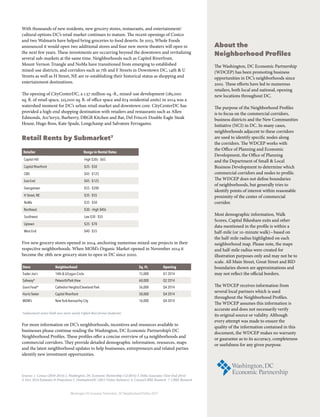


The 2015 DC Neighborhood Profiles report highlights ongoing urban renewal in Washington, DC, marked by an 8.9% population increase since 2010, new retail developments, and a growing entrepreneurial spirit. Key projects include significant investments in mixed-use developments like CityCenterDC and various new grocery stores aimed at revitalizing food deserts. The report also outlines partnerships and incentives aimed at promoting economic growth and development in DC's neighborhoods.


