This document provides an overview of a business simulation for managing a sensor company. It covers the following key points in 3 sentences:
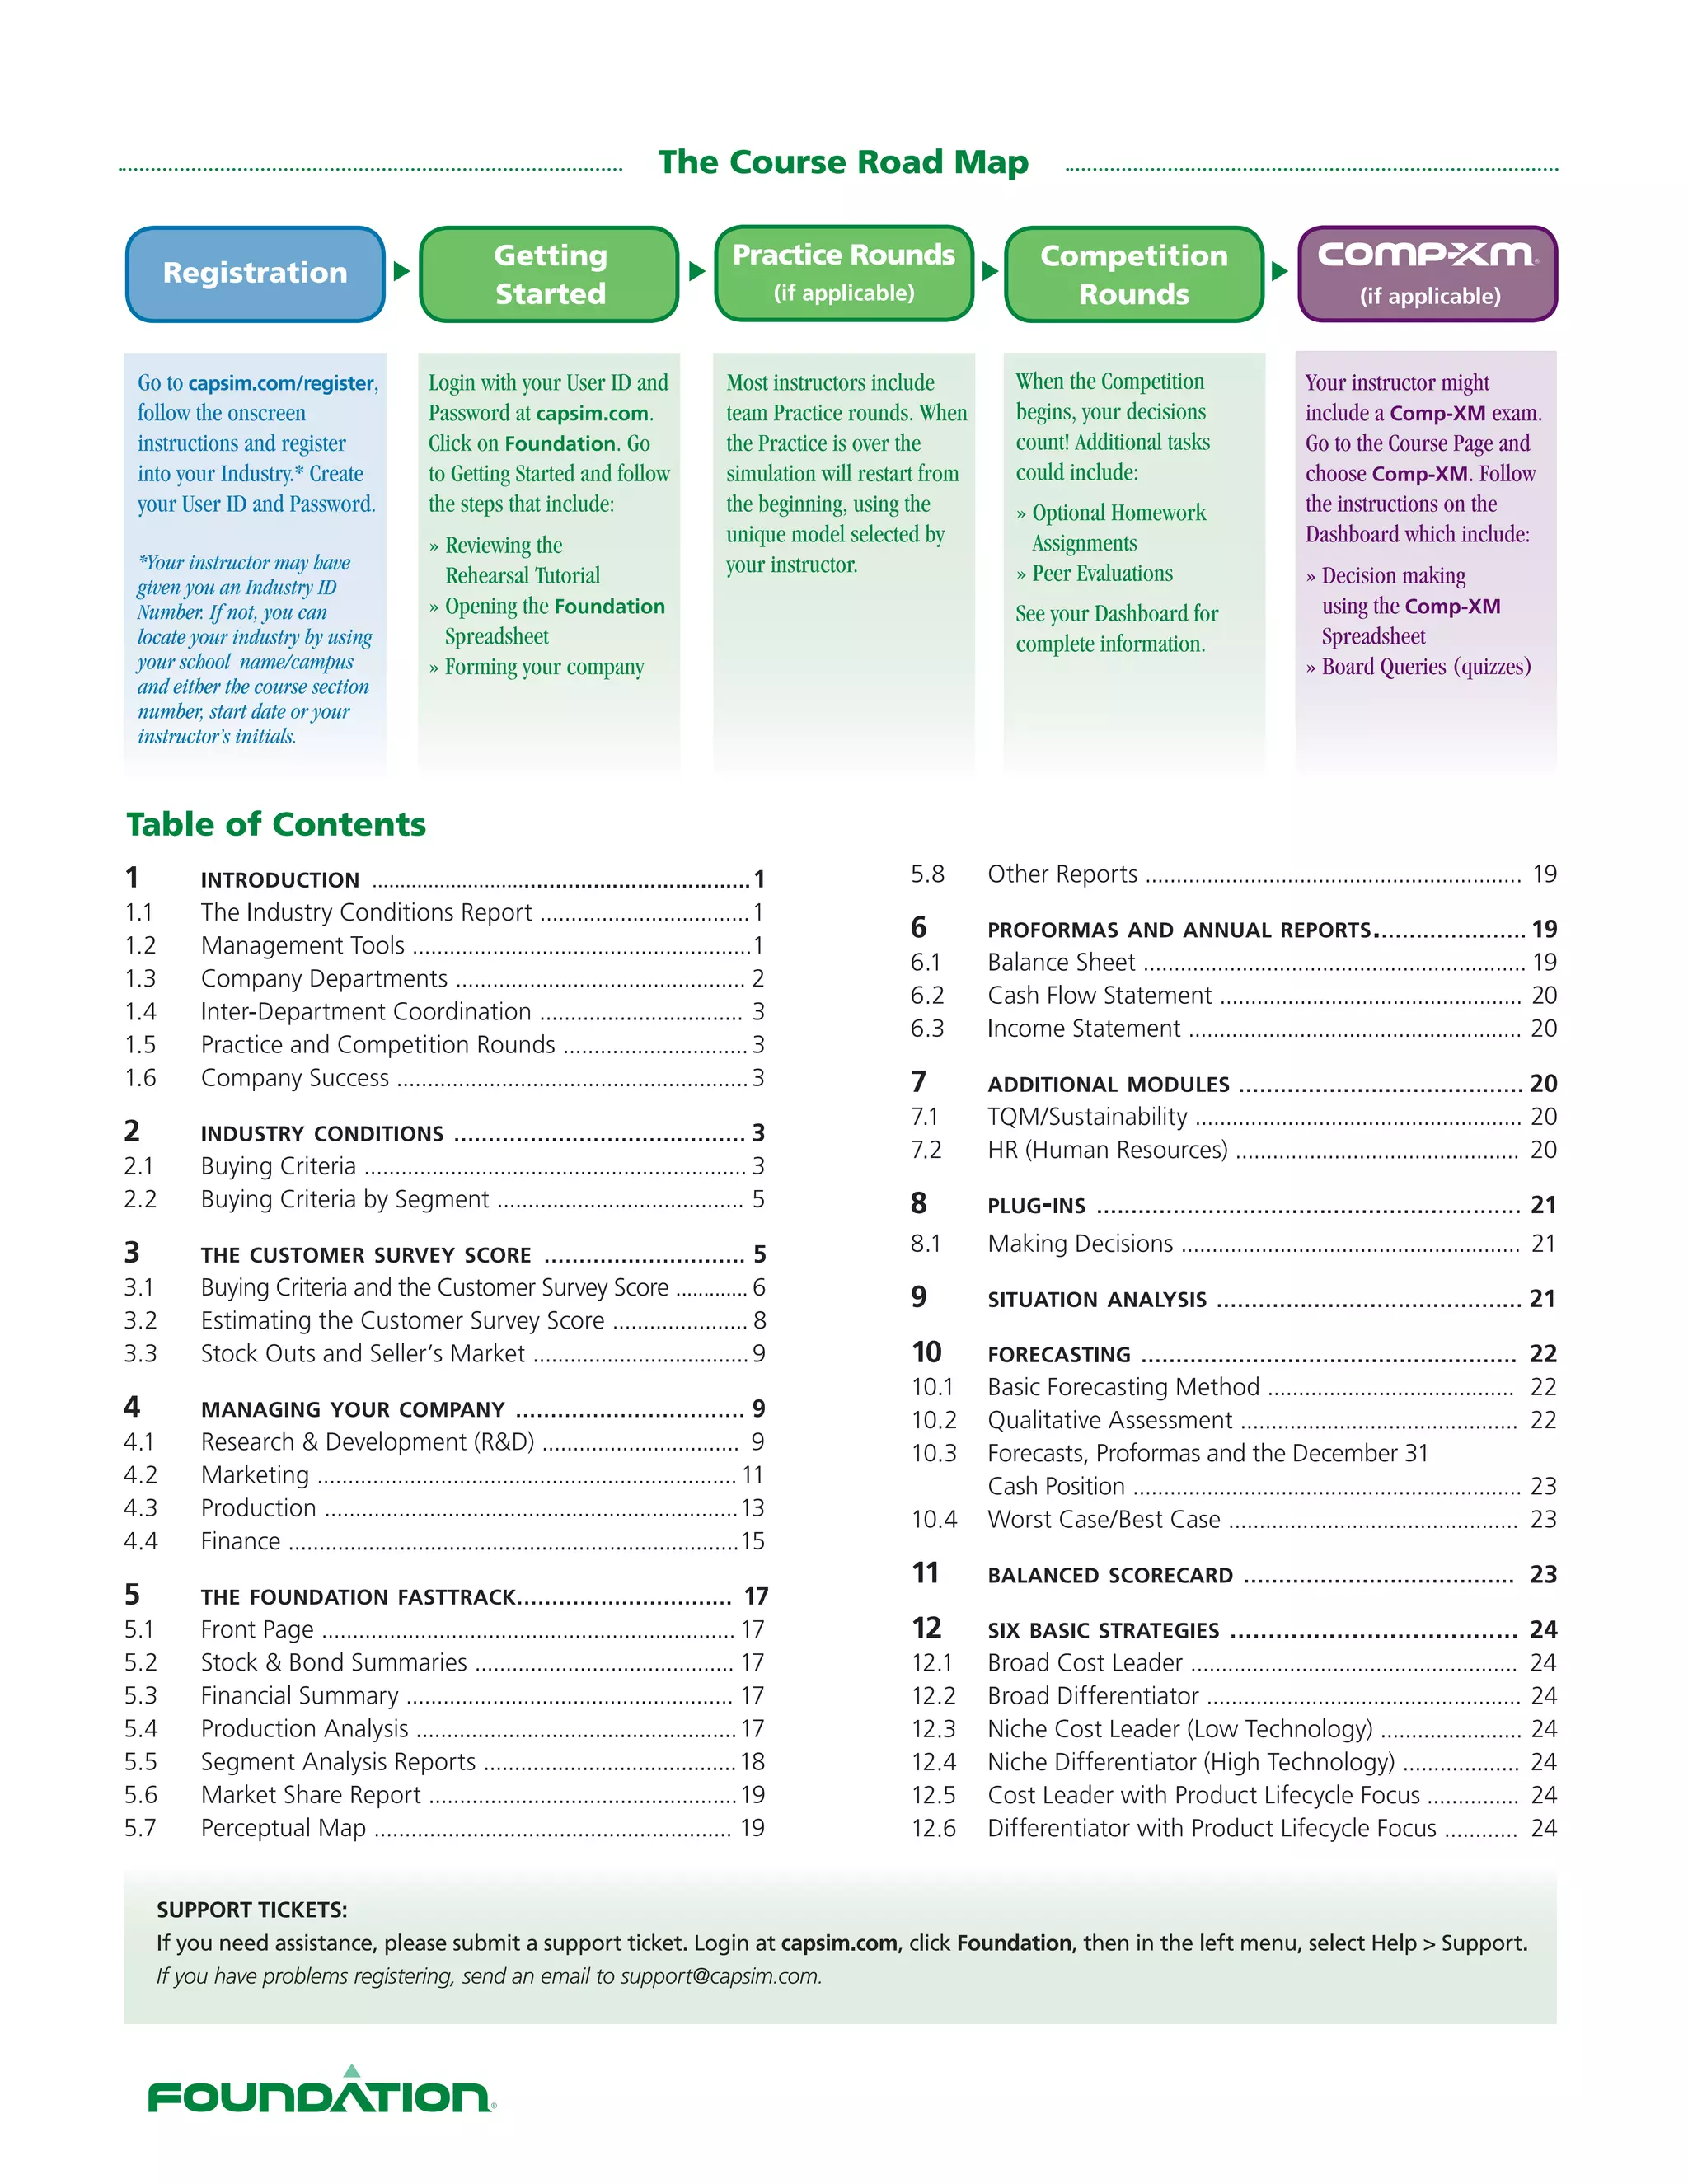
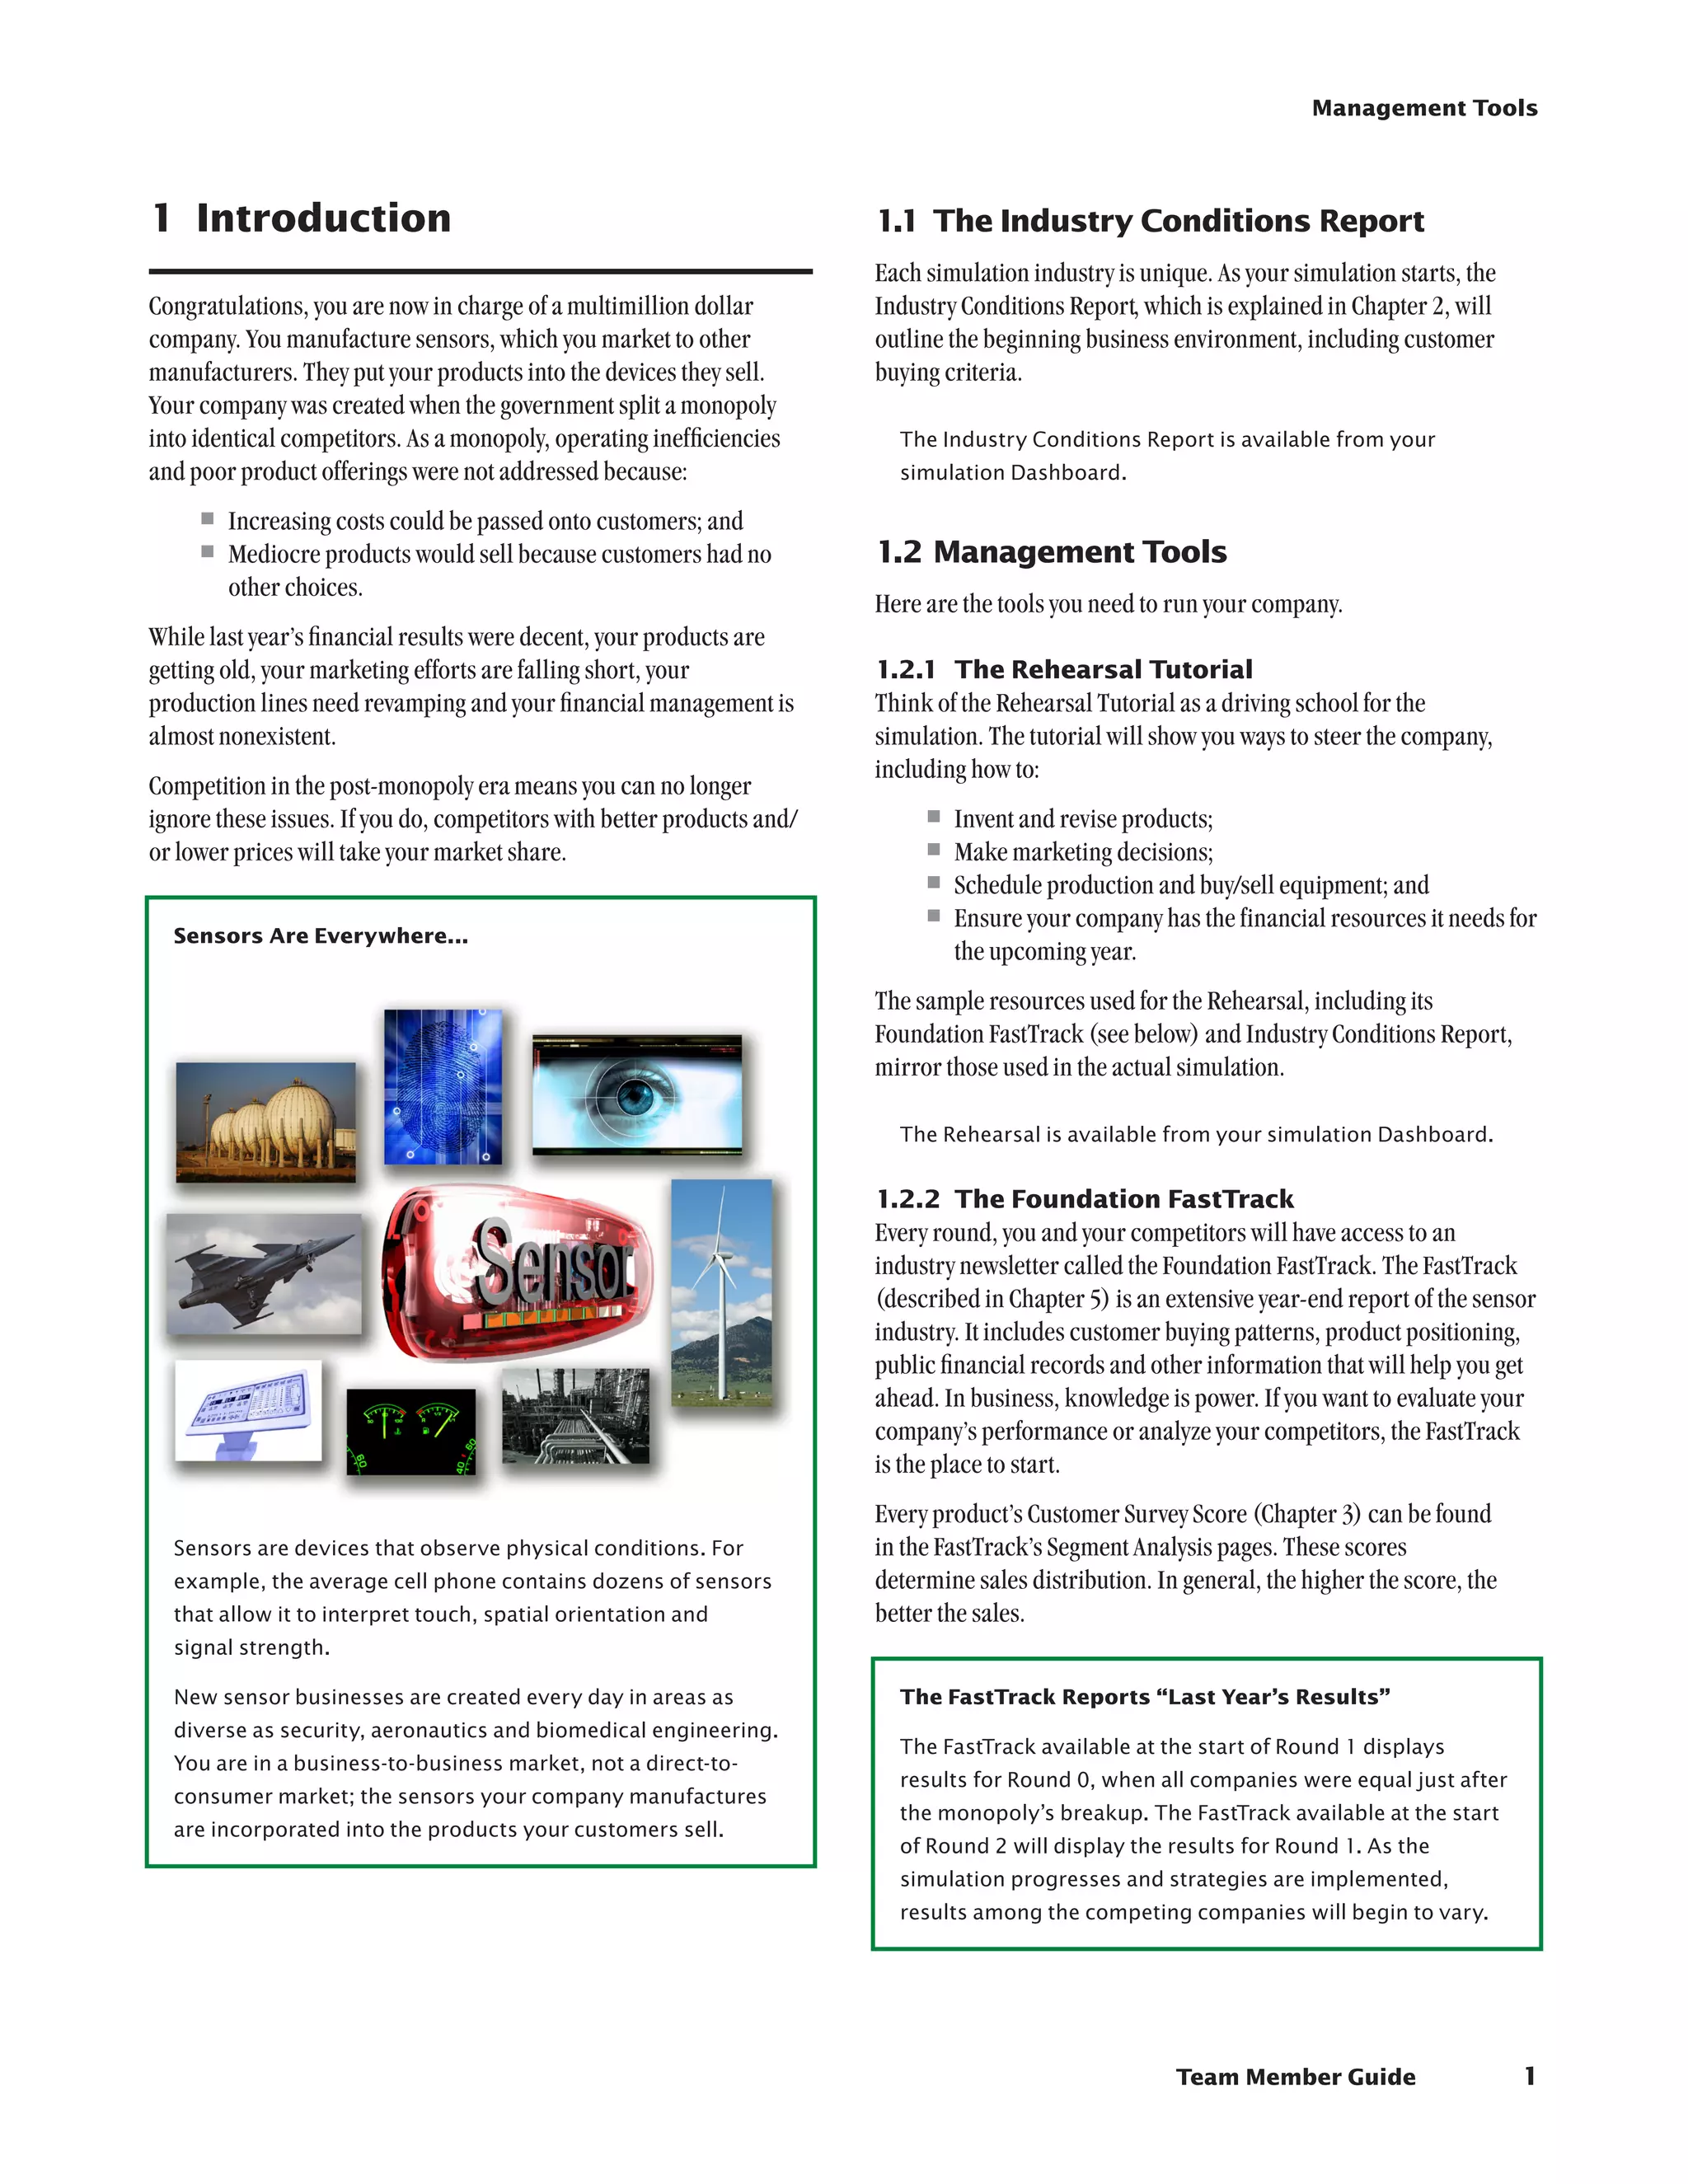
The simulation guides students through registering their company, making management decisions across departments like R&D, marketing, production and finance, and competing over multiple rounds against other student-run companies. Key tools provided include an industry report on customer segments and needs, a company dashboard to access reports and make decisions, and a spreadsheet to coordinate cross-departmental planning. The goal is to analyze market conditions, develop an effective strategy, and drive the company to become a profitable leader in the sensor industry through coordinated management decisions over multiple simulated years.