Presentation by ERIA's Senior Policy Fellow, Tan Sri Dr Rebecca Fatima Sta Maria, former Secretary General of Malaysia's Ministry of International Trade and Industry. In this presentation, Dr Rebecca talks about ASEAN's path towards an integrated region and community, the opportunities and challenges faced by ASEAN Economic Community (AEC), as well as ASEAN Centrality.
About the establishment, ASEAN Economic Community (AEC), free trade agreement and positive as well as negative impact of ASEAN in International Business viewpoints.
By Swikar Dahal
Association of Southeast Asian Nations
Disclaimer:
All of the pictures and pieces of information on this site are the property of their respective owners. I do not hold any copyright in regards to these pictures and information. These pictures have been collected from different public sources including various websites, considered to be in the public domain. If anyone has any objection to display of any picture, image or information, it may be brought to my notice by sending an email (contact me) & the disputed media will be removed immediately, after verification of the claim.
This infographic details the key dates in the Association of Southeast Asian Nations (ASEAN) history leading up to the 2015 ASEAN Economic Community (AEC) integration.
The establishment and implementation of the ASEAN Economic Community (AEC) in 2015 is a major milestone in the regional economic integration agenda in ASEAN. it offers opportunities in the form of a huge market of US$2.6 trillion and over 622 million people. In 2014, AEC was collectively the third largest economy in Asia and the seventh largest in the world.
The AEC Blueprint 2025, adopted by the ASEAN Leaders at the 27th ASEAN Summit on 22 November 2015 in Kuala Lumpur, Malaysia, provides broad directions through strategic measures for the AEC from 2016 to 2025. Along with the ASEAN Community Vision 2025, and the ASEAN Political-Security Community (APSC) Blueprint 2025 and the ASEAN Socio-Cultural Community (ASCC) Blueprint 2025, the AEC Blueprint 2025 forms part of ASEAN 2025: Forging Ahead Together. It succeeded the AEC Blueprint (2008-2015), which was adopted in 2007.
The role of LABUAN in the ASEAN Economic Community 2015Stephen Ong
This policy study discusses the role of Labuan in the new ASEAN Economic Community 2015 onwards as an international financial centre and offshore tax haven that allows money laundering of Malaysia's elites and tax evading crony capitalists...
Quarterly newsletter with information on economic cooperation and integration in Asia from the GIZ programme Regional Economic Cooperation and Integration in Asia (RCI). In our newsletter we share information about our programme activities, and further input on the programme’s focus areas such as regionalism, trade facilitation and port cooperation in Asia.
THE IMPACT OF INTERNATIONAL TRADE DISCLOSURE IN THE SERVICE SECTOR ON ASEAN E...AJHSSR Journal
ABSTRACT : The service sector can be a driving force for the economy of a country by relying on human
resources owned by that country or from other countries. For example, countries that are members of ASEAN
can take advantage of the service sector to improve their economy by relying on the human resources of each
country and the human resources of the countries that are members of ASEAN. This research was conducted on
10 ASEAN members, namely Brunei Darrussalam, the Philippines, Indonesia, Cambodia, Laos, Malaysia,
Myanmar, Singapore, Thailand, and Vietnam. The type of data used is quantitative data in the form of secondary
data. Data collection is done through records or reports from relevant sources or agencies.
Keywords:export, import, GDP
FTAs in South-east Asia: Towards the next generation is the second in a series of reports sponsored by HSBC that examines Asian businesses’ attitude towards free trade agreements (FTAs) and usage of their provisions. The report is based in part on the findings of a survey conducted in the first quarter of 2014 that included 400 exporters from four countries in the Association of South-East Asian Nations (ASEAN)—Indonesia, Malaysia, Singapore and Vietnam—representing a range of industries.
Among its key findings, the report examines how the low usage rate of FTAs among ASEAN exporters is connected to the issue that many existing FTAs are “unambitious”—that is, they rarely go beyond simple tariff cutting to address issues such as trade in services, e-commerce, intellectual property rights, customs cooperation and other regulations that hinder trade—which means companies see limited upside in using them.
Consequently many ASEAN businesses have high hopes for the next generation of “mega-regional” pacts now under negotiation, including the Trans-Pacific Partnership (TPP), and the formation of the ASEAN Economic Community in 2015.
The report also finds that the liberalisation of trade in services is crucial to economic growth in the region. As supply chain fragmentation across ASEAN increases, trade becomes increasingly dependent on logistical, legal, financial and other services, which account for an increasingly large proportion of the value of goods shipped across borders. Better access to quality services would also help businesses expand into other markets.
Quarterly newsletter with information on economic cooperation and integration in Asia from the GIZ programme Regional Economic Cooperation and Integration in Asia (RCI). In our newsletter we share information about our programme activities, and further input on the programme’s focus areas such as regionalism, trade facilitation and port cooperation in Asia.
Britain’s two-party system is being eroded by an unprecedented surge of support for smaller parties. This Bloomberg Brief report examines the implications of the most uncertain general election in a generation.
London Dine & Wine- A Bloomberg Brief Special Supplement Bloomberg Briefs
Discover the capital's secrets in Bloomberg Brief's special supplement London Dine & Wine. Inside you will find London's 10 most important restaurants for visitors, sommelier tips for picking a good wine, and much more.
To learn more about the Bloomberg Brief Newsletters and Supplements please visit:
http://www.bloombergbriefs.com/
Welcome to the latest edition of Bloomberg Brief: Real Estate focused on the main trends in the residential and commercial markets. In this issue, former FDIC Chief William M. Isaac explains how the latest recovery differs from prior cycles and why the home price rebound has been muted. Fannie Mae’s Tom Seidenstein and Steve Deggendorf outline their expectations for credit standards in residential housing finance, and Bloomberg economist Josh Wright explains why MBS spreads won’t widen much as the Fed reins in purchases and housing agencies trim portfolios.
Then there are what Michelle Meyer, economist at Bank of America Merrill Lynch, refers to as the “Boomerang Borrowers.” These former homeowners who lost houses through a foreclosure or short sale and want to return as owners are finding that credit is harder to get. This in turn could have an impact on demand for new and existing homes. As Meyer points out, nearly 17 percent of all homeowners with a mortgage in 2006 fell into either foreclosure or short sale.
On the residential and commercial real estate finance side, the picture continues to improve. Financing costs for office and retail property borrowers have dropped thanks to lower AAA- and BBB-rated CMBS spreads. Some of the narrowing in CMBS spreads is tied to demand from investors looking for extra yield at a time when U.S. Treasury 10-year debt yields 2.36 percent and the 30-year yields just over 3 percent.
The yield hunt may also explain lower CMBS issuance. According to Jefferies’ Lisa Pendergast, a greater number of investors financed commercial property purchases and retained the loans on their own balance sheets rather than sold them. This forced participants to cut expectations for 2014 CMBS issuance. The appetite to put money to work in commercial real estate finance shows up in other ways, notably heightened use of interest-only and partial IO loans. Just over half of the mortgages resold into CMBS so far this year allowed borrowers to pay just interest, or had partial-IO characteristics.
To receive future Bloomberg Brief Real Estate Supplements please visit- http://www.bloombergbriefs.com/real-estate/
An old-media kind of guy, I still keep file folders of stories, blog entries, clippings, messages and reports printed out and more or less sorted. Back in early 2009, I started a file labeled “Hysteria’’to hold the physical evidence of what I thought the most unusual and even outlandish claims being leveled against an asset class I have spent 33 years writing about —municipal bonds. - Joe Mysak, Bloomberg Brief Editor
This special supplement includes insight from leading economists and market observers about the future of home sales, what higher rates mean for affordability and what regulatory changes at the U.S. housing agencies will do to long-term fixed rate mortgages. Inside you will also find unique data on commercial mortgage issuance, CMBS loan leverage, mortgage delinquencies and commercial property cap rates, as well as insight into real estate development in Manhattan.
Reporting requirements for over-the-counter derivatives trades go into effect on Feb. 12 under the European Market Infrastructure Regulation. As companies prepare, they also look ahead to mandatory clearing and the reporting of valuation and collateral, which are set to begin in the third quarter.
Please find attached our complimentary copy of our Oil Buyer's Guide 2013 Review. This is just a sample of incredible content our subscribers receive each day. Visit bloombergbriefs.com for more information.
Please find attached our complimentary year end review from Bloomberg Brief Private Equity. This is just a sample of the incredible data available to our subscribers. Visit Bloombergbriefs.com for more information.
Please find attached our annual review with our compliments. This is a sample of the high quality content our subscribers receive each week. Take your free trial at bloombergbriefs.com
Bloomberg Brief produces high quality financial newsletters. Attached is our year end / outlook for Economics with our compliments. Our newsletters are subscription only but you can take a trial via our website bloombergbriefs.com
Please also find attached our Real Estate Supplement. In it you will read about how issuance of bonds backed by commercial properties is on track to beat last year's supply and yield premiums for bonds backed by commercial property loans have narrowed. Also, Jefferies CMBS veteran Lisa Pendergast says she expects CMBS spreads to narrow by year end, while Fannie Mae economists Douglas Duncan and Patrick Simmons argue that a slowdown in the growth of the labor force suggests more modest prospects for the demand for new housing and construction. Emile J. Brinkmann, the chief economist of the Mortgage Bankers Association of America, probes how state regulations will affect the pace of foreclosures and delinquencies. Nicolas Retsinas of Harvard’s Joint Center for Housing has some advice for lawmakers on GSE reform and Donald Trump offers a characteristically confident view that the recovery in real estate. If you have any comments or feedback for future real estate issues please contact arozens@bloomberg.net.
Discover the innovative and creative projects that highlight my journey throu...dylandmeas
Discover the innovative and creative projects that highlight my journey through Full Sail University. Below, you’ll find a collection of my work showcasing my skills and expertise in digital marketing, event planning, and media production.
Unveiling the Secrets How Does Generative AI Work.pdfSam H
At its core, generative artificial intelligence relies on the concept of generative models, which serve as engines that churn out entirely new data resembling their training data. It is like a sculptor who has studied so many forms found in nature and then uses this knowledge to create sculptures from his imagination that have never been seen before anywhere else. If taken to cyberspace, gans work almost the same way.
Putting the SPARK into Virtual Training.pptxCynthia Clay
This 60-minute webinar, sponsored by Adobe, was delivered for the Training Mag Network. It explored the five elements of SPARK: Storytelling, Purpose, Action, Relationships, and Kudos. Knowing how to tell a well-structured story is key to building long-term memory. Stating a clear purpose that doesn't take away from the discovery learning process is critical. Ensuring that people move from theory to practical application is imperative. Creating strong social learning is the key to commitment and engagement. Validating and affirming participants' comments is the way to create a positive learning environment.
RMD24 | Retail media: hoe zet je dit in als je geen AH of Unilever bent? Heid...BBPMedia1
Grote partijen zijn al een tijdje onderweg met retail media. Ondertussen worden in dit domein ook de kansen zichtbaar voor andere spelers in de markt. Maar met die kansen ontstaan ook vragen: Zelf retail media worden of erop adverteren? In welke fase van de funnel past het en hoe integreer je het in een mediaplan? Wat is nu precies het verschil met marketplaces en Programmatic ads? In dit half uur beslechten we de dilemma's en krijg je antwoorden op wanneer het voor jou tijd is om de volgende stap te zetten.
Attending a job Interview for B1 and B2 Englsih learnersErika906060
It is a sample of an interview for a business english class for pre-intermediate and intermediate english students with emphasis on the speking ability.
"𝑩𝑬𝑮𝑼𝑵 𝑾𝑰𝑻𝑯 𝑻𝑱 𝑰𝑺 𝑯𝑨𝑳𝑭 𝑫𝑶𝑵𝑬"
𝐓𝐉 𝐂𝐨𝐦𝐬 (𝐓𝐉 𝐂𝐨𝐦𝐦𝐮𝐧𝐢𝐜𝐚𝐭𝐢𝐨𝐧𝐬) is a professional event agency that includes experts in the event-organizing market in Vietnam, Korea, and ASEAN countries. We provide unlimited types of events from Music concerts, Fan meetings, and Culture festivals to Corporate events, Internal company events, Golf tournaments, MICE events, and Exhibitions.
𝐓𝐉 𝐂𝐨𝐦𝐬 provides unlimited package services including such as Event organizing, Event planning, Event production, Manpower, PR marketing, Design 2D/3D, VIP protocols, Interpreter agency, etc.
Sports events - Golf competitions/billiards competitions/company sports events: dynamic and challenging
⭐ 𝐅𝐞𝐚𝐭𝐮𝐫𝐞𝐝 𝐩𝐫𝐨𝐣𝐞𝐜𝐭𝐬:
➢ 2024 BAEKHYUN [Lonsdaleite] IN HO CHI MINH
➢ SUPER JUNIOR-L.S.S. THE SHOW : Th3ee Guys in HO CHI MINH
➢FreenBecky 1st Fan Meeting in Vietnam
➢CHILDREN ART EXHIBITION 2024: BEYOND BARRIERS
➢ WOW K-Music Festival 2023
➢ Winner [CROSS] Tour in HCM
➢ Super Show 9 in HCM with Super Junior
➢ HCMC - Gyeongsangbuk-do Culture and Tourism Festival
➢ Korean Vietnam Partnership - Fair with LG
➢ Korean President visits Samsung Electronics R&D Center
➢ Vietnam Food Expo with Lotte Wellfood
"𝐄𝐯𝐞𝐫𝐲 𝐞𝐯𝐞𝐧𝐭 𝐢𝐬 𝐚 𝐬𝐭𝐨𝐫𝐲, 𝐚 𝐬𝐩𝐞𝐜𝐢𝐚𝐥 𝐣𝐨𝐮𝐫𝐧𝐞𝐲. 𝐖𝐞 𝐚𝐥𝐰𝐚𝐲𝐬 𝐛𝐞𝐥𝐢𝐞𝐯𝐞 𝐭𝐡𝐚𝐭 𝐬𝐡𝐨𝐫𝐭𝐥𝐲 𝐲𝐨𝐮 𝐰𝐢𝐥𝐥 𝐛𝐞 𝐚 𝐩𝐚𝐫𝐭 𝐨𝐟 𝐨𝐮𝐫 𝐬𝐭𝐨𝐫𝐢𝐞𝐬."
Falcon stands out as a top-tier P2P Invoice Discounting platform in India, bridging esteemed blue-chip companies and eager investors. Our goal is to transform the investment landscape in India by establishing a comprehensive destination for borrowers and investors with diverse profiles and needs, all while minimizing risk. What sets Falcon apart is the elimination of intermediaries such as commercial banks and depository institutions, allowing investors to enjoy higher yields.
Enterprise Excellence is Inclusive Excellence.pdfKaiNexus
Enterprise excellence and inclusive excellence are closely linked, and real-world challenges have shown that both are essential to the success of any organization. To achieve enterprise excellence, organizations must focus on improving their operations and processes while creating an inclusive environment that engages everyone. In this interactive session, the facilitator will highlight commonly established business practices and how they limit our ability to engage everyone every day. More importantly, though, participants will likely gain increased awareness of what we can do differently to maximize enterprise excellence through deliberate inclusion.
What is Enterprise Excellence?
Enterprise Excellence is a holistic approach that's aimed at achieving world-class performance across all aspects of the organization.
What might I learn?
A way to engage all in creating Inclusive Excellence. Lessons from the US military and their parallels to the story of Harry Potter. How belt systems and CI teams can destroy inclusive practices. How leadership language invites people to the party. There are three things leaders can do to engage everyone every day: maximizing psychological safety to create environments where folks learn, contribute, and challenge the status quo.
Who might benefit? Anyone and everyone leading folks from the shop floor to top floor.
Dr. William Harvey is a seasoned Operations Leader with extensive experience in chemical processing, manufacturing, and operations management. At Michelman, he currently oversees multiple sites, leading teams in strategic planning and coaching/practicing continuous improvement. William is set to start his eighth year of teaching at the University of Cincinnati where he teaches marketing, finance, and management. William holds various certifications in change management, quality, leadership, operational excellence, team building, and DiSC, among others.
What is the TDS Return Filing Due Date for FY 2024-25.pdfseoforlegalpillers
It is crucial for the taxpayers to understand about the TDS Return Filing Due Date, so that they can fulfill your TDS obligations efficiently. Taxpayers can avoid penalties by sticking to the deadlines and by accurate filing of TDS. Timely filing of TDS will make sure about the availability of tax credits. You can also seek the professional guidance of experts like Legal Pillers for timely filing of the TDS Return.
Skye Residences | Extended Stay Residences Near Toronto Airportmarketingjdass
Experience unparalleled EXTENDED STAY and comfort at Skye Residences located just minutes from Toronto Airport. Discover sophisticated accommodations tailored for discerning travelers.
Website Link :
https://skyeresidences.com/
https://skyeresidences.com/about-us/
https://skyeresidences.com/gallery/
https://skyeresidences.com/rooms/
https://skyeresidences.com/near-by-attractions/
https://skyeresidences.com/commute/
https://skyeresidences.com/contact/
https://skyeresidences.com/queen-suite-with-sofa-bed/
https://skyeresidences.com/queen-suite-with-sofa-bed-and-balcony/
https://skyeresidences.com/queen-suite-with-sofa-bed-accessible/
https://skyeresidences.com/2-bedroom-deluxe-queen-suite-with-sofa-bed/
https://skyeresidences.com/2-bedroom-deluxe-king-queen-suite-with-sofa-bed/
https://skyeresidences.com/2-bedroom-deluxe-queen-suite-with-sofa-bed-accessible/
#Skye Residences Etobicoke, #Skye Residences Near Toronto Airport, #Skye Residences Toronto, #Skye Hotel Toronto, #Skye Hotel Near Toronto Airport, #Hotel Near Toronto Airport, #Near Toronto Airport Accommodation, #Suites Near Toronto Airport, #Etobicoke Suites Near Airport, #Hotel Near Toronto Pearson International Airport, #Toronto Airport Suite Rentals, #Pearson Airport Hotel Suites
Cracking the Workplace Discipline Code Main.pptxWorkforce Group
Cultivating and maintaining discipline within teams is a critical differentiator for successful organisations.
Forward-thinking leaders and business managers understand the impact that discipline has on organisational success. A disciplined workforce operates with clarity, focus, and a shared understanding of expectations, ultimately driving better results, optimising productivity, and facilitating seamless collaboration.
Although discipline is not a one-size-fits-all approach, it can help create a work environment that encourages personal growth and accountability rather than solely relying on punitive measures.
In this deck, you will learn the significance of workplace discipline for organisational success. You’ll also learn
• Four (4) workplace discipline methods you should consider
• The best and most practical approach to implementing workplace discipline.
• Three (3) key tips to maintain a disciplined workplace.
[Note: This is a partial preview. To download this presentation, visit:
https://www.oeconsulting.com.sg/training-presentations]
Sustainability has become an increasingly critical topic as the world recognizes the need to protect our planet and its resources for future generations. Sustainability means meeting our current needs without compromising the ability of future generations to meet theirs. It involves long-term planning and consideration of the consequences of our actions. The goal is to create strategies that ensure the long-term viability of People, Planet, and Profit.
Leading companies such as Nike, Toyota, and Siemens are prioritizing sustainable innovation in their business models, setting an example for others to follow. In this Sustainability training presentation, you will learn key concepts, principles, and practices of sustainability applicable across industries. This training aims to create awareness and educate employees, senior executives, consultants, and other key stakeholders, including investors, policymakers, and supply chain partners, on the importance and implementation of sustainability.
LEARNING OBJECTIVES
1. Develop a comprehensive understanding of the fundamental principles and concepts that form the foundation of sustainability within corporate environments.
2. Explore the sustainability implementation model, focusing on effective measures and reporting strategies to track and communicate sustainability efforts.
3. Identify and define best practices and critical success factors essential for achieving sustainability goals within organizations.
CONTENTS
1. Introduction and Key Concepts of Sustainability
2. Principles and Practices of Sustainability
3. Measures and Reporting in Sustainability
4. Sustainability Implementation & Best Practices
To download the complete presentation, visit: https://www.oeconsulting.com.sg/training-presentations
Exploring Patterns of Connection with Social Dreaming
Asean Integration 2015
1. December 2014 | www.bloombergbriefs.com
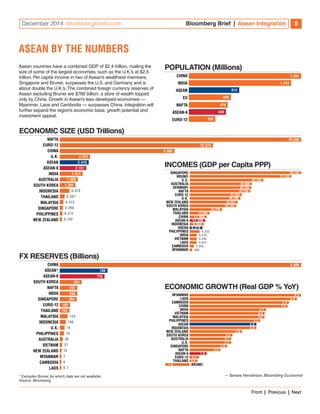
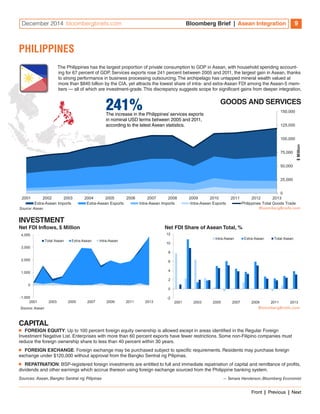
The Association of Southeast Asian Nations
has set Dec. 31, 2015 as its target date for
regional economic integration — including a
single market and production base with the
free movement of goods, services, investment
and skilled labor, and the freer flow of capital.
Bloomberg Brief assesses Asean’s progress
so far, with scorecards for member states and
a look back to similar endeavors in Europe
and North America. The Asian Development
Bank also provides a reality check on the
project with on-the-ground insights.
ASEAN
INTEGRATION 2015 A PROGRESS REPORT
2. December 2014 bloombergbriefs.com Bloomberg Brief | Asean Integration 2
TARGET 2015
Deliverables for next year. 3
ASEAN BY THE NUMBERS
How Asean stacks up against its peers. 5
BRUNEI
Scorecard of Asean’s top oil exporter. 6
INDONESIA
Scorecard of Asean’s largest population. 7
MALAYSIA
Scorecard of Asean’s largest local currency bond market. 8
PHILIPPINES
Scorecard of Asean’s largest household spender. 9
SINGAPORE
Scorecard of Asean’s richest member. 10
THAILAND
Scorecard of Asean’s automotive hub. 11
CLMV COUNTRIES
Scorecard of Asean’s newest members. 12
IMPLEMENTATION REALITY
Bloomberg Brief talks with Iwan Azis, head of the Asian
Development Bank’s Office of Regional Economic Integration. 13
INTEGRATION PRECEDENTS
Insight from the European Union and Nafta. 15
PROGRESS BENCHMARKS
How Asean is on track to reap the rewards of integration. 17
CONTENTS Front | Previous | Next
CONTRIBUTORS
TAMARA HENDERSON is a Ph.D econo-mist
with buy- as well as sell-side experi-ence,
covering G-3 economies and the
emerging markets over a span of 25 years.
She has focused on FX and rates strategy
over the past 12 years and has accumulated
a strong track record for her trade ideas. Ta-mara
is a CFA charterholder and the author
of ‘Fixed Income Strategy: A Practitioner’s
Guide to Riding the Curve,’ published by Wi-ley.
She contributes to the Economics Asia
Brief, which is a daily newsletter provided to
Bloomberg clients and subscribers.
IWAN AZIS has been a professor at
Cornell University since 1992 and was
director of graduate studies at the Regional
Science Program and adjunct professor at
the Johnson Graduate School of Manage-ment
before he took a leave of absence to
head the Asian Development Bank’s Office
of Regional Economic Integration (OREI).
He has conducted research and consulting
work for various international organizations,
governments and universities, and pub-lished
numerous books and articles on cur-rent
development issues, the latest of which
is “Managing Elevated Risk: Global Liquidity,
Capital Flows, and Macroprudential Policy —
An Asian Perspective” (Springer).
3. December 2014 bloombergbriefs.com Bloomberg Brief | Asean Integration 3
TARGET 2015 TAMARA HENDERSON, BLOOMBERG ECONOMIST
Seven years ago, the Association of Southeast Asian Nations set 2015 as the target date for the establishment of the Asean Economic
Community. The original target was 2020, set in 2003 as the region emerged from the Asian financial crisis.
Asean, with its combined population of more than 600 million, is being transformed into a single market and production base. Integration
will make Asean economies more dynamic and competitive. More harmonized standards, procedures and regulations will reduce busi-ness
Goods
To facilitate the free flow of goods across
national borders, Asean is eliminating tar-iffs
and non-tariff barriers, harmonizing
standards and integrating customs clear-ance.
Import duties on all products, exclud-ing
“sensitive” and “highly sensitive” items,
are to be removed by the end of 2015 and
tariffs on sensitive items are to be reduced
to no more than 5 percent. All non-tariff
barriers are to be dismantled by 2015, with
the CLMV countries — Cambodia, Laos,
Myanmar and Vietnam — given some
“flexibility” in implementation until 2018.
Asean has already achieved significant
progress in tariff reduction. The average
tariff rate across the region fell to 3.87 per-cent
in 2000 from 12.76 percent in 1993,
when the Asean Free Trade Agreement
was launched. The Asean-6 countries
(Brunei, Indonesia, Malaysia, Philippines,
Singapore and Thailand) achieved 60 per-cent
tariff elimination in 2003 and Vietnam
achieved the same in 2006. Tariff rates
for more than 96 percent of traded goods
Continued on next page…
costs, attract investment and lift living standards.
There are three other mutually reinforcing pillars which form the foundation of Asean integration. The second pillar is the creation of a com-petitive
economic region using competition policy to create a level playing field. Consumer protection, intellectual property rights, infrastruc-ture
development, taxation and e-commerce are other aspects of this pillar. The third pillar of the Asean Economic Community is equitable
economic development aimed at reducing development gaps in the region. This goal encompasses the development of small and medium-sized
enterprises, technical assistance and capacity building programs. The fourth pillar is Asean’s integration into the global economy,
including a more coherent approach toward external economic relations and strengthening linkages to the global supply chain. The focus of
this supplement is Asean’s creation of a single market.
among the Asean-6 countries today are
virtually zero, according to Asean.
An integrated customs facility for Asean
is scheduled for implementation by 2015,
when each member’s National Single
Window will be linked. Asean’s single
electronic customs window will stream-line
information collection and processing,
which in turn will expedite customs clear-ance,
reduce costs and boost competi-tiveness.
Individual NSWs in Asean-6 are
already up and running. Vietnam launched
its NSW in April 2014. Myanmar plans to
introduce its NSW by 2016.
Services
Services providers across Asean will be
largely unrestricted in the provision of
services and establishment of compa-nies
across national borders. Restrictions
on all services sectors are to be substan-tially
removed by 2015, with the liberal-ization
of air transport, e-Asean, health
care and tourism having the highest prior-ity.
Arrangements for the mutual recogni-tion
of professional qualifications are to be
completed by 2015.
Within the financial services sector,
integration will continue beyond 2015 as
measures will be consistent with national
laws and appropriately paced to suit the
level of development of individual mem-bers.
For example, the Asean-6 countries
are focusing on enhancing insurance and
capital market services by 2015, while
Cambodia, Laos and Vietnam are working
toward liberalizing their banking sectors.
Investment
Asean seeks to achieve “free and open”
investment with minimal investment restric-tions
by 2015. To this end, members are
working to increase investor confidence
in the region. This includes strengthen-ing
dispute settlement mechanisms that
enhance investment protection; conclud-ing
bilateral agreements to avoid double
taxation; strengthening provisions for the
repatriation of capital, profits and dividends;
and adopting international best practices.
Moving Toward a Single Market
WHO? WHAT? WHY? Brunei, Cambodia, Indonesia,
Laos, Malaysia, Myanmar,
Philippines, Singapore, Thailand
and Vietnam
Single market and production
base with the free movement
of goods, services, investment,
skilled labor and the freer flow
of capital
Increase competitiveness,
narrow development gaps and
improve resilience against
external shocks
Front | Previous | Next
4. December 2014 bloombergbriefs.com Bloomberg Brief | Asean Integration 4
TARGET 2015…
Continued from previous page
Asean members are also working to
increase the transparency, consistency and
predictability of investment policies, by har-monizing
rules and simplifying procedures
where possible. A one-stop investment por-tal,
investasean.asean.org, is already pro-moting
Asean as an integrated investment
area and disseminating investment rules,
regulations, policies and procedures.
Labor
The free flow of skilled labor will allow
Asean businesses to increase productiv-ity
and will benefit individuals by enhancing
job opportunities. Asean is working to facili-tate
the issuance of visas and employment
passes for the region’s professionals and
skilled labor engaged in cross-border trade
in goods, services and investment, as
allowed by prevailing national regulations.
Cooperation among Asean universities is
to be enhanced, with increased mobility for
students and staff within the region.
Capital
To promote the freer flow of capital, which
will increase the appeal of the region
as an investment destination, Asean
is harmonizing capital market stan-dards
in the areas of debt issuance, dis-closure
requirements and distribution
rules. To broaden the investor base, the
region’s withholding tax structure is being
enhanced. Market-driven exchange and
Construction workers labor on a building in
the business district in Jakarta, Indonesia.
Photo: Dimas Ardian / Bloomberg
debt market linkages are facilitating
cross-border capital raising. The removal
or relaxation of restrictions on current
account transactions, where appropriate
and possible, will increase capital mobility,
as will further capital market development.
Source: Asean
SUBSCRIBE TO
BLOOMBERG BRIEFS
MaRkET LEadInG InTELLIGEnCE
Bloomberg Briefs publishes 18 newsletters to help you stay ahead of the markets. Individual
and group subscriptions available. Visit www.bloombergbriefs.com to subscribe or take a trial.
Or call Annie Gustavson at +1-212-617-0544. BRIEF
Front | Previous | Next
5. December 2014 bloombergbriefs.com Bloomberg Brief | Asean Integration 5
ASEAN BY THE NUMBERS
Asean countries have a combined GDP of $2.4 trillion, rivaling the
size of some of the largest economies, such as the U.K.’s at $2.5
trillion. Per capita income in two of Asean’s wealthiest members,
Singapore and Brunei, surpasses the U.S. and Germany and is
about double the U.K.’s. The combined foreign currency reserves of
Asean excluding Brunei are $766 billion, a store of wealth topped
only by China. Growth in Asean’s less developed economies —
Myanmar, Laos and Cambodia — surpasses China. Integration will
further expand the region’s economic base, growth potential and
investment appeal.
POPULATION (Millions)
CHINA
INDIA
ASEAN
EU
NAFTA
ASEAN-6
EURO-12
1,361
1,243
612
506
ECONOMIC SIZE (USD Trillions)
NAFTA
EURO-12
CHINA
U.K.
ASEAN
ASEAN-6
INDIA
AUSTRALIA
SOUTH KOREA
INDONESIA
THAILAND
MALAYSIA
SINGAPORE
PHILIPPINES
NEW ZEALAND
19.856
12.674
9.469
2.523
2.410
2.157
1.877
1.506
1.304
0.387
0.313
0.298
0.272
0.182
FX RESERVES (Billions)
CHINA
ASEAN*
ASEAN-6
SOUTH KOREA
NAFTA
INDIA
SINGAPORE
EURO-12
THAILAND
MALAYSIA
INDONESIA
U.K.
PHILIPPINES
AUSTRALIA
VIETNAM
NEW ZEALAND
MYANMAR
CAMBODIA
LAOS
3,888
766
716
354
291
288
264
168
153
124
106
74
70
38
37
16
7
6
0.7
470
449
INCOMES (GDP per Capita PPP)
SINGAPORE
BRUNEI
U.S.
AUSTRALIA
GERMANY
NAFTA
EURO-12
U.K.
NEW ZEALAND
SOUTH KOREA
MALAYSIA
THAILAND
CHINA
ASEAN-6
INDONESIA
ASEAN
PHILIPPINES
INDIA
VIETNAM
LAOS
CAMBODIA
MYANMAR
78,744
71,759
43,550
43,158
37,457
36,209
34,227
33,140
23,298
14,390
11,904
11,439
9,559
9,378
* Excludes Brunei, for which data are not available
Source: Bloomberg
6,533
5,410
5,293
4,812
3,042
882
ECONOMIC GROWTH (Real GDP % YoY)
MYANMAR
LAOS
CAMBODIA
CHINA
INDIA
VIETNAM
MALAYSIA
PHILIPPINES
ASEAN
INDONESIA
NEW ZEALAND
SOUTH KOREA
AUSTRALIA
U.K.
SINGAPORE
NAFTA
ASEAN-6
EURO-12
THAILAND
8.3
8.0
7.4
7.3
5.3
5.7
5.6
5.0
5.0
3.9
3.2
3.1
3.1
2.8
2.3
1.3
0.7
0.6
-1.8
5.6
BRUNEI
0.870
53,143
43,332
— Tamara Henderson, Bloomberg Economist
320
Front | Previous | Next
6. December 2014 bloombergbriefs.com Bloomberg Brief | Asean Integration 6
Brunei is the largest net exporter of oil liquids in the Asia-Pacific region, according to the U.S. Energy Information
Administration. Crude oil and natural gas production account for 60 percent of the sultanate’s national income and 90
percent of exports. Brunei accounts for less than 1 percent of intra- and extra-Asean goods trade and attracts a neg-ligible
share of Asean’s FDI inflows — also less than 1 percent of the total. The growth in services exports has lagged
average performance in the Asean-5, which comprises founding members Indonesia, Malaysia, the Philippines, Singa-pore
and Thailand. Deeper integration with Asean may help diversify the economy.
GOODS AND SERVICES
18,000
16,000
14,000
12,000
10,000
8,000
6,000
4,000
2,000
0
BRUNEI
95% The increase in Brunei’s services exports in
nominal USD terms between 2005 and 2011,
according to the latest Asean statistics.
2001 2002 2003 2004 2005 2006 2007 2008 2009 2010 2011 2012 2013
$ Million
Extra-Asean Imports Extra-Asean Exports Intra-Asean Imports Intra-Asean Exports Brunei Total Goods Trade
Source: Asean
INVESTMENT
Net FDI Inflows, $ Million
3,500
3,000
2,500
2,000
1,500
1,000
500
0
-500
2001 2003 2005 2007 2009 2011 2013
Source: Asean
CAPITAL
Total ASEAN Extra-ASEAN Intra-ASEAN
Net FDI Share of Asean Total, %
16
14
12
10
8
6
4
2
0
-2
Intra-ASEAN Extra-ASEAN Total ASEAN
2001 2003 2005 2007 2009 2011 2013
■■ FOREIGN EQUITY: Full ownership is allowed, except in the case of activities related to national food security and those requiring the use
of local resources.
■■ FOREIGN EXCHANGE: There are no foreign exchange controls.
■■ REPATRIATION: Foreign banks are required to obtain prior approval before the repatriation of capital or profits.
Source: Asean — Tamara Henderson, Bloomberg Economist
Front | Previous | Next
7. December 2014 bloombergbriefs.com Bloomberg Brief | Asean Integration 7
INDONESIA
Indonesia has a population of 248 million, the fourth-largest in the world and Asean’s largest. The archipelago of
17,508 islands, with a combined land area of 1.8 million square kilometers, attracts the largest share of intra-Asean
foreign direct investment inflows, about 40 percent of the total in 2013. The country’s exports to other parts of Asean
accounted for just 12 percent of the region’s total — among the lowest in the Asean-5 — while services growth has
been the slowest in this group of founding members. Lower intra-Asean flows for goods and services trade suggest
potential gains from deeper integration.
GOODS AND SERVICES
400,000
350,000
300,000
250,000
200,000
150,000
100,000
50,000
0
60% The increase in Indonesia’s services
exports in nominal USD terms between
2005 and 2011, according to the latest
Asean statistics.
2001 2002 2003 2004 2005 2006 2007 2008 2009 2010 2011 2012 2013
$ Million
Extra-Asean Imports Extra-Asean Exports Intra-Asean Imports Intra-Asean Exports Indonesia Total Goods Trade
Source: Asean
INVESTMENT
Net FDI Inflows, $ Million
20,000
15,000
10,000
5,000
0
-5,000
Total Asean Extra-Asean Intra-Asean
2001 2003 2005 2007 2009 2011 2013
14,000
Source: Asean
CAPITAL
Net FDI Share of Asean Total, %
60
50
40
30
20
10
0
-10
-20
Intra-Asean Extra-Asean Total Asean
2001 2003 2005 2007 2009 2011 2013
■■ FOREIGN EQUITY: Up to 100 percent foreign equity ownership is allowed with a number of exceptions and conditions noted in
Presidential Regulation No. 36/2010.
■■ FOREIGN EXCHANGE: Foreign customers may buy foreign exchange from a bank without an underlying transaction for a maximum
of $100,000 per party per month. The corresponding limit for derivatives is $1 million without an underlying transaction.
■■ REPATRIATION: Law No. 25/2007 guarantees the right to transfer capital, after-tax profits, certain costs and compensation in the
event of nationalization.
Sources: Bank Indonesia, Deloitte, KPMG — Tamara Henderson, Bloomberg Economist
Front | Previous | Next
8. December 2014 bloombergbriefs.com Bloomberg Brief | Asean Integration 8
Malaysia has Asean’s largest local currency bond market and is the largest issuer of Islamic bonds. Malaysia attracts
about 10 percent of Asean’s total FDI inflows, a share that has been relatively stable over the last decade. The share of
extra-Asean FDI inflows has been steady, while the share of intra-Asean inflows has been volatile and declined sharply
after the global financial crisis. Malaysia’s share of exports to the rest of Asean, which was 19 percent in 2013, has been
steadily declining since 2002, in contrast with rising or stable shares for the rest of the Asean-5.
500,000
450,000
400,000
350,000
300,000
250,000
200,000
150,000
100,000
50,000
0
2001 2002 2003 2004 2005 2006 2007 2008 2009 2010 2011 2012 2013
$ Million
Extra-Asean Imports Extra-Asean Exports Intra-Asean Imports Intra-Asean Exports Malaysia Total Goods Trade
Source: Asean
500,000
GOODS AND SERVICES
MALAYSIA
84% The increase in Malaysia’s services exports in
nominal USD terms between 2005 and 2011,
according to the latest Asean statistics.
INVESTMENT
Net FDI Inflows, $ Million
2001 2003 2005 2007 2009 2011 2013
14,000
12,000
10,000
8,000
6,000
4,000
2,000
0
-2,000
Total Asean Extra-Asean Intra-Asean
2001 2003 2005 2007 2009 2011 2013
4,000
Source: Asean
CAPITAL
Net FDI Share of Asean Total, %
45
40
35
30
25
20
15
10
5
0
-5
-10
Intra-Asean Extra-Asean Total Asean
2001 2003 2005 2007 2009 2011 2013
12
■■ FOREIGN EQUITY: Some industries are closed to foreign investment due to excess capacity, raw material shortage, public safety,
health and national security reasons.
■■ FOREIGN EXCHANGE: Non-residents may convert foreign currency to ringgit or vice versa with licensed onshore banks for the
purchase of ringgit assets or for the repatriation of funds linked to ringgit investments.
■■ REPATRIATION: Non-residents are free to remit divestment proceeds, profits, dividends or any income arising from investments
in Malaysia.
Source: Asean — Tamara Henderson, Bloomberg Economist
Front | Previous | Next
9. December 2014 bloombergbriefs.com Bloomberg Brief | Asean Integration 9
PHILIPPINES
The Philippines has the largest proportion of private consumption to GDP in Asean, with household spending account-ing
for 67 percent of GDP. Services exports rose 241 percent between 2005 and 2011, the largest gain in Asean, thanks
to strong performance in business processing outsourcing. The archipelago has untapped mineral wealth valued at
more than $840 billion by the CIA, yet attracts the lowest share of intra- and extra-Asean FDI among the Asean-5 mem-bers
— all of which are investment-grade. This discrepancy suggests scope for significant gains from deeper integration.
GOODS AND SERVICES
150,000
125,000
100,000
75,000
50,000
25,000
0
241% The increase in the Philippines’ services exports
in nominal USD terms between 2005 and 2011,
according to the latest Asean statistics.
2001 2002 2003 2004 2005 2006 2007 2008 2009 2010 2011 2012 2013
$ Million
Extra-Asean Imports Extra-Asean Exports Intra-Asean Imports Intra-Asean Exports Philippines Total Goods Trade
Source: Asean
INVESTMENT
Net FDI Inflows, $ Million 2001 2003 2005 2007 2009 2011 2013
2001 2003 2005 2007 2009 2011 2013
4,000
3,000
2,000
1,000
0
-1,000
Total Asean Extra-Asean Intra-Asean
2001 2003 2005 2007 2009 2011 2013
70,000
Source: Asean
CAPITAL
Net FDI Share of Asean Total, %
12
10
8
6
4
2
0
-2
Intra-Asean Extra-Asean Total Asean
2001 2003 2005 2007 2009 2011 2013
■■ FOREIGN EQUITY: Up to 100 percent foreign equity ownership is allowed except in areas identified in the Regular Foreign
Investment Negative List. Enterprises with more than 60 percent exports have fewer restrictions. Some non-Filipino companies must
reduce the foreign ownership share to less than 40 percent within 30 years.
■■ FOREIGN EXCHANGE: Foreign exchange may be purchased subject to specific requirements. Residents may purchase foreign
exchange under $120,000 without approval from the Bangko Sentral ng Pilipinas.
■■ REPATRIATION: BSP-registered foreign investments are entitled to full and immediate repatriation of capital and remittance of profits,
dividends and other earnings which accrue thereon using foreign exchange sourced from the Philippine banking system.
Sources: Asean, Bangko Sentral ng Pilipinas — Tamara Henderson, Bloomberg Economist
Front | Previous | Next
10. December 2014 bloombergbriefs.com Bloomberg Brief | Asean Integration 10
SINGAPORE
Singapore is Asean’s wealthiest member, with per capita income of $36,900 compared with $5,100 for the rest of Asean
excluding Myanmar and $7,900 worldwide. It also attracts the largest share of extra-Asean FDI (55 percent of the total
inflow in 2013). The city-state is home to Asia’s largest financial center (No. 3 worldwide) and is a strategically-located
shipping hub with the second-largest container port in the world. Singapore’s more open and developed economy means
that it has fewer action items to complete for integration.
GOODS AND SERVICES
900,000
800,000
700,000
600,000
500,000
400,000
300,000
200,000
100,000
0
134% The increase in Singapore’s services exports in
nominal USD terms between 2005 and 2011,
according to the latest Asean statistics.
2001 2002 2003 2004 2005 2006 2007 2008 2009 2010 2011 2012 2013
$ Million
Extra-Asean Imports Extra-Asean Exports Intra-Asean Imports Intra-Asean Exports Singapore Total Goods Trade
Source: Asean
INVESTMENT
Net FDI Inflows, $ Million
2001 2003 2005 2007 2009 2011 2013
70,000
60,000
50,000
40,000
30,000
20,000
10,000
0
Total Asean Extra-Asean Intra-Asean
2001 2003 2005 2007 2009 2011 2013
Source: Asean
CAPITAL
Net FDI Share of Asean Total, %
90
80
70
60
50
40
30
20
10
0
Intra-Asean Extra-Asean Total Asean
2001 2003 2005 2007 2009 2011 2013
■■ FOREIGN EQUITY: Foreign ownership is unrestricted with some exceptions. A 40 percent limit is placed on foreign ownership of
locally-incorporated banks.
■■ FOREIGN EXCHANGE: There are no foreign exchange controls.
■■ REPATRIATION: Resident individuals and corporations are free to move funds, import capital or repatriate profits without restriction.
Source: Asean — Tamara Henderson, Bloomberg Economist
Front | Previous | Next
11. December 2014 bloombergbriefs.com Bloomberg Brief | Asean Integration 11
THAILAND
Thailand is Asean’s automotive hub, exporting almost 2.5 million vehicles in 2013, the ninth-largest shipment volume
in the world, according to the International Organization of Motor Vehicle Manufacturers. Extra-Asean FDI inflows have
recovered from the global financial crisis, while intra-Asean FDI inflows remain well below pre-2008 levels. Services
exports doubled in nominal U.S. dollar terms between 2005 and 2011, the second-fastest pace in the Asean-5, though a
tentative service-sector reform agenda, including outdated activities for liberalization, will damp integration benefits.
GOODS AND SERVICES
500,000
450,000
400,000
350,000
300,000
250,000
200,000
150,000
100,000
50,000
0
110% The increase in Thailand’s services exports in
nominal USD terms between 2005 and 2011,
according to the latest Asean statistics.
2001 2002 2003 2004 2005 2006 2007 2008 2009 2010 2011 2012 2013
$ Million
Extra-Asean Imports Extra-Asean Exports Intra-Asean Imports Intra-Asean Exports Thailand Total Goods Trade
Source: Asean
INVESTMENT
Net FDI Inflows, $ Million
14,000
12,000
10,000
8,000
6,000
4,000
2,000
0
-2,000
Total Asean Extra-Asean Intra-Asean
2001 2003 2005 2007 2009 2011 2013
Source: Asean
CAPITAL
Net FDI Share of Asean Total, %
70
60
50
40
30
20
10
0
-10
Intra-Asean Extra-Asean Total Asean
2001 2003 2005 2007 2009 2011 2013
■■ FOREIGN EQUITY: Equity requirements are listed in the Foreign Business Act of 1999. Foreigners may engage in certain enterprises
if more than 50 percent of the capital is owned by Thai nationals. Majority foreign ownership is permitted for companies promoted by the
Board of Investment when exports are at least 50 percent of sales.
■■ FOREIGN EXCHANGE: Purchase of foreign currency from authorized banks is generally allowed upon submission of documents
indicating underlying international trade and investment. Thai baht transactions by non-residents without underlying trade and
investment are limited to prevent speculation.
■■ REPATRIATION: Outward remittances of amounts properly due to non-residents are permitted for items of a non-capital nature such
as service fees, interest, dividends, profits or royalties, provided that supporting documents are submitted to an authorized bank.
Source: Bank of Thailand — Tamara Henderson, Bloomberg Economist
Front | Previous | Next
12. December 2014 bloombergbriefs.com Bloomberg Brief | Asean Integration 12
CLMV COUNTRIES
Asean’s newest members — Cambodia, Laos, Myanmar and Vietnam — are also the region’s least developed. CLMV countries
joined Asean between 1995 and 1999 compared with 1967 for the original signatories. Per capita income is $1,410 on average in
CLMV, compared with $19,550 for the other members.
CLMV’s development gap means more physical and institutional infrastructure needs to be built, which presents a much larger
work program to complete for seamless integration. A spring-board for CLMV countries is the integration process itself, includ-ing
intra-Asean investment inflows and technical assistance. As CLMV members benefit from an accelerated development process,
Asean-6 investors are well-placed to capitalize on the rewards from CLMV’s dynamic growth.
MYANMAR
CHALLENGES: Managing multiple
transitions (from military regime to
democratic process, from centrally-planned
to market-oriented economy, and
from conflict to peace in border areas).
ASSETS: Mineral wealth, advantageous
location between China and India, size.
LAOS
CHALLENGES: Building international
reserves, taming excessive credit growth
and reducing a large fiscal deficit (near
term); ensuring wealth from natural
resources benefits all (long term).
ASSETS: Natural resources (timber,
agricultural land, hydropower and minerals).
VIETNAM
CHALLENGES: Enhancing monetary
and fiscal policy credibility (near term);
completing transition to market-based
economy (long term).
ASSETS: Low poverty rate, infrastructure
(95 percent of population has access to
electricity, 90 percent of the population is
connected by all-weather roads), natural
resources.
CAMBODIA
CHALLENGES: Reducing dollarization
(near term); improving governance and
effectively managing land and natural
resources (long term).
ASSETS: Natural resources.
Sources: Central Intelligence Agency, IMF, World Bank — Tamara Henderson, Bloomberg Economist
Front | Previous | Next
13. December 2014 bloombergbriefs.com Bloomberg Brief | Asean Integration 13
With the Asean Economic Community’s December 2015
deadline looming, how much further does the region
have to go? Iwan Azis, head of the Office of Regional
Economic Integration at the Asian Development Bank,
spoke with Bloomberg Brief’s Justin Jimenez to weigh in
on its progress.
Q: Which aspects of the AEC are showing the most progress?
Which are showing the least?
A: The most progress — which I think is the really key success
of Asean in general — has been with the fourth pillar, integration
into the global economy. Before the Asian financial crisis, Asean
was an open economy inviting investors, as well as trading with
all kinds of countries, including industrialized countries. So the
fourth pillar has basically been achieved.
The most difficult aspect is a component of the first pillar, which
is about creating a single market and production base. Asean has
been very successful in participating in the region’s production
networks. Many countries either produce intermediate goods that
will be processed in countries outside of Asean or export primary
goods including natural resources. But when it comes to services,
that has been more difficult for two reasons. First, Asean has
only had a short history in terms of liberalizing the services sec-tor.
Throughout the history of Asean’s trade liberalization, which
began in the late 1970s when it introduced Preferential Trade
Agreements, very few PTAs have touched upon the services sec-tor;
most of the discussion has been about goods. Second, when
it comes to services, it’s rather difficult to grasp what the implica-tions
are for individual countries.
Q: You mentioned goods and services. What about integration
in terms of labor, investment and capital?
A: Let’s start with labor. This is related to the difficulty in liberalizing
services. So far, Asean is doing okay in terms of unskilled labor.
There is already a lot of labor movement within the region, but that’s
mostly unskilled. It gets difficult when you get to the mobility of skilled
labor. There’s reluctance on the part of some countries. So far what
they’ve done is introduce certification for skilled labor. But there are
still problems in terms of how to expand the list of labor qualification
categories and how to make the certification process easier. Keep in
mind that most Asean countries are emerging and becoming middle-income
countries. That means the requirement for skilled labor is
there, but the supply may not be there yet. Since they are trying to
tap their own existing pool of skilled labor, they don’t want early com-petition
from other countries.
In terms of investment, Asean has been relatively open, but
in the past most foreign investments were coming from outside
Asia. Then, in the early 2000s, Asean began to experience a lot
of foreign investment from neighboring Asian countries, the “Plus
Three” — Korea, Japan and China. In the last few years, investors
from within Asean have started to invest in other Asean countries.
If we want to make a prognosis on what’s going to happen in
the next few years, I think this trend will continue, but I am inter-ested
in observing the nature of the investments. Suppose there
is a Korean investment in the Philippines. They won’t be investing
using U.S. dollars or foreign currency, but Philippine pesos — for-eign
investment, but operating with local currency.
Q: How long will those integration initiatives take?
A: I am pretty optimistic that it’s going to happen quite soon and
quite fast. One piece of evidence that I have
seen in the bond market is the Asian Bond
Market Initiative. The Asean Plus Three
governments, in the early 2000s, came up
with this new initiative, and asked the ADB
to help with the implementation.
One of the initiatives that the ABMI is cur-rently
working on is the Asean Plus Three
Multi-Currency Bond Issuance Framework,
or AMBIF, which aims to use local curren-cies
for foreign investments. For example, if
you are in Korea you should be able to get
bonds in Thai baht without difficulty in order
to invest in Thailand. Imagine the alterna-tive.
If Korean investors have to borrow from
domestic banks in Thailand, the Thai banks
would not treat them the same as Thai bor-rowers.
There would be some distinction in
terms of the conditions. They are still foreign
investors to them — of course banks don’t
have full information about these investors.
The point here is that it’s not going to be
easy if there are no facilities to provide local
currency to those prospective investors.
IMPLEMENTATION REALITY
Asean’s ‘Real’ Work Comes Post-2015
Continued on next page…
A Thai national flag flies while containers sit stacked near gantry
cranes at the Port of Bangkok.
Photo: Dario Pignatelli / Bloomberg
Front | Previous | Next
14. December 2014 bloombergbriefs.com Bloomberg Brief | Asean Integration 14
Q: How are the AEC’s harmonization of
standards and the single customs window
progressing? What are the challenges?
A: For the single window, it has been stipu-lated
that it will be achieved by December
2015. I am quite optimistic that at least for
the Asean-5 (Indonesia, Malaysia, the Phil-ippines,
Singapore and Thailand) it’s going
to happen. That will facilitate a lot in terms of
trade. When you talk about trade liberaliza-tion,
it’s not just about tariffs, but also trade
facilitation — the administrative procedures,
the customs clearances, etc. So the single
window will definitely make the flows easier.
But it takes time. It’s not going to be 100
percent by December 2015, but I think it’s
moving in that direction. It’s almost like the
case of tariffs. At the beginning it’s only 70
percent, but slowly it becomes 100 percent.
The harmonization of standards is a bit
more difficult compared to the single window.
They are moving in that direction, but I think it
will be slower. When it comes to harmoniza-tion,
you have to deal with both domestic reg-ulation
and, in some cases — this is the most
important — national constitutions. That comes down to domestic
politics. So I think it will take a longer time for the full harmonization.
But partial harmonization is already there. I can give you
an example. There is an association among the Asean stock
exchanges that is improving the harmonization process for Ase-an’s
equity markets. For Filipino investors who want to buy shares
of a company in Thailand, for example, it will be easier because
this group provides the necessary information. But that is only
up to a certain point. When it touches some sensitive issues —
domestic regulations, the constitution — that will take longer.
Q: What sectors do you see as more difficult to harmonize?
A: The sectors that are considered sensitive. Take the banking
sector, and the Qualified Asean Bank criteria. In one country in
Asean, the banking liberalization is close to 100 percent, meaning
that any foreign banks — not just from Asean — are free to enter.
This liberalization was an outcome of the Asian financial crisis in
1997. Whereas in other Asean countries, that isn’t the case. So
that is not a level playing field.
If you force banking liberalization in a system where there isn’t
a level playing field, you’re bound to have losers and winners.
Asean doesn’t want that. Then, you have to talk about whether
the banking sector is considered a strategic sector, you have to
change domestic rules and regulations. And then in each coun-try
they may have a point in the constitution that strategic sectors
should be protected and treated differently in order to be used for
the welfare of the domestic population. When it touches that kind
of thing, it gets more difficult.
Q: Dec. 31, 2015 is the deadline. What happens afterward?
A: That’s the most important thing — what happens afterward.
First, the real work comes post-December 2015. That is the
moment that everybody has to make their work concrete. The
good thing about AEC is that even though it’s not going to be
achieved 100 percent, everybody is talking about 2015 — not just
the government, but also the private sector. The tone now is ‘Oh
my God, it’s just around the corner.’ This deadline was set up in
2007, but they’re only now realizing it. So it’s good, everybody has
started to improve their efficiency.
The second thing is that the day after 2015, their main task is to
reduce any uncertainty. We see the AEC 2015 as a journey rather
than a destination. That journey is to move toward a more open
Asean. But getting from zero to 70 percent is easier to achieve
than from 70 percent to 100 percent. You’re starting to touch on
the most difficult sectors. For those remaining sectors, they have
to provide some sort of certainty in terms of, for example, what
the future tariffs are going to be.
The third thing is related to infrastructure and reducing the
cost of trade. By building infrastructure, transport costs will be
reduced, for example. Harmonization will also be easier.
Lastly, to me, what is important in any integration and coop-eration
effort is trust. This is the reason why I really like the name
Asean Economic Community — they use the word ‘community.’ It
goes beyond just economics. It goes beyond trade, investment,
capital, exports and imports. There is a human or people compo-nent
to it. That is key. Unfortunately, not many people realize this
because they’re measuring the success or failure of integration by
the standard, tangible economic data. But trust is everything. And
that is the major challenge for Asean post-2015: how do you build
that trust?
This interview has been edited and condensed.
IMPLEMENTATION REALITY…
Continued from previous page
Customers use automated teller machines outside the Maybank
branch at the company’s headquarters in Kuala Lumpur, Malaysia.
Photo: Charles Pertwee / Bloomberg
Front | Previous | Next
15. December 2014 bloombergbriefs.com Bloomberg Brief | Asean Integration 15
INTEGRATION PRECEDENTS TAMARA HENDERSON, BLOOMBERG ECONOMIST
Experiences in Europe and North America Foreshadow Gains in Asean
As Asean countries work diligently to build a single market, the integration experiences in Europe and North America provide useful
yardsticks for investors to assess the potential impact of the Asean Economic Community. Intra-regional trade and investment flows, as
well as per capita incomes after inflation, rose sharply for most European Union and North American Free Trade Agreement members
within the first five years of integration — though the net impact on economic growth has more been moderate.
The effect of integration is difficult to capture because of other simultaneous influences on economic activity. Measurement is further compli-cated
by an incremental integration process that takes place over a number of years. There are also dynamic impacts from improved produc-tivity
and intangible benefits from peace dividends and greater resilience to external shocks, which tend to be omitted from quantitative studies.
The integration process is a long and winding road, as witnessed across Europe, North America and, now, Asean. Though progress
can seem painstaking and piecemeal, experience suggests the benefits not only accumulate, but can be sustained over time.
country without having to obtain a work
permit or local technical accreditation.
The Maastricht Treaty in 1993 set in
motion the creation of a single currency.
Twelve members adopted the euro, which
was launched on Jan. 1, 1999. Between
1995 and 2004, membership in the re-named
European Union more than dou-bled.
Eighteen countries now use the
common currency.
ECONOMIC IMPACT
The EU has delivered on its peace objec-tive
and has helped raise the living stan-dards
of its members. In the five years after
SEA was implemented, the per capita
income of EEC members in constant U.S.
dollars rose by 1.9 percentage points more
than the world average increased. Income
per capita in the three years after joining
the EU rose 32.5 percent on average from
the three years before membership for
countries joining the EU after 1995.
For the countries that joined the EU
between 2004 and 2007 — the Czech
Republic, Hungary, Poland and Roma-nia
— average per capita income in the
Continued on next page…
European Union
BACKGROUND
Europe’s integration process began in the
1950s. Coming in the wake of the Second
World War, the aim was to secure lasting
peace through economic interdependence.
The initial economic partnership among
six member states of the European Eco-nomic
Community has evolved into a polit-ical
union spanning 28 countries.
The EEC was transformed into a cus-toms
union in the 1960s and gradu-ally
added new members. By the 1980s,
membership had doubled to 12 countries,
yet high unemployment and lagging pro-ductivity
growth plagued the region. This
state of “eurosclerosis” was blamed on
excessive government regulation and
small fragmented national markets for
labor and capital.
The European Commission responded
with the Single European Act of 1986,
which led to widespread changes —
including the abolition of border controls,
the recognition of product standards of
other members, the harmonization of tax
codes, the ability to shift funds from one
country to another without capital controls
and the ability to work in another member
EU: Impacts After SEA and Euro Launched, Selected Members
YEAR OF EU ENTRY >>
BELGIUM
1952
FRANCE
1952
GERMANY
1952
PORTUGAL
1986
EU: Comparison of Five-Year
Average Before, After Membership
Against the World
GDP Per Capita – Constant $
Percentage Difference
CZECH REP. 138
HUNGARY 110
POLAND 122
ROMANIA 128
Annual Real GDP Growth
Percentage Point Difference
CZECH REP. 0.7
-3.1 HUNGARY
POLAND 0.2
-2.2 ROMANIA
Annual CPI Inflation
Percentage Point Difference
-2.9 HUNGARY
-3.4 POLAND
ROMANIA 0.1
Note: The Czech Republic, Hungary and Poland joined
the EU in 2004. Romania joined in 2007.
Source: Bloomberg
SPAIN
1986
U.K.
1973
-0.7 CZECH REP.
SAMPLE
AVERAGE
WORLD
AVERAGE
5-Year Period After Single European Act Implemented (Dec. 31, 1992)
GDP Per Capita – Constant $ % Change 8.7 5.0 3.9 9.9 9.4 19.9 9.5 7.6
Real GDP YoY PPT Change 4.8 3.0 1.5 1.3 3.0 2.0 2.6 1.8
Investment – % of GDP PPT Change -1.1 -2.5 -2.2 -0.8 -0.8 1.1 -1.0 0.1
5-Year Period After Euro Launched (Jan. 1, 1999)
GDP Per Capita – Constant $ % Change 8.7 7.4 5.6 7.0 13.7 14.5 9.5 7.9
Real GDP YoY PPT Change -0.1 -1.7 -1.0 -6.0 -1.4 1.1 -1.5 1.5
Investment – % of GDP PPT Change -1.8 0.5 -4.0 -4.6 3.9 -1.5 -1.2 -0.8
Source: Bloomberg Note: Denmark, Greece, Ireland, Italy, Luxembourg and the Netherlands are excluded due to missing Eurostat data.
Front | Previous | Next
16. December 2014 bloombergbriefs.com Bloomberg Brief | Asean Integration 16
five years after membership increased
between 18.9 percent and 24.3 percent
compared with the five years prior to
membership; this was more than twice the
world average at the time.
Economic growth after inflation
tended to increase more for EEC mem-bers
than the world average in the five
years after SEA was implemented. Real
GDP growth in the three years after join-ing
the EU was 1.7 percentage points
higher on average than in the three years
prior to membership for countries joining
the EU after 1995. Individual country per-formance
was quite varied. GDP growth
even contracted in some cases.
Growth in the Czech Republic and
Poland in the five years after EU member-ship
outpaced the world average, though
growth in Hungary and Romania under-performed
global peers.
Unencumbered access to the
EU’s market of 500 million consum-ers
coincided with a drop in consumer
price inflation for these countries
that exceeded the average decline in
world CPI.
INTEGRATION PRECEDENTS…
Nafta
BACKGROUND
The North American Free Trade Agreement
has created a single market among the
U.S., Canada and Mexico — with a com-bined
GDP equivalent to 27 percent of the
world’s output and a population base of
470 million. The deal, which went into effect
on Jan. 1, 1994, gradually eliminated all
tariffs and most non-tariff barriers on goods
produced and traded within North America.
Some tariffs were eliminated immediately,
while more sensitive sectors were phased
out over a span of up to 15 years.
Nafta included provisions on rules
of origin, foreign investment, intellec-tual
property rights protection and dis-pute
resolution. The treaty liberalized a
broad range of service sectors, instituted
national treatment for cross-border ser-vices
providers and guaranteed fair, trans-parent
and non-discriminatory treatment
of investors and their investments.
ECONOMIC IMPACT
U.S. trade with Canada doubled in the
first decade after Nafta went into effect,
even though the U.S. and Canada had
implemented a free trade agreement five
years beforehand. U.S. trade with Mex-ico
increased 522 percent between 1993
and 2012, compared with a 279 percent
increase in trade with non-Nafta coun-tries,
according to the U.S. Congressional
Research Service.
Cross-border investment also surged.
The stock of U.S. foreign direct investment in
Mexico rose 564 percent to $101 billion and
the stock of U.S. FDI in Canada quadrupled
between 1993 and 2012. During the same
period, the stock of Canadian FDI in the U.S.
rose 458 percent, according to the CRS.
Per capita income in the U.S. and
Canada increased by more than the world
average after Nafta was implemented —
14.1 and 13 percent, respectively — while
this metric of living standards lagged for
Mexico in the five years after Nafta was
signed. Average economic growth after
inflation in the five years after Nafta’s
implementation increased by 1.8 percent-age
points in Canada and 1 percentage
point in the U.S. compared with average
growth in the five years preceding Nafta —
both above the world average of 0.1 per-centage
point. In Mexico, growth slowed
by 0.3 percentage point. During the same
period, inflation dropped by 14.3 percent-age
points in Mexico compared with a
decline of 2.4 percentage points in Can-ada,
a drop of 1.5 percentage points in the
U.S. and a decrease of 4.5 percentage
points on average across the globe.
In a research review of Nafta’s impact
after 20 years, the CRS in April concluded
that the agreement “did not cause the huge
job losses feared by the critics or the large
economic gains predicted by supporters.”
The smaller effect on GDP can be attrib-uted
to a number of factors. For one, Nafta
was implemented five years after the U.S.-
Canada Free Trade Agreement went into
effect and when U.S. tariffs on most Mexi-can
goods were already low. In addition,
the final aspects of the pact were not fully
implemented until Jan. 1, 2008 as Nafta
allowed tariffs to be phased out over a 15
year period. Also, cross-border activity after
2001 was damped by tighter border security
after the Sept. 11, 2001 terrorist attacks and
there was increased competition from Chi-nese
exports after Beijing joined the World
Trade Organization in December 2001.
Nafta’s net impact on U.S. employ-ment
is still under debate, though there
seems to be agreement that the opening
of the market increased export-related jobs
— which pay an average of 15 to 20 per-cent
more than those oriented toward the
domestic economy, according to the CRS.
The expansion in Mexico’s economy cor-responded
with a plunge in both legal and
illegal immigration from Mexico to the U.S.,
according to a Pew Hispanic Center report.
Sources: Bloomberg Brief, Congressional
Research Service, Europa
Nafta: Gains From Agreement
% CHANGE IN GDP PER
CAPITA – CONSTANT $
PPT CHANGE IN ANNUAL
REAL GDP GROWTH
PPT CHANGE IN INVESTMENT
AS A % OF GDP
PPT CHANGE IN ANNUAL
CPI INFLATION
U.S. CANADA MEXICO WORLD U.S. CANADA MEXICO WORLD U.S. CANADA MEXICO WORLD U.S. CANADA MEXICO WORLD
5 Years On: Dec. 31, 1993 - Dec. 31, 1998
14.1 13.0 6.5 8.7 1.7 1.8 2.1 0.3 2.5 2.6 2.8 0.0 -1.4 -0.8 6.2 -13.5
10 Years On: Dec. 31, 1993 - Dec. 31, 2003
25.0 26.9 8.3 17.3 0.1 -0.4 -1.1 1.9 1.3 2.1 3.0 -0.7 -0.7 0.9 -5.2 -15.5
20 Years On: Dec. 31, 1993 - Dec. 31, 2013
36.2 37.9 23.7 35.6 -0.5 -0.3 -1.5 1.1 -1.0 5.7 2.6 1.4 -1.5 -0.9 -5.9 -15.4
Comparison of 5-Year Average Before and After Membership
9.2 5.1 6.0 5.1 1.0 1.8 -0.3 0.1 0.4 -1.2 -0.8 -1.0 -1.5 -2.4 -14.3 -4.5
Source: Bloomberg
Front | Previous | Next
continued from previous page
17. December 2014 bloombergbriefs.com Bloomberg Brief | Asean Integration 17
PROGRESS BENCHMARKS TAMARA HENDERSON, BLOOMBERG ECONOMIST
Asean Has Potential to Outperform Peers
Asean’s integration plan has a number of similarities with aspects of the EU and Nafta experiences. This overlap means that the eco-nomic
impacts from these regions — namely, increased trade and investment flows within the integration area, higher per capita income,
stronger growth and lower inflation — can be applied as benchmarks to assess Asean’s progress in interlinking its economies.
Still, there are a number of key differences between Asean’s circumstances and ambitions and those of the EU and Nafta — the num-ber
of members, the degree of the development gap across members and the scope of political aspirations. This means the degree of
impact and pace of progress may be different for Asean members. While Asean’s wider development gap presents higher hurdles for
implementation, it also means the potential benefits of integration are that much larger.
POLITICAL WILL
The aim of economic integration is an important motivator for policy making in the face of resistant vested interests in
favor of the status quo. For the European Community, economic interdependence was seen as a means to enhance
security, putting a stop to frequent wars in the region. For Mexico, Nafta was a means to transform the economy after a
devastating debt crisis in the 1980s. The Asian financial crisis (1997-98) and the global financial crisis (2008-09) helped
steel Asean’s resolve to integrate faster in order to increase members’ resilience against external shocks. Hence, Asean
members have a strong motivation to integrate, similar to the EU and Nafta countries.
ECONOMIES OF SCALE
Integration allows businesses to more seamlessly tap into a larger pool of labor, capital, suppliers and customers. Also,
intra-regional imports and extra-regional exports tend to have higher domestic content, so that domestic firms ben-efit
from another member’s exports inside and outside of the group. Asean has a larger population base than EU and
Nafta members. It has a wider development gap among its members and trade is a larger share of the economy for
most members. Hence, Asean nations may reap larger rewards from integration than the EU and Nafta countries,
especially as incomes in the poorer members start to rise.
EXTRA PROVISIONS
Like the EU and Nafta, Asean is making changes that go beyond the scope of a free trade area’s elimination of tariffs
and non-tariff barriers. The AEC also encompasses services, investment protections, intellectual property rights and dis-pute
resolution, among others. The similar depth of planned integration measures gives Asean members compa-rable
potential to EU and Nafta countries.
FLEXIBILITY
Asean’s integration plan includes exception lists and allows for the gradual removal of barriers, similar to Nafta and the
EU. Even today, after more than 60 years of liberalization, not all goods, services, money and people move freely across
EU member borders. With Nafta, only tariffs on “qualifying goods” were eliminated and services liberalization measures
have exclusions and reservations by each country. Nafta’s harmonization of regulations and liberalization of services
have lagged markedly. Hence, Asean members face similar hurdles to integration as the EU and Nafta countries.
BLOOMBERG
BRIEF GROUP
SUBSCRIPTIONS
Bloomberg newsletters are now available for group purchase
at very affordable rates. Share with your team, firm or clients.
Contact us for more information: +1-212-617-9030 bbrief@bloomberg.net
BRIEF
Front | Previous | Next
18. December 2014 bloombergbriefs.com Bloomberg Brief | Asean Integration 18
Economics ETFs
Economics Asia Financial Regulation
Economics Europe Hedge Funds
Asia Corporate Treasury Hedge Funds Europe Oil Buyer’s Guide Technical Strategies
Bankruptcy & Restructuring Leveraged Capital Private Equity Deutschland (free brief)
China Mergers Real Estate London (free brief)
Clean Energy & Carbon Municipal Market Structured Notes Reserve (free brief)
of readers say
their Brief helps
them do their jobs better.
Front | Previous | Next
19. SUBSCRIBE TO
BLOOMBERG
BRIEFS
BRIEF
SETTING A NEW STANDARD IN FINANCIAL NEWSLETTERS
Published either daily or weekly (depending on the title), the Bloomberg BRIEF newsletters pull
together the reporting, insight and analysis of senior editorial staff and dedicated economists to
help you stay informed and ready for your daily business needs. They offer cutting-edge access to
proprietary Bloomberg data and breaking stories that move markets. Bloomberg BRIEF newsletters
are uniquely positioned to provide you with the scope, depth and market intelligence you need.
To take a trial or subscribe, fill out the form below, call us on +1-212-617-9030 or visit our website
at bloombergbriefs.com
Name
Company
Position
Phone
Email
www.bloombergbriefs.com
Check appropriate box(es):
[ ] Please set me up for a trial
[ ] Please invoice me for a
subscription
Fax or email this form to:
Email: bbrief@bloomberg.net
Fax: +1-917-369-4950
Group Subscriptions also avail-able.
Please inquire for further
information on group discounting:
+1-212-617-9030.
[ ] Economics – Daily. $995 per year
[ ] Economics Europe – Daily. $995 per year
[ ] Economics Asia – Daily. $995 per year
[ ] Hedge Funds – Weekly. $995 per year
[ ] Hedge Funds Europe – Weekly. $995 per year
[ ] Bankruptcy & Restructuring – Daily. $995 per year
[ ] Private Equity – Weekly. $995 per year
[ ] Leveraged Capital – Weekly. $995 per year
[ ] Municipal Market – Daily. $995 per year
[ ] Oil Buyer’s Guide – Daily. $749 per year
[ ] Financial Regulation – Weekly. $995 per year
[ ] Mergers – Weekly. $995 per year
[ ] Technical Strategies – Bi-Weekly. $995 per year
[ ] Structured Notes – Weekly. $995 per year
[ ] Real Estate – Quarterly. $249 per year
[ ] Asia Corporate Treasury – Monthly. Free
Bloomberg Terminal users may sign up on the
terminal via BRIEF<GO>. Access to the newslet-ters
is included within your terminal subscription.