This document provides an acknowledgements and contents section for the Kingdom of Tonga NCD Risk Factors STEPS Report from 2014. It acknowledges the many individuals and organizations that contributed to compiling the report. These include staff from the Ministry of Health of Tonga, the World Health Organization regional and country offices, as well as statistical and administrative support. The contents section provides an overview of the report's structure, which includes an executive summary, introduction, methodology, results, comparisons with a previous 2004 STEPS survey, discussion and conclusions, and recommendations. The report examines risk factors for noncommunicable diseases in Tonga through the WHO STEPwise approach, analyzing data on tobacco use, alcohol consumption, diet, physical activity, obesity, blood
![20
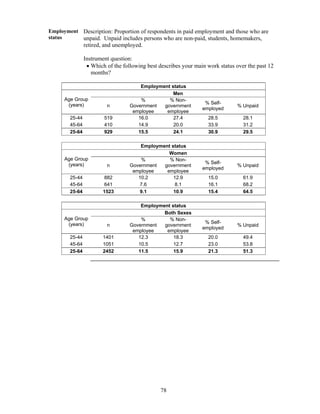
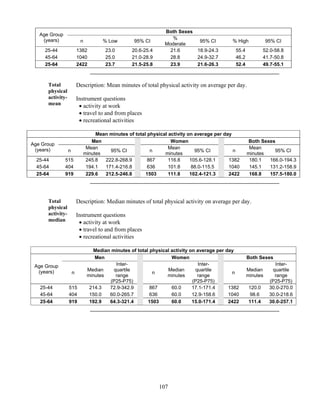
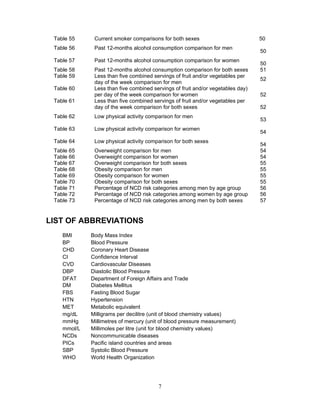
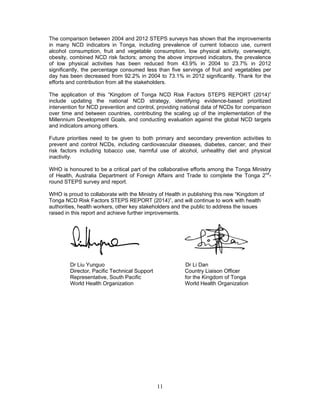
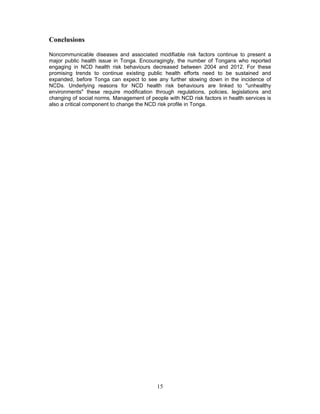
country consists of five main island groups: Tongatapu, Ha’apai, Vava’u, ‘Eua and Niuas.
Tongan is the official language of the island, but English is also widely spoken.
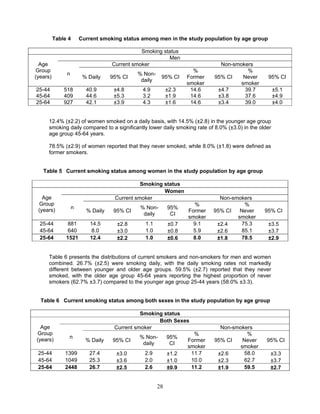
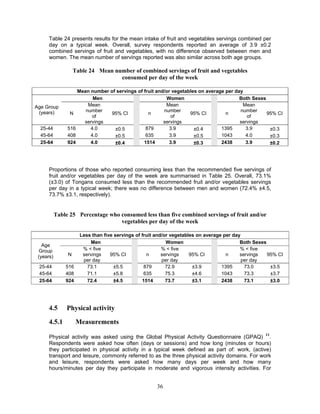
Based on the 2011 Census, two thirds of the 104,000 inhabitants live on the main island,
Tongatapu, particularly around the capital city of Nuku’alofa. Tonga has a young population
with approximately 38% of the population being under 15 years of age, and 8% aged 60
years and older. While the official data have Tongans experiencing a relatively high life
expectancy at 72.5 years of age, a recent study found that life expectancy in Tonga has
plateaued or decline; with rising NCDs and premature mortality being considered as the key
driver of this change.
1.3.2 Government, education and the economy
Tonga is a constitutional monarchy, with governance power vested in the Cabinet of
Ministers, headed by the Prime Minister. Legislative Assembly Members are elected by
popular vote. Local villages or group of villages are governed by town or district officials,
respectively.
The education is structured into primary, secondary and post-secondary. Tonga government
funds the majority of primary schools and approximately one third of secondary schools; the
rest are funded by various [religious] denominations. Tongans have an average of 10 years
of schooling, and enjoy a 99% adult literacy rate
10
.
The United Nations classifies Tonga in the medium human development category, with
Tonga's Human Development Index (HDI; the United Nations composite measure of health,
education and income) at 0.710, giving it a ranking of 95 out of 186 countries with
comparable data
10
. The HDI of East Asia and the Pacific as a region is 0.683, placing Tonga
above the regional average. However, this development gain is potentially under threat
unless Tonga reverses the rising incidence of diabetes and cardiovascular diseases.
As a small island nation Tonga has limited human and financial resources. In 2012, Tonga’s
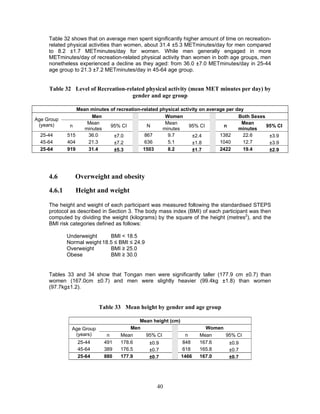
Gross National Income (GNI) per capita stood at US$4,153
10
. The country’s economy is
agricultural-based including fishing and root crops, with very limited export base. Tonga
relies substantially on import products, and remittances from Tongans living overseas.
Tonga’s economic growth and ability to attract foreign investment is limited by high
transportation costs and fragile ecosystem and weather.
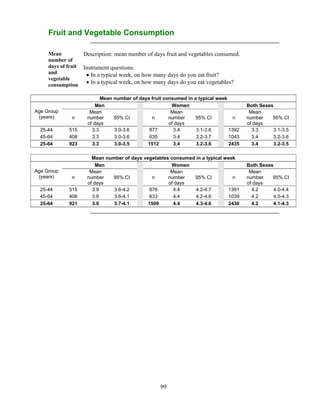
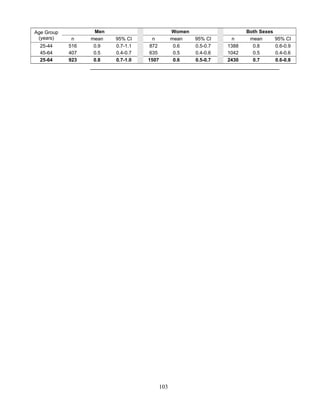
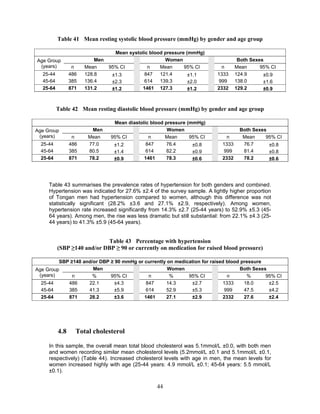
2. OBJECTIVES
The key objectives of the 2012 Tonga STEPS survey include:
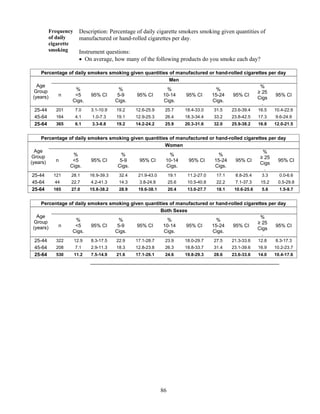
documenting the prevalence and magnitude of major modifiable risk factors for
NCDs, including tobacco use, alcohol consumption, fruit and vegetable consumption,
physical activity, overweight and obesity, blood pressure, blood glucose and
cholesterol levels;
documenting the prevalence of key NCDs among adults in Tonga, and;
monitoring trends in major NCD risk factors and key NCDs across age groups and
gender.
This STEPS survey will provide within-country trend data for national policy and health
promotion initiative development.](https://image.slidesharecdn.com/2012tongastepsreport1-210426054240/85/2012-tonga-steps_report-1-21-320.jpg)
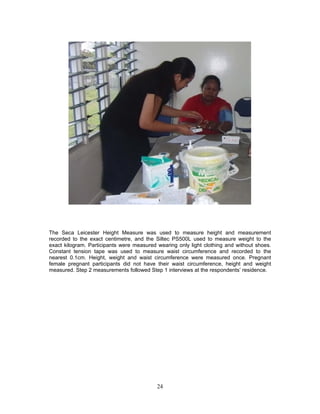
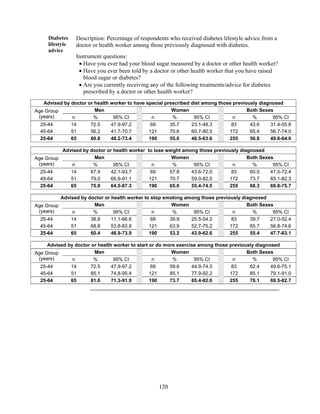
![68
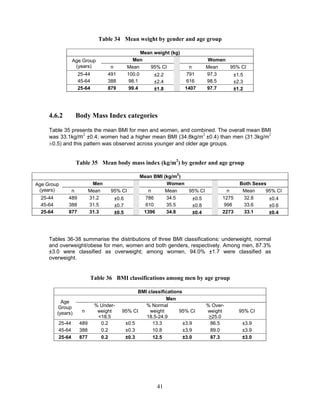
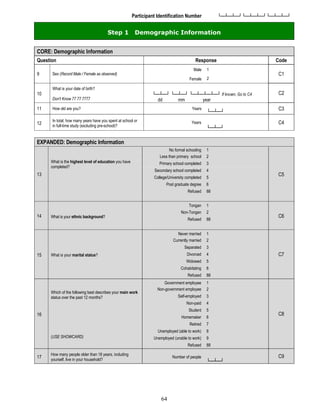
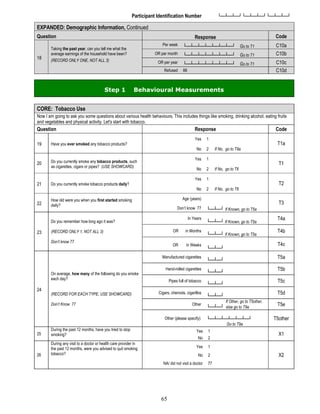
Participant Identification Number └─┴─┴─┘└─┴─┴─┘└─┴─┴─┘
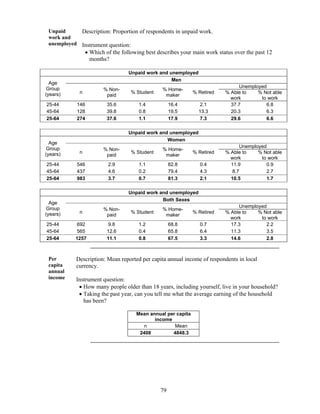
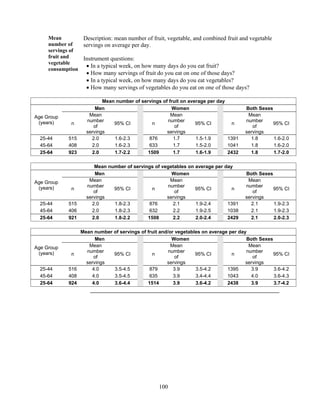
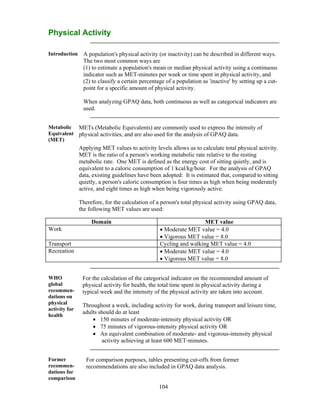
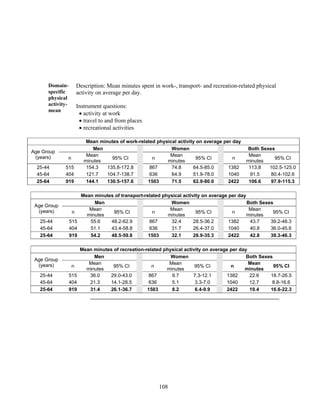
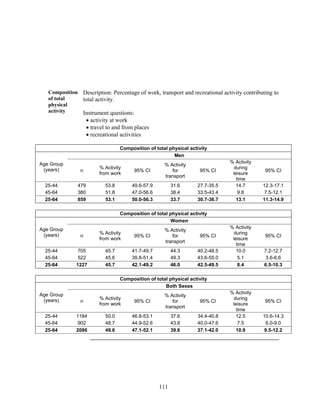
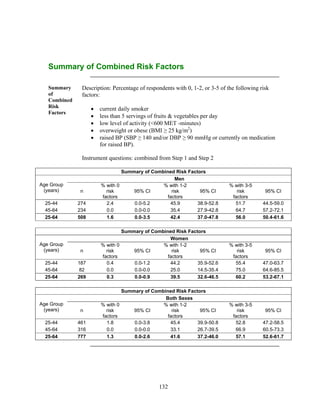
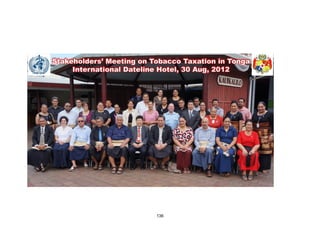
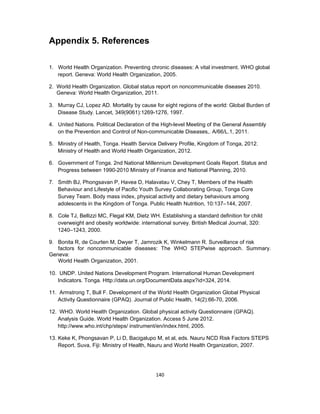
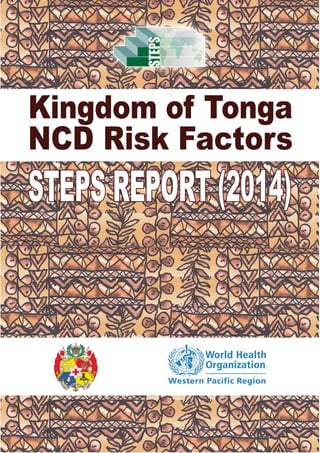
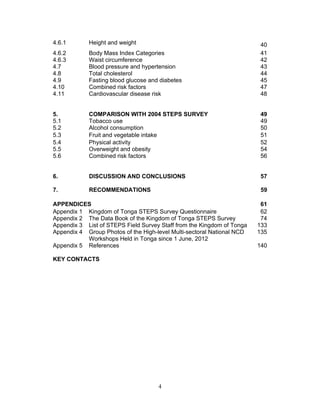
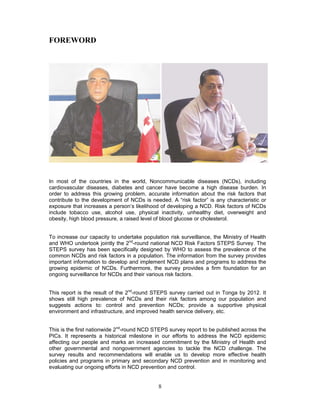
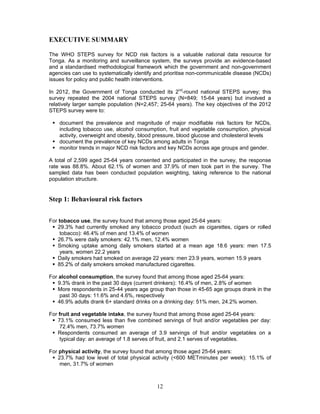
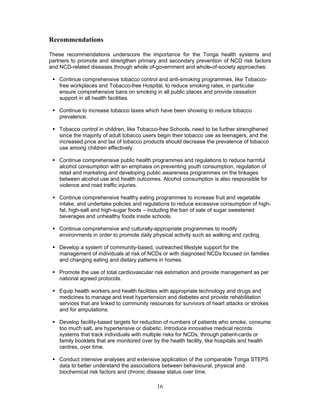
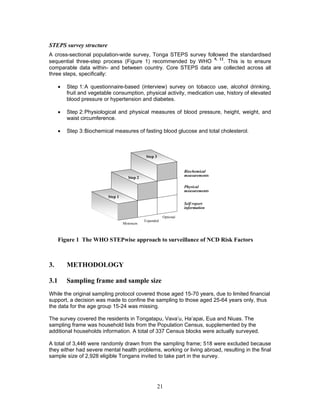
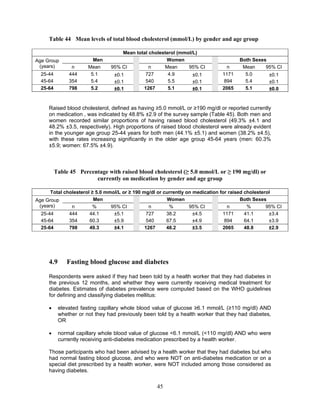
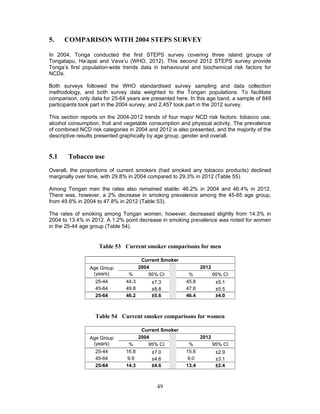
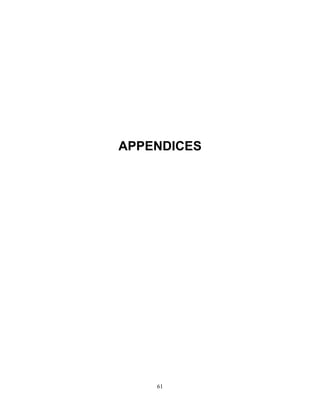
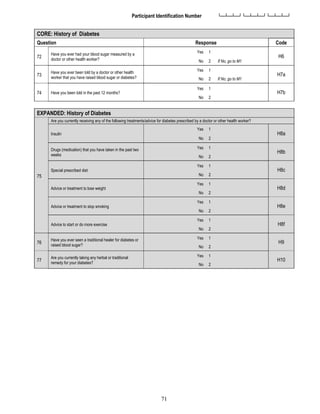
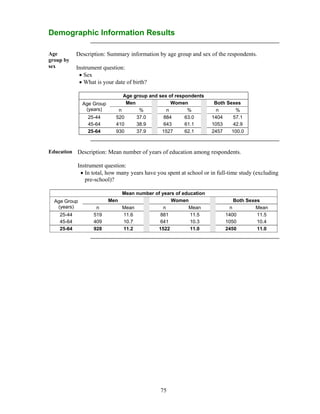
CORE: Physical Activity
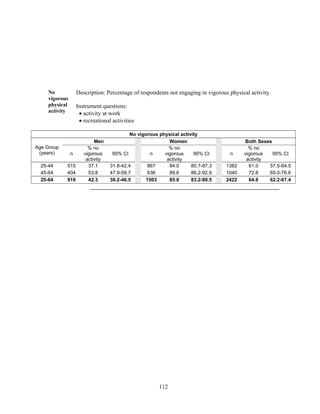
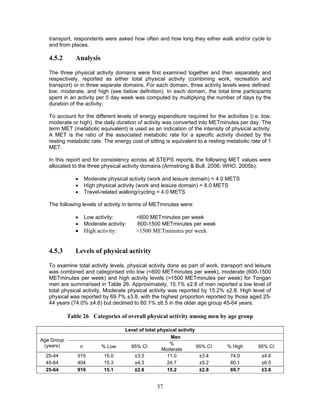
Next I am going to ask you about the time you spend doing different types of physical activity in a typical week. Please answer these questions
even if you do not consider yourself to be a physically active person.
Think first about the time you spend doing work. Think of work as the things that you have to do such as paid or unpaid work, study/training,
household chores, harvesting food/crops, fishing or hunting for food, seeking employment. In answering the following questions 'vigorous-
intensity activities' are activities that require hard physical effort and cause large increases in breathing or heart rate, 'moderate-intensity
activities' are activities that require moderate physical effort and cause small increases in breathing or heart rate.
Question Response Code
Work
50
Does your work involve vigorous-intensity activity that
causes large increases in breathing or heart rate like
[carrying or lifting heavy loads, digging or construction
work] for at least 10 minutes continuously?
(USE SHOWCARD)
Yes 1
P1
No 2 If No, go to P 4
51
In a typical week, on how many days do you do
vigorous-intensity activities as part of your work? Number of days
└─┘
P2
52
How much time do you spend doing vigorous-intensity
activities at work on a typical day? Hours : minutes └─┴─┘: └─┴─┘
hrs mins
P3
(a-b)
53
Does your work involve moderate-intensity activity, that
causes small increases in breathing or heart rate such
as brisk walking [or carrying light loads] for at least 10
minutes continuously?
(USE SHOWCARD)
Yes 1
P4
No 2 If No, go to P 7
54
In a typical week, on how many days do you do
moderate-intensity activities as part of your work?
Number of days
└─┘
P5
55
How much time do you spend doing moderate-intensity
activities at work on a typical day? Hours : minutes └─┴─┘: └─┴─┘
hrs mins
P6
(a-b)
Travel to and from places
The next questions exclude the physical activities at work that you have already mentioned.
Now I would like to ask you about the usual way you travel to and from places. For example to work, for shopping, to market, to place of
worship.
56
Do you walk or use a bicycle (pedal cycle) for at least
10 minutes continuously to get to and from places?
Yes 1
P7
No 2 If No, go to P 10
57
In a typical week, on how many days do you walk or
bicycle for at least 10 minutes continuously to get to
and from places?
Number of days
└─┘
P8
58
How much time do you spend walking or bicycling for
travel on a typical day? Hours : minutes └─┴─┘: └─┴─┘
hrs mins
P9
(a-b)](https://image.slidesharecdn.com/2012tongastepsreport1-210426054240/85/2012-tonga-steps_report-1-69-320.jpg)
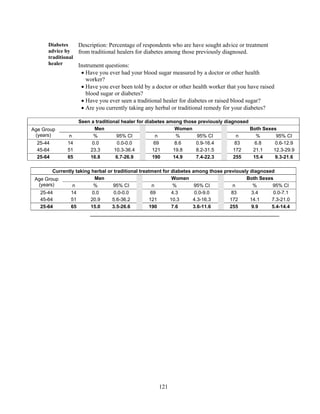
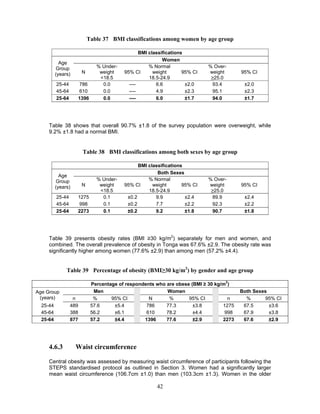
![69
Participant Identification Number └─┴─┴─┘└─┴─┴─┘└─┴─┴─┘
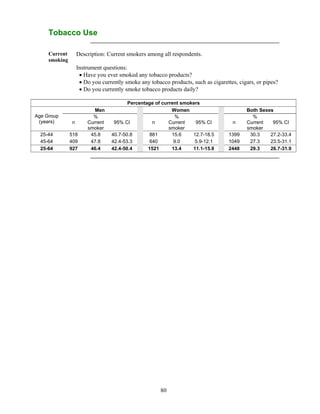
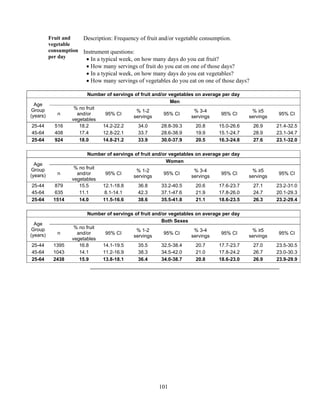
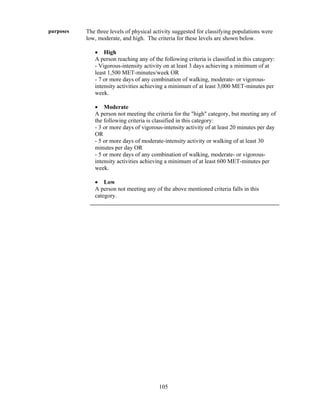
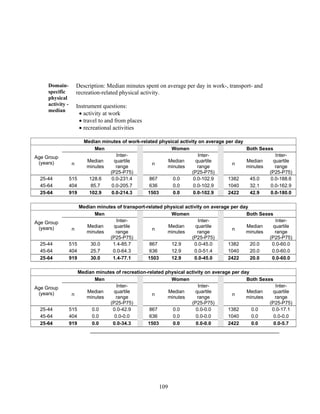
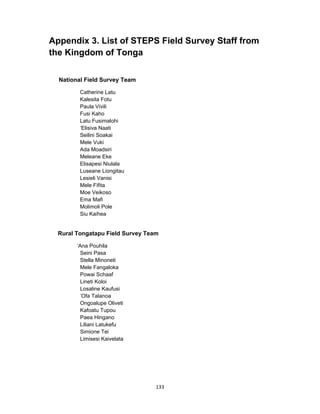
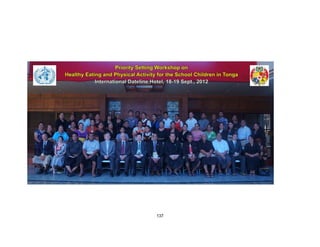
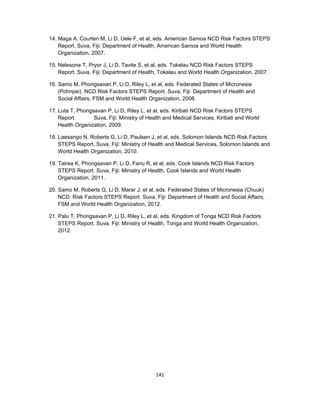
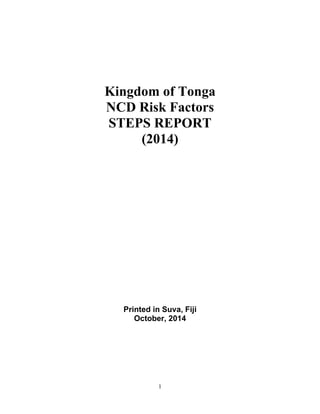
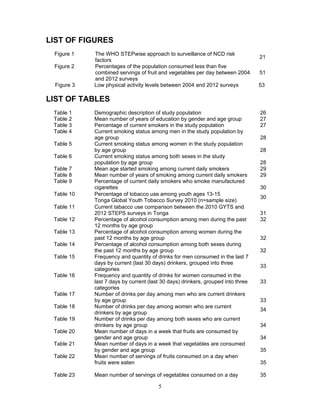
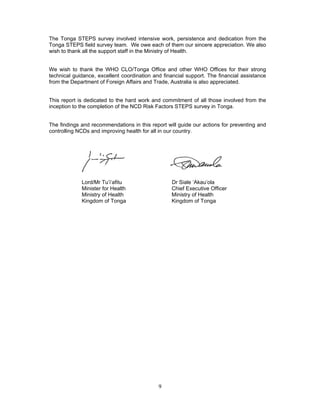
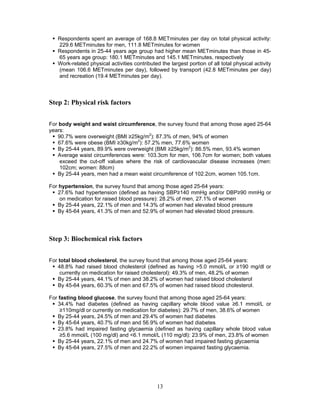
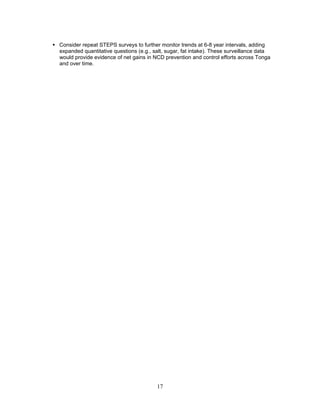
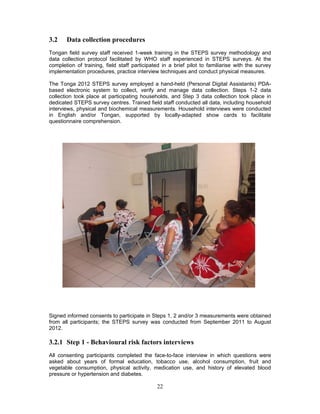
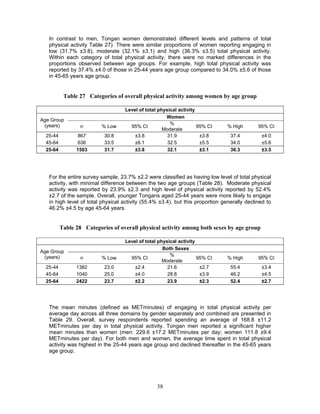
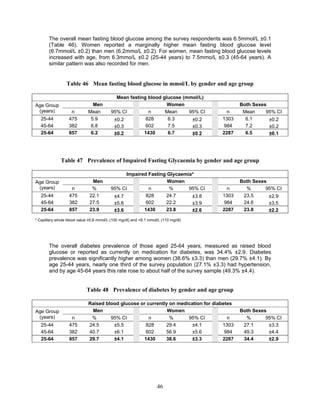
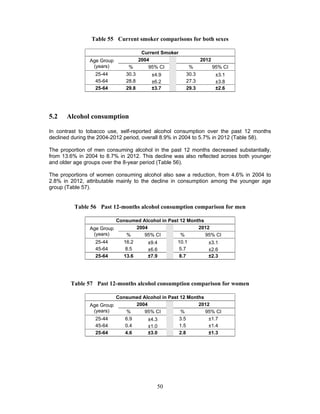
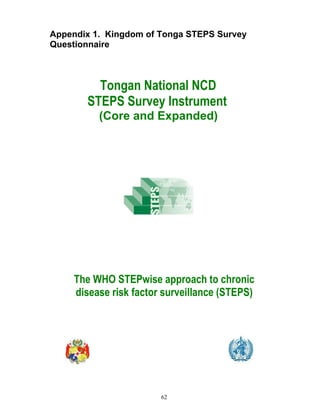
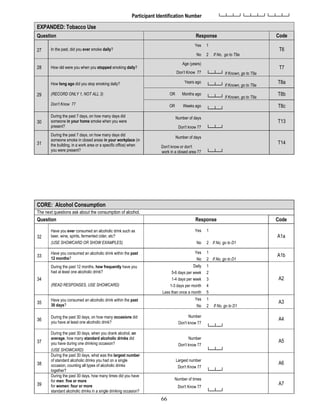
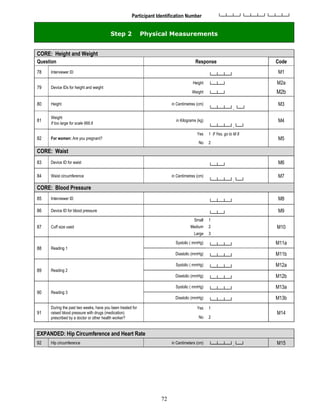
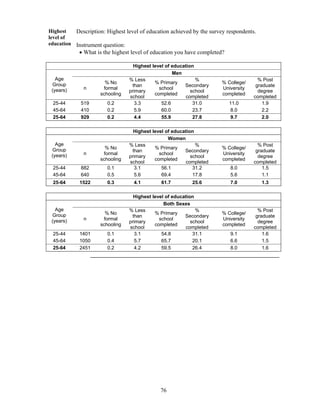
CORE: Physical Activity, Continued
Question Response Code
Recreational activities
The next questions exclude the work and transport activities that you have already mentioned.
Now I would like to ask you about sports, fitness and recreational activities (leisure)
59
Do you do any vigorous-intensity sports, fitness or
recreational (leisure) activities that cause large
increases in breathing or heart rate like [running or
football] for at least 10 minutes continuously?
(USE SHOWCARD)
Yes 1
P10
No 2 If No, go to P 13
60
In a typical week, on how many days do you do
vigorous-intensity sports, fitness or recreational
(leisure) activities?
Number of days
└─┘
P11
61
How much time do you spend doing vigorous-intensity
sports, fitness or recreational activities on a typical day? Hours : minutes └─┴─┘: └─┴─┘
hrs mins
P12
(a-b)
62
Do you do any moderate-intensity sports, fitness or
recreational (leisure) activities that cause a small
increase in breathing or heart rate such as brisk
walking, [cycling, swimming, volleyball] for at least 10
minutes continuously?
(USE SHOWCARD)
Yes 1
P13
No 2 If No, go to P16
63
In a typical week, on how many days do you do
moderate-intensity sports, fitness or recreational
(leisure) activities?
Number of days
└─┘
P14
64
How much time do you spend doing moderate-intensity
sports, fitness or recreational (leisure) activities on a
typical day?
Hours : minutes
└─┴─┘: └─┴─┘
hrs mins
P15
(a-b)
EXPANDED: Physical Activity
Sedentary behaviour
The following question is about sitting or reclining at work, at home, getting to and from places, or with friends including time spent sitting at a
desk, sitting with friends, traveling in car, bus, train, reading, playing cards or watching television, but do not include time spent sleeping. (USE
SHOWCARD)
65
How much time do you usually spend sitting or reclining
on a typical day? Hours : minutes └─┴─┘: └─┴─┘
hrs mins
P16
(a-b)](https://image.slidesharecdn.com/2012tongastepsreport1-210426054240/85/2012-tonga-steps_report-1-70-320.jpg)
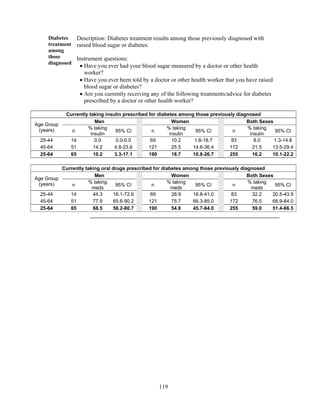
![77
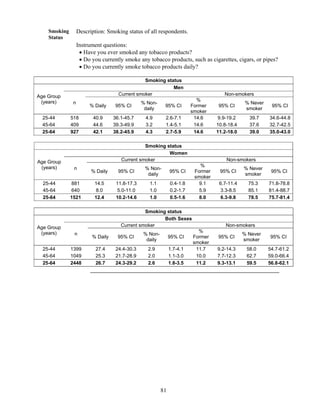
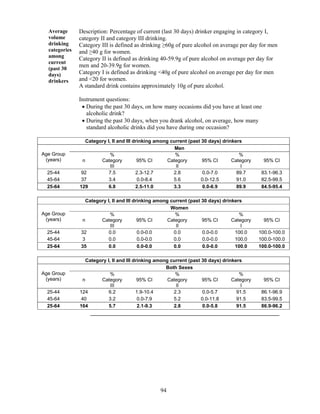
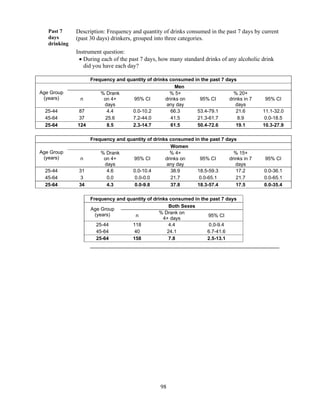
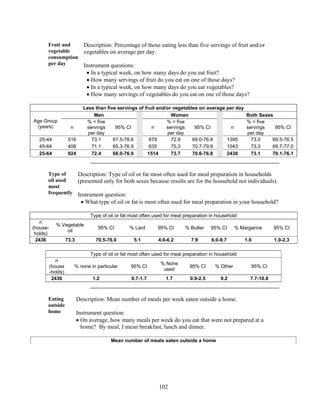
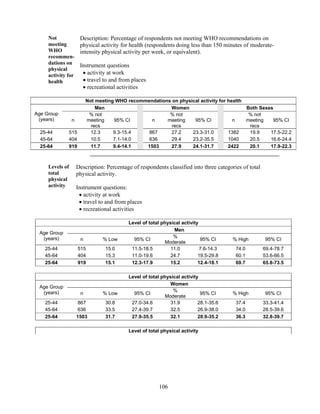
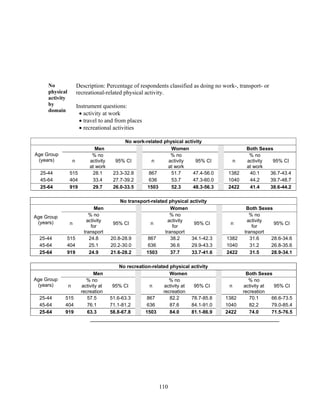
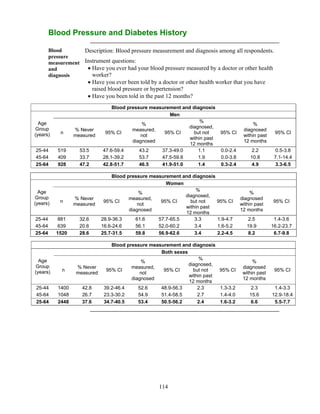
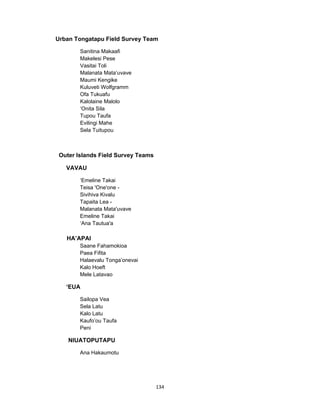
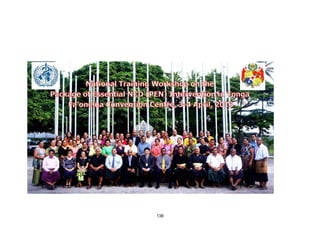
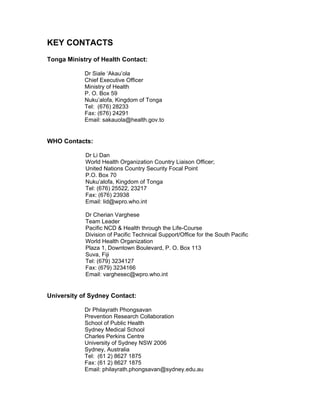
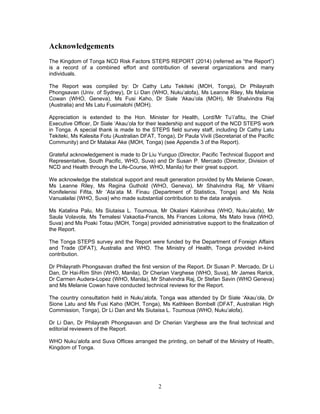
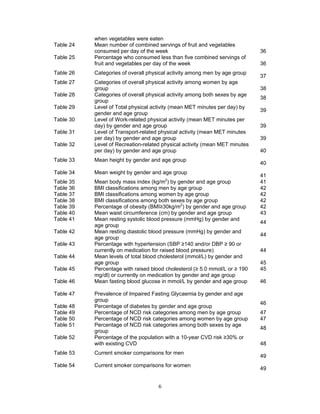
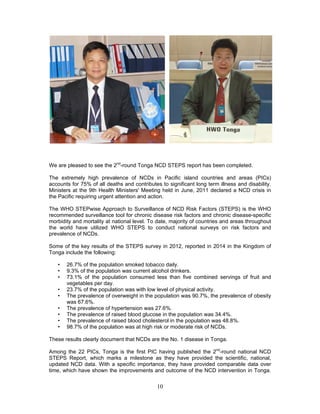
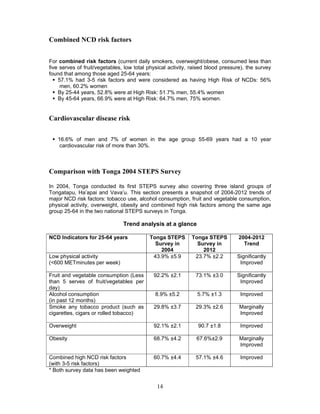
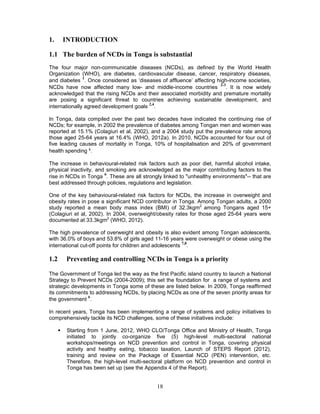
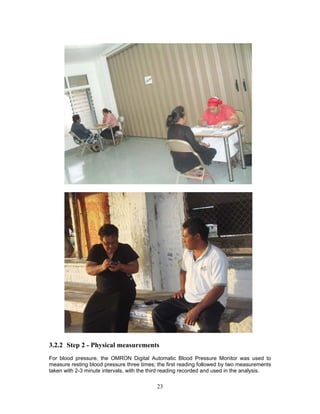
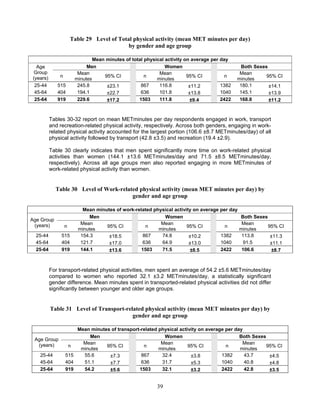
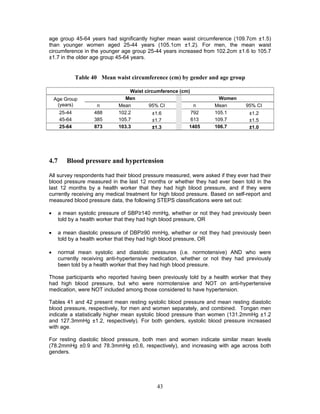
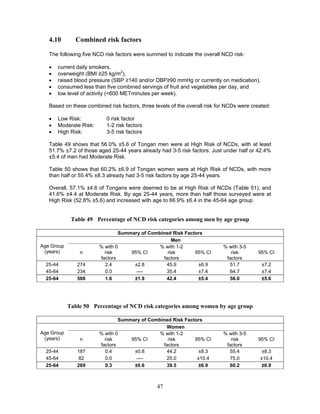
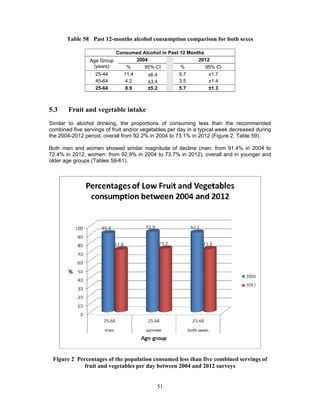
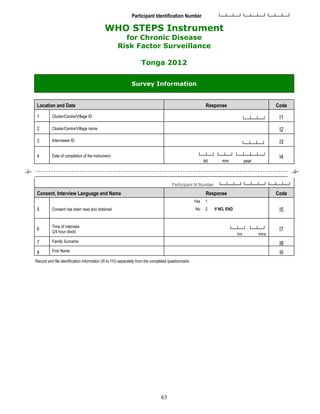
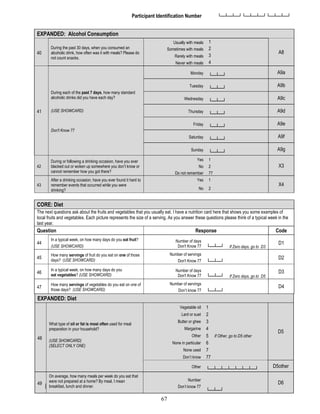
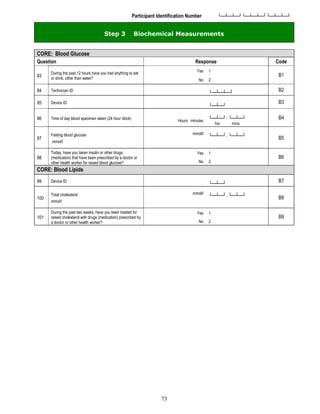
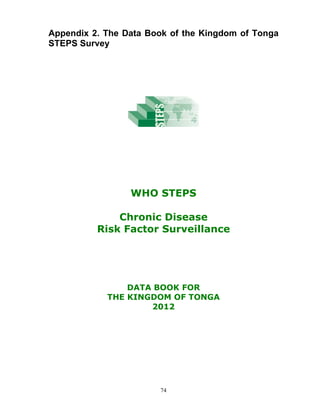
Ethnicity Description: Summary results for the ethnicity of the respondents.
Instrument Question:
What is your [insert relevant ethnic group/racial group/cultural subgroup/others]
background?
Ethnic group of respondents
Age Group
(years)
Both Sexes
n % Tongan % Non-Tongan
25-44 1401 98.1 1.9
45-64 1051 98.8 1.2
25-64 2452 98.4 1.6
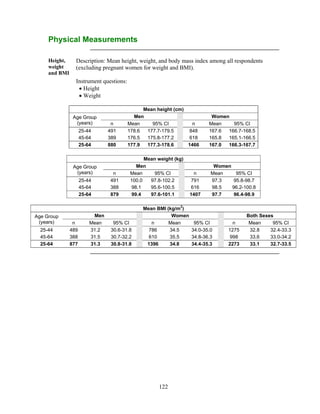
Marital
status
Description: Marital status of survey respondents.
Instrument question:
What is your marital status?
Marital status
Age
Group
(years)
Men
n
% Never
married
%
Currently
married
%
Separated
% Divorced
%
Widowed
%
Cohabiting
25-44 519 15.4 81.1 2.5 0.6 0.4 0.0
45-64 410 3.9 89.8 0.5 1.5 4.1 0.2
25-64 929 10.3 84.9 1.6 1.0 2.0 0.1
Marital status
Age
Group
(years)
Women
n
% Never
married
%
Currently
married
%
Separated
% Divorced
%
Widowed
%
Cohabiting
25-44 882 13.6 80.2 2.2 2.3 1.8 0.0
45-64 641 8.4 71.6 3.3 2.3 13.7 0.6
25-64 1523 11.4 76.6 2.6 2.3 6.8 0.3
Marital status
Age
Group
(years)
Both Sexes
n
% Never
married
%
Currently
married
%
Separated
% Divorced
%
Widowed
%
Cohabiting
25-44 1401 14.3 80.5 2.3 1.6 1.3 0.0
45-64 1051 6.7 78.7 2.2 2.0 10.0 0.5
25-64 2452 11.0 79.7 2.2 1.8 5.0 0.2](https://image.slidesharecdn.com/2012tongastepsreport1-210426054240/85/2012-tonga-steps_report-1-78-320.jpg)