
Download to read offline
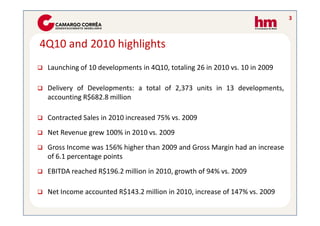
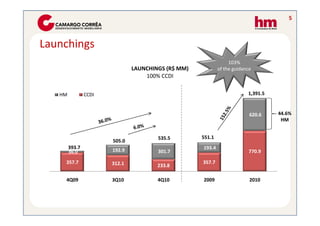
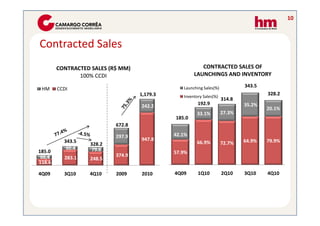
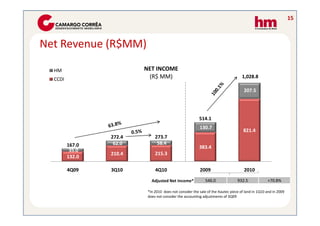
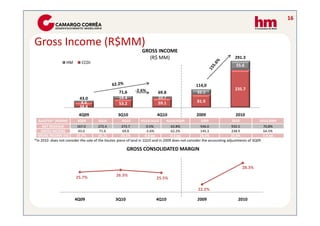
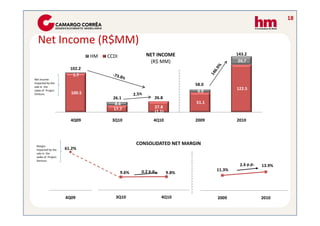
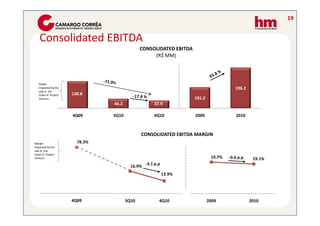
HM reported its financial results for the fourth quarter and full year of 2010. Some highlights include: - Launching of 10 developments in the fourth quarter totaling 26 for the full year 2010, compared to 10 in 2009. - Delivery of 2,373 units in 13 developments in 2010, generating R$682.8 million in revenue. - Contracted sales in 2010 increased 75% compared to 2009. - Net revenue grew 100% in 2010 versus 2009. Gross income was 156% higher and gross margin increased 6.1 percentage points. - EBITDA reached R$196.2 million in 2010, growing 94% compared to 2009. Net income accounted for R$143


