Downloaded 23 times
![2
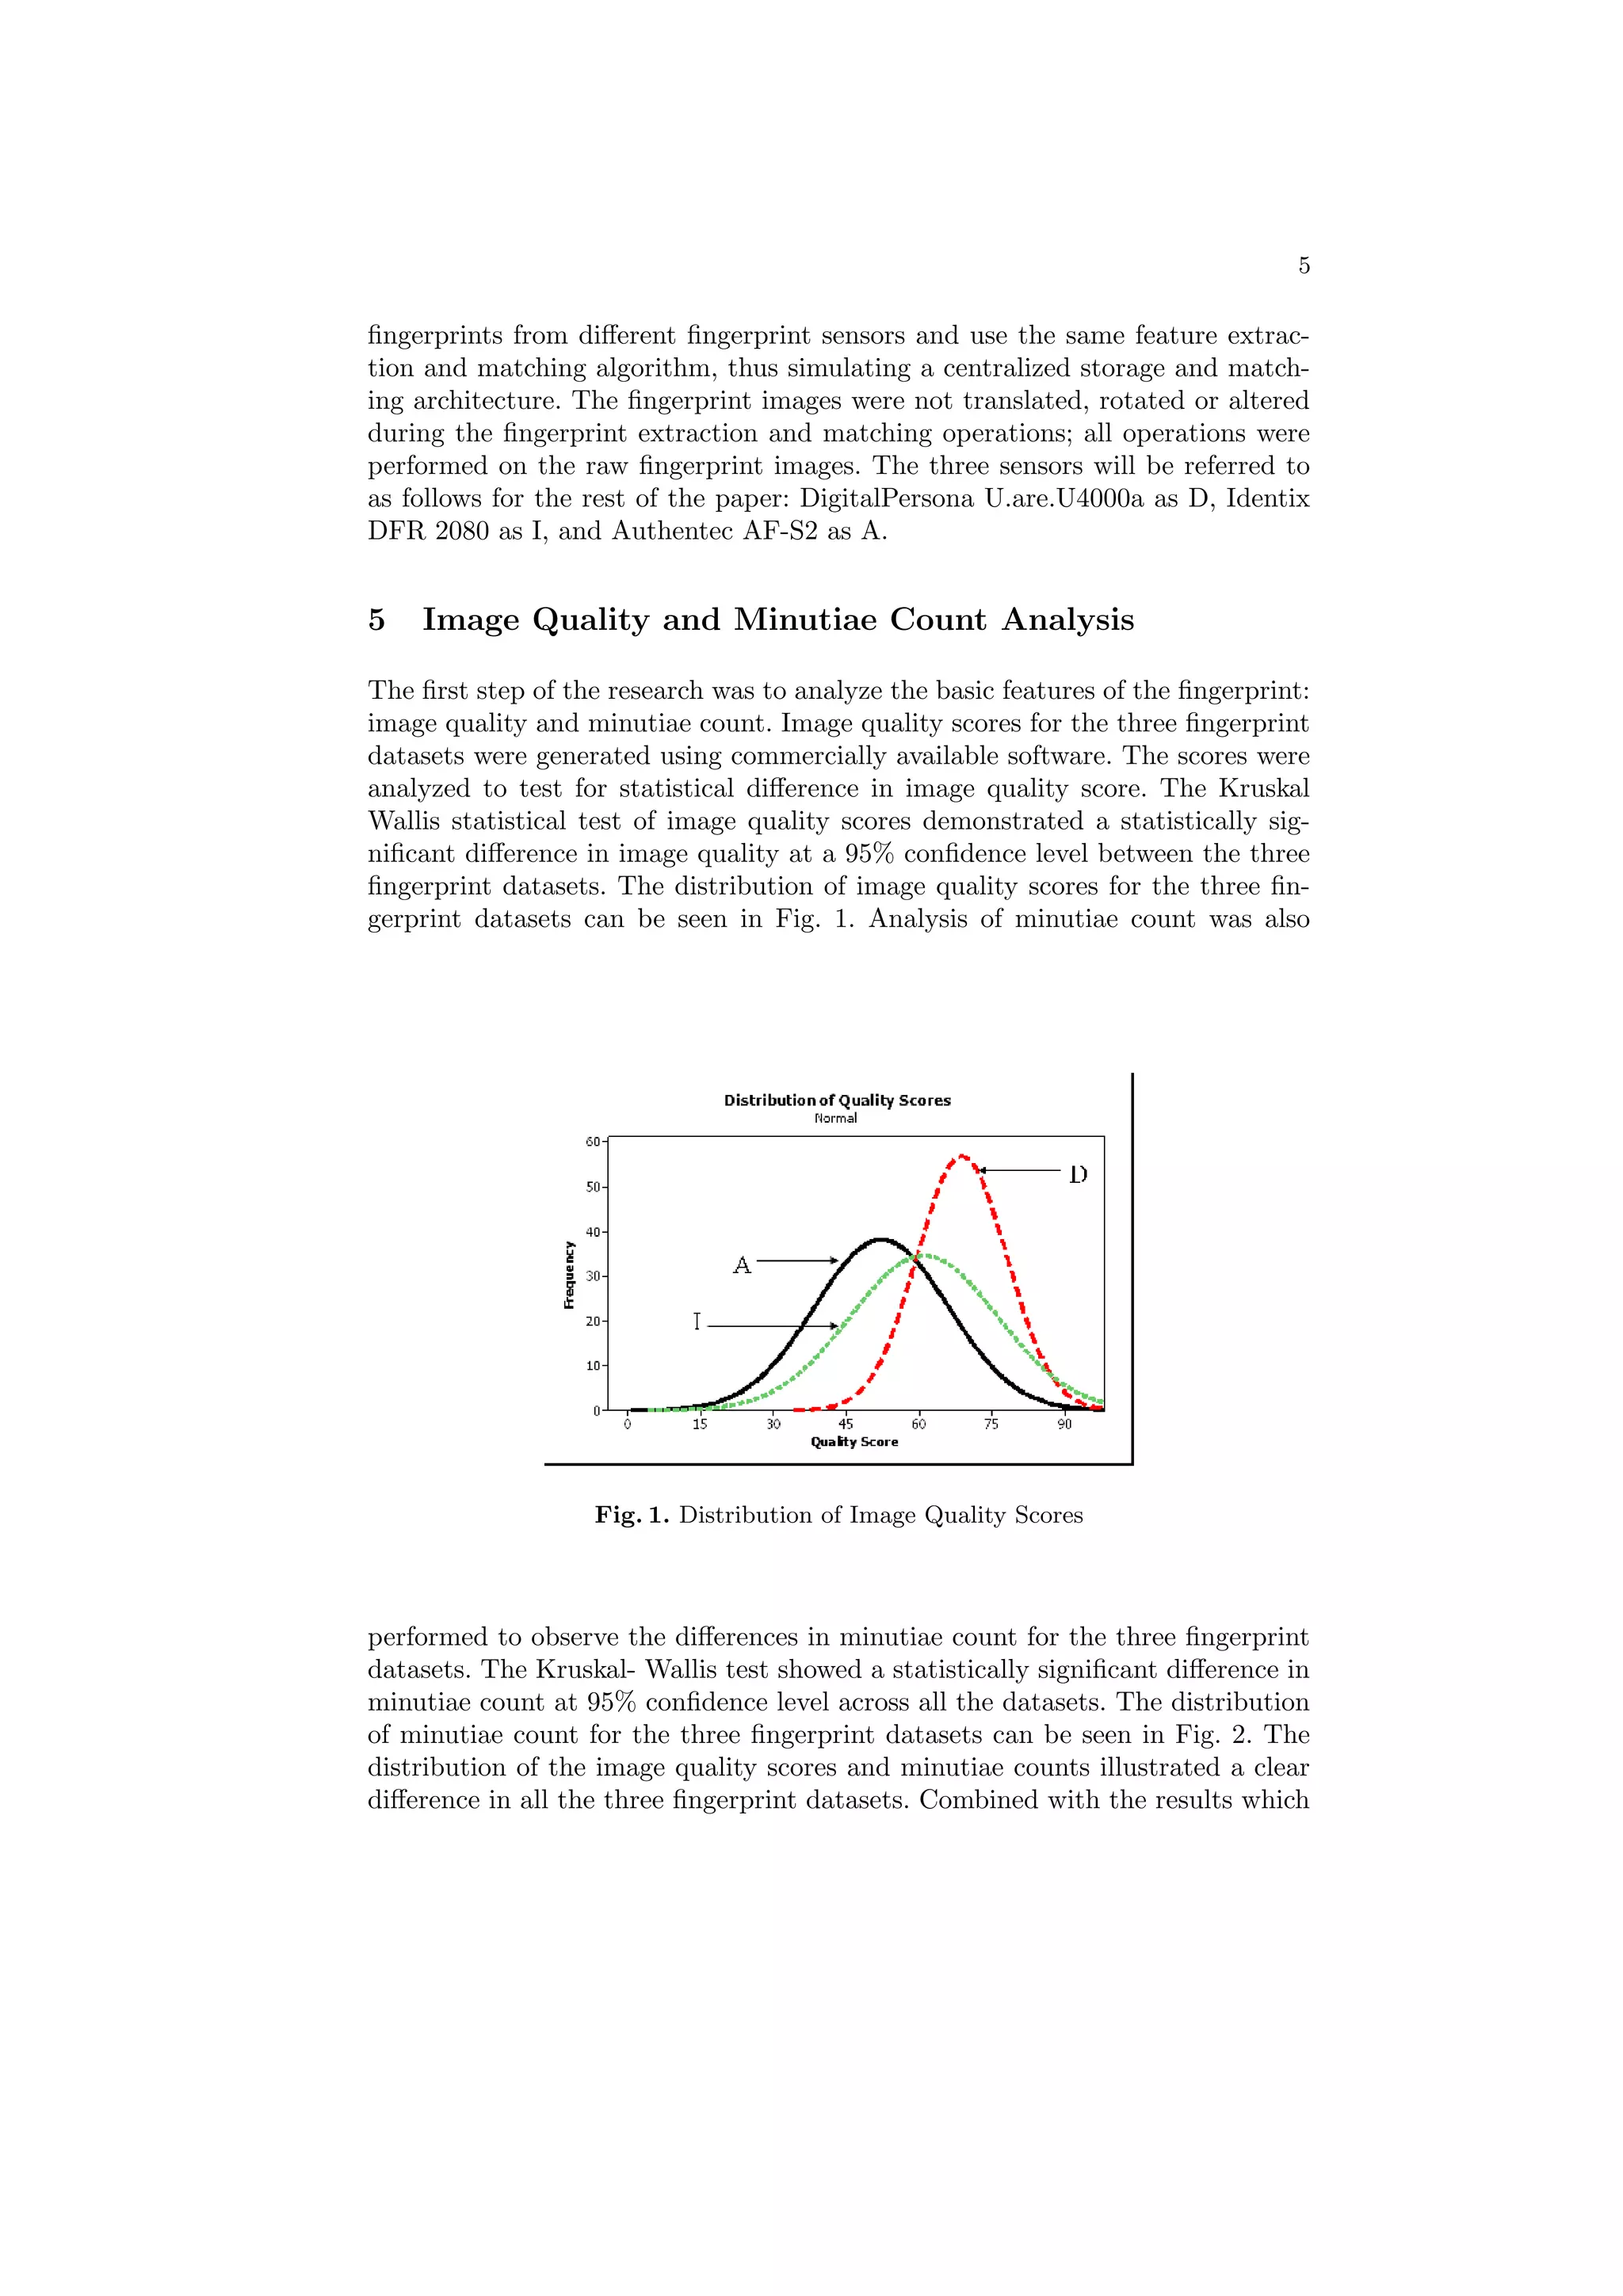
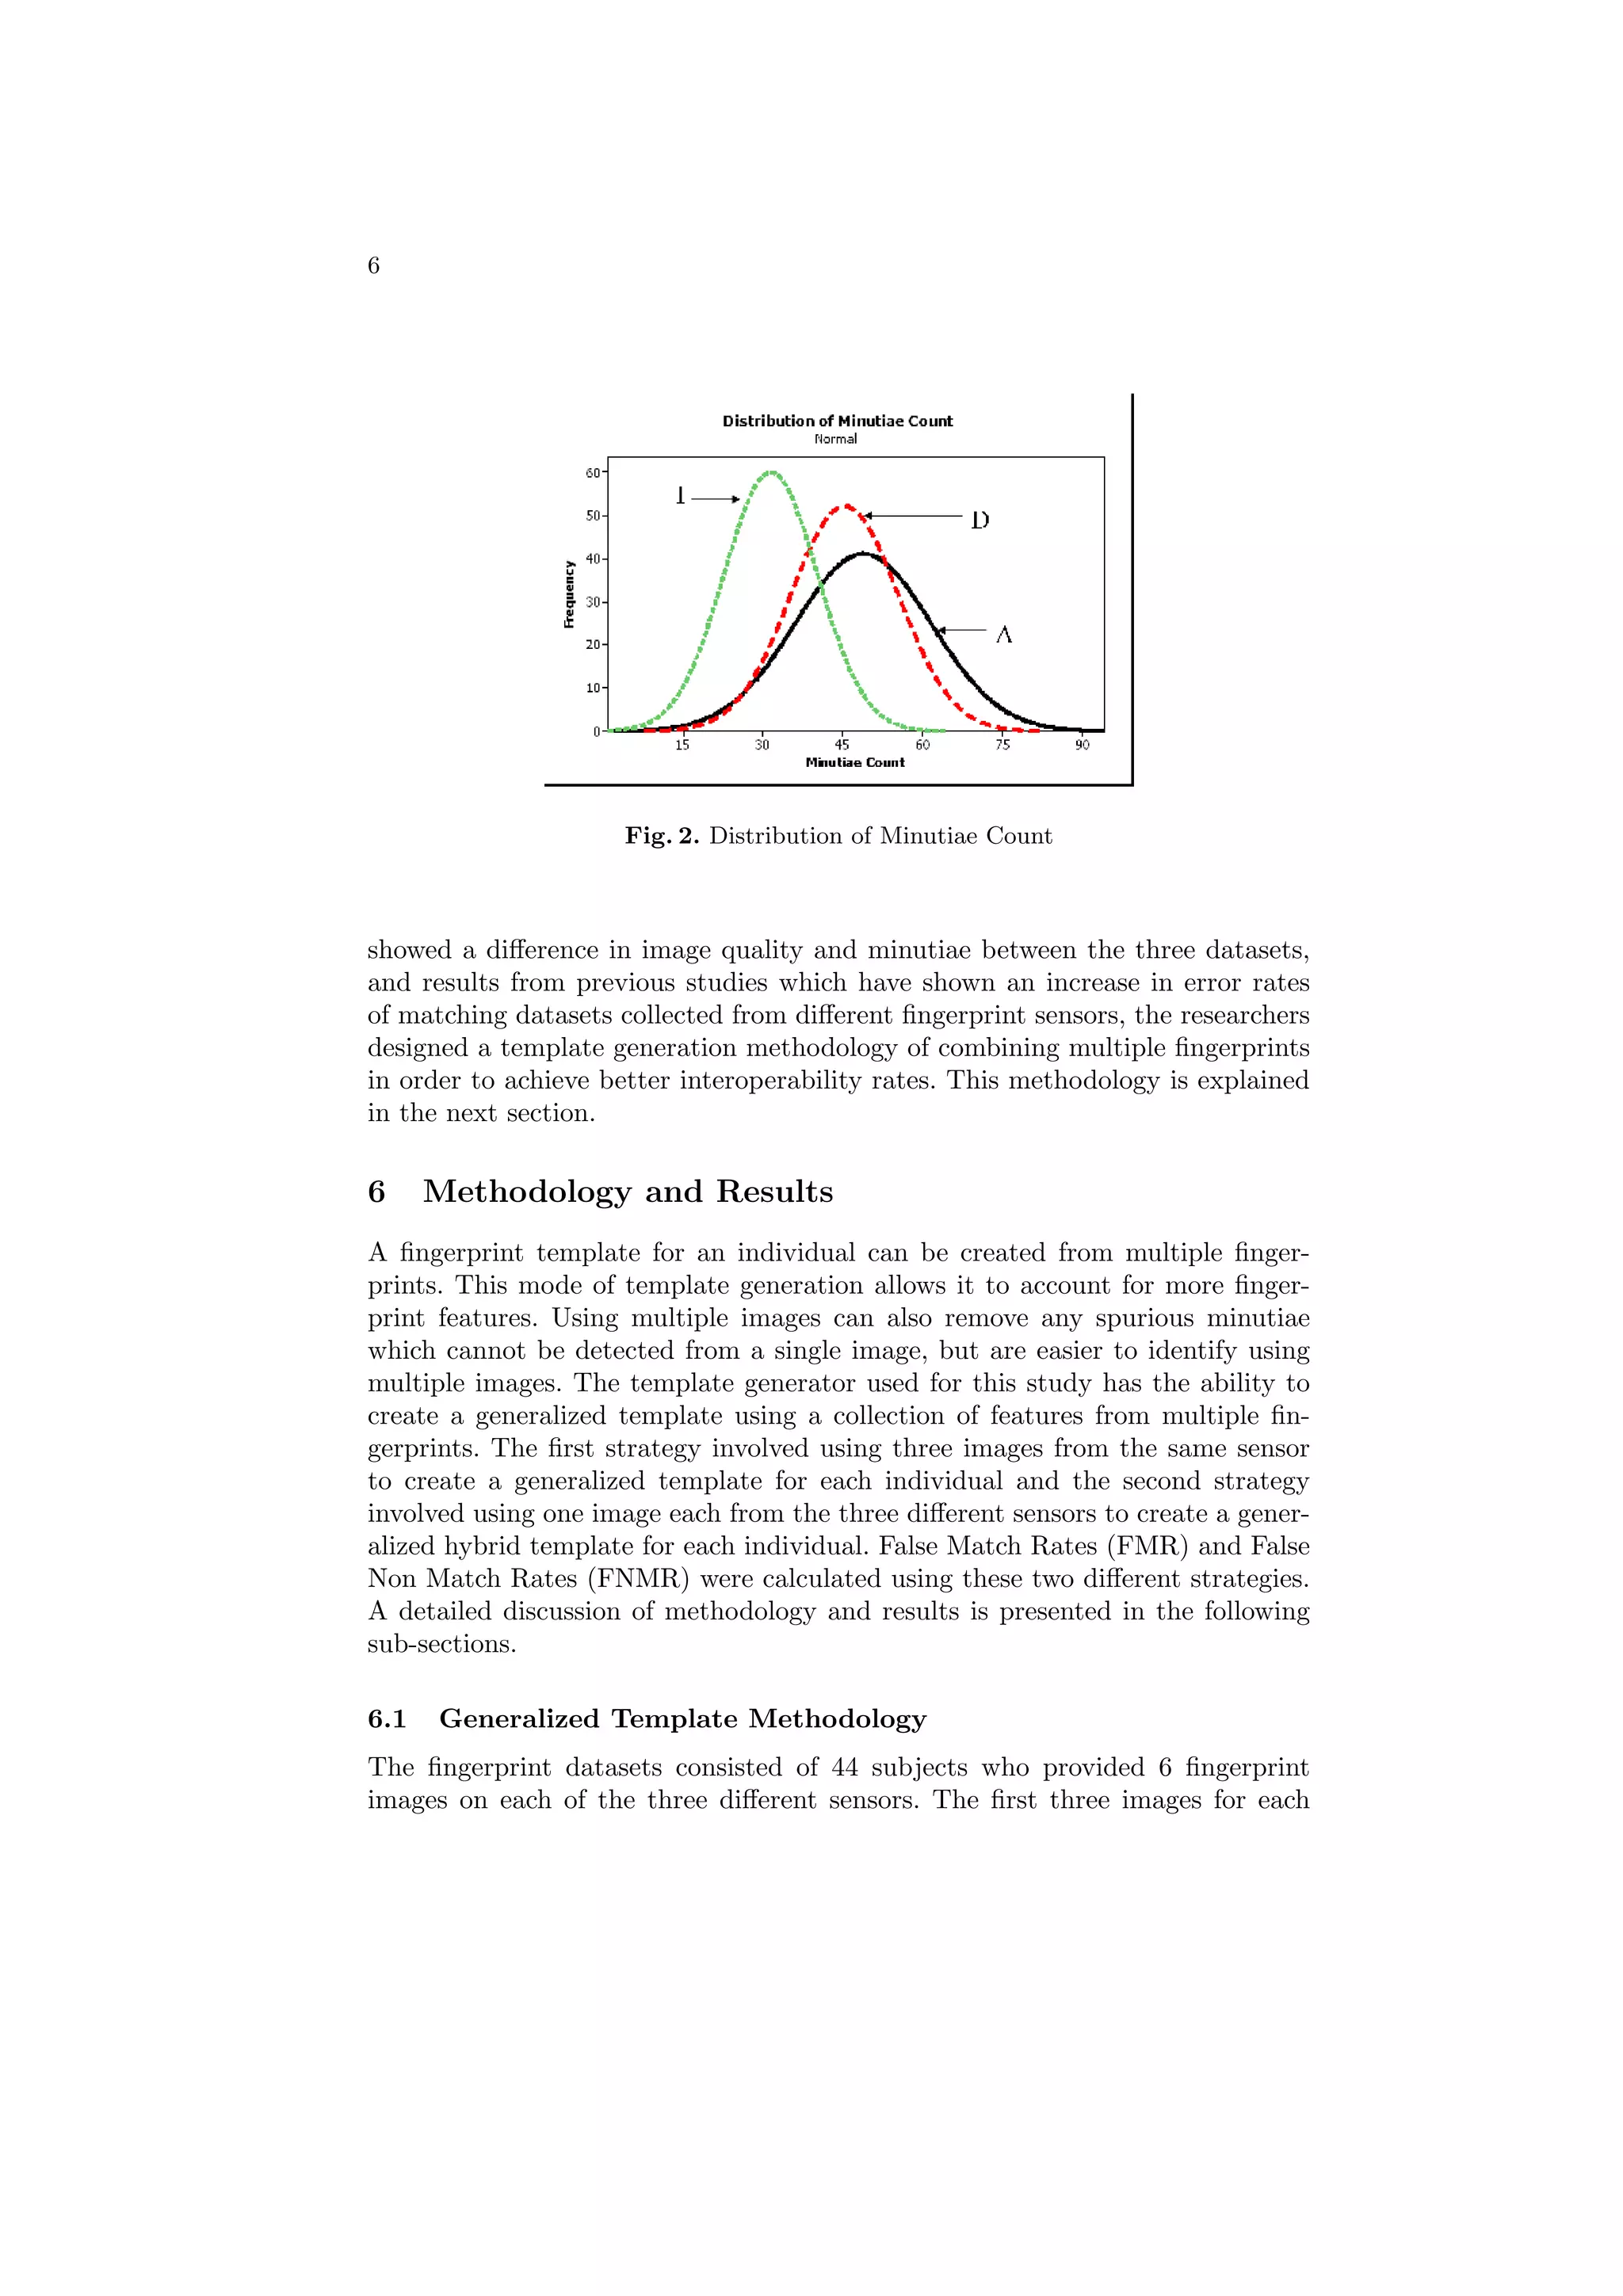
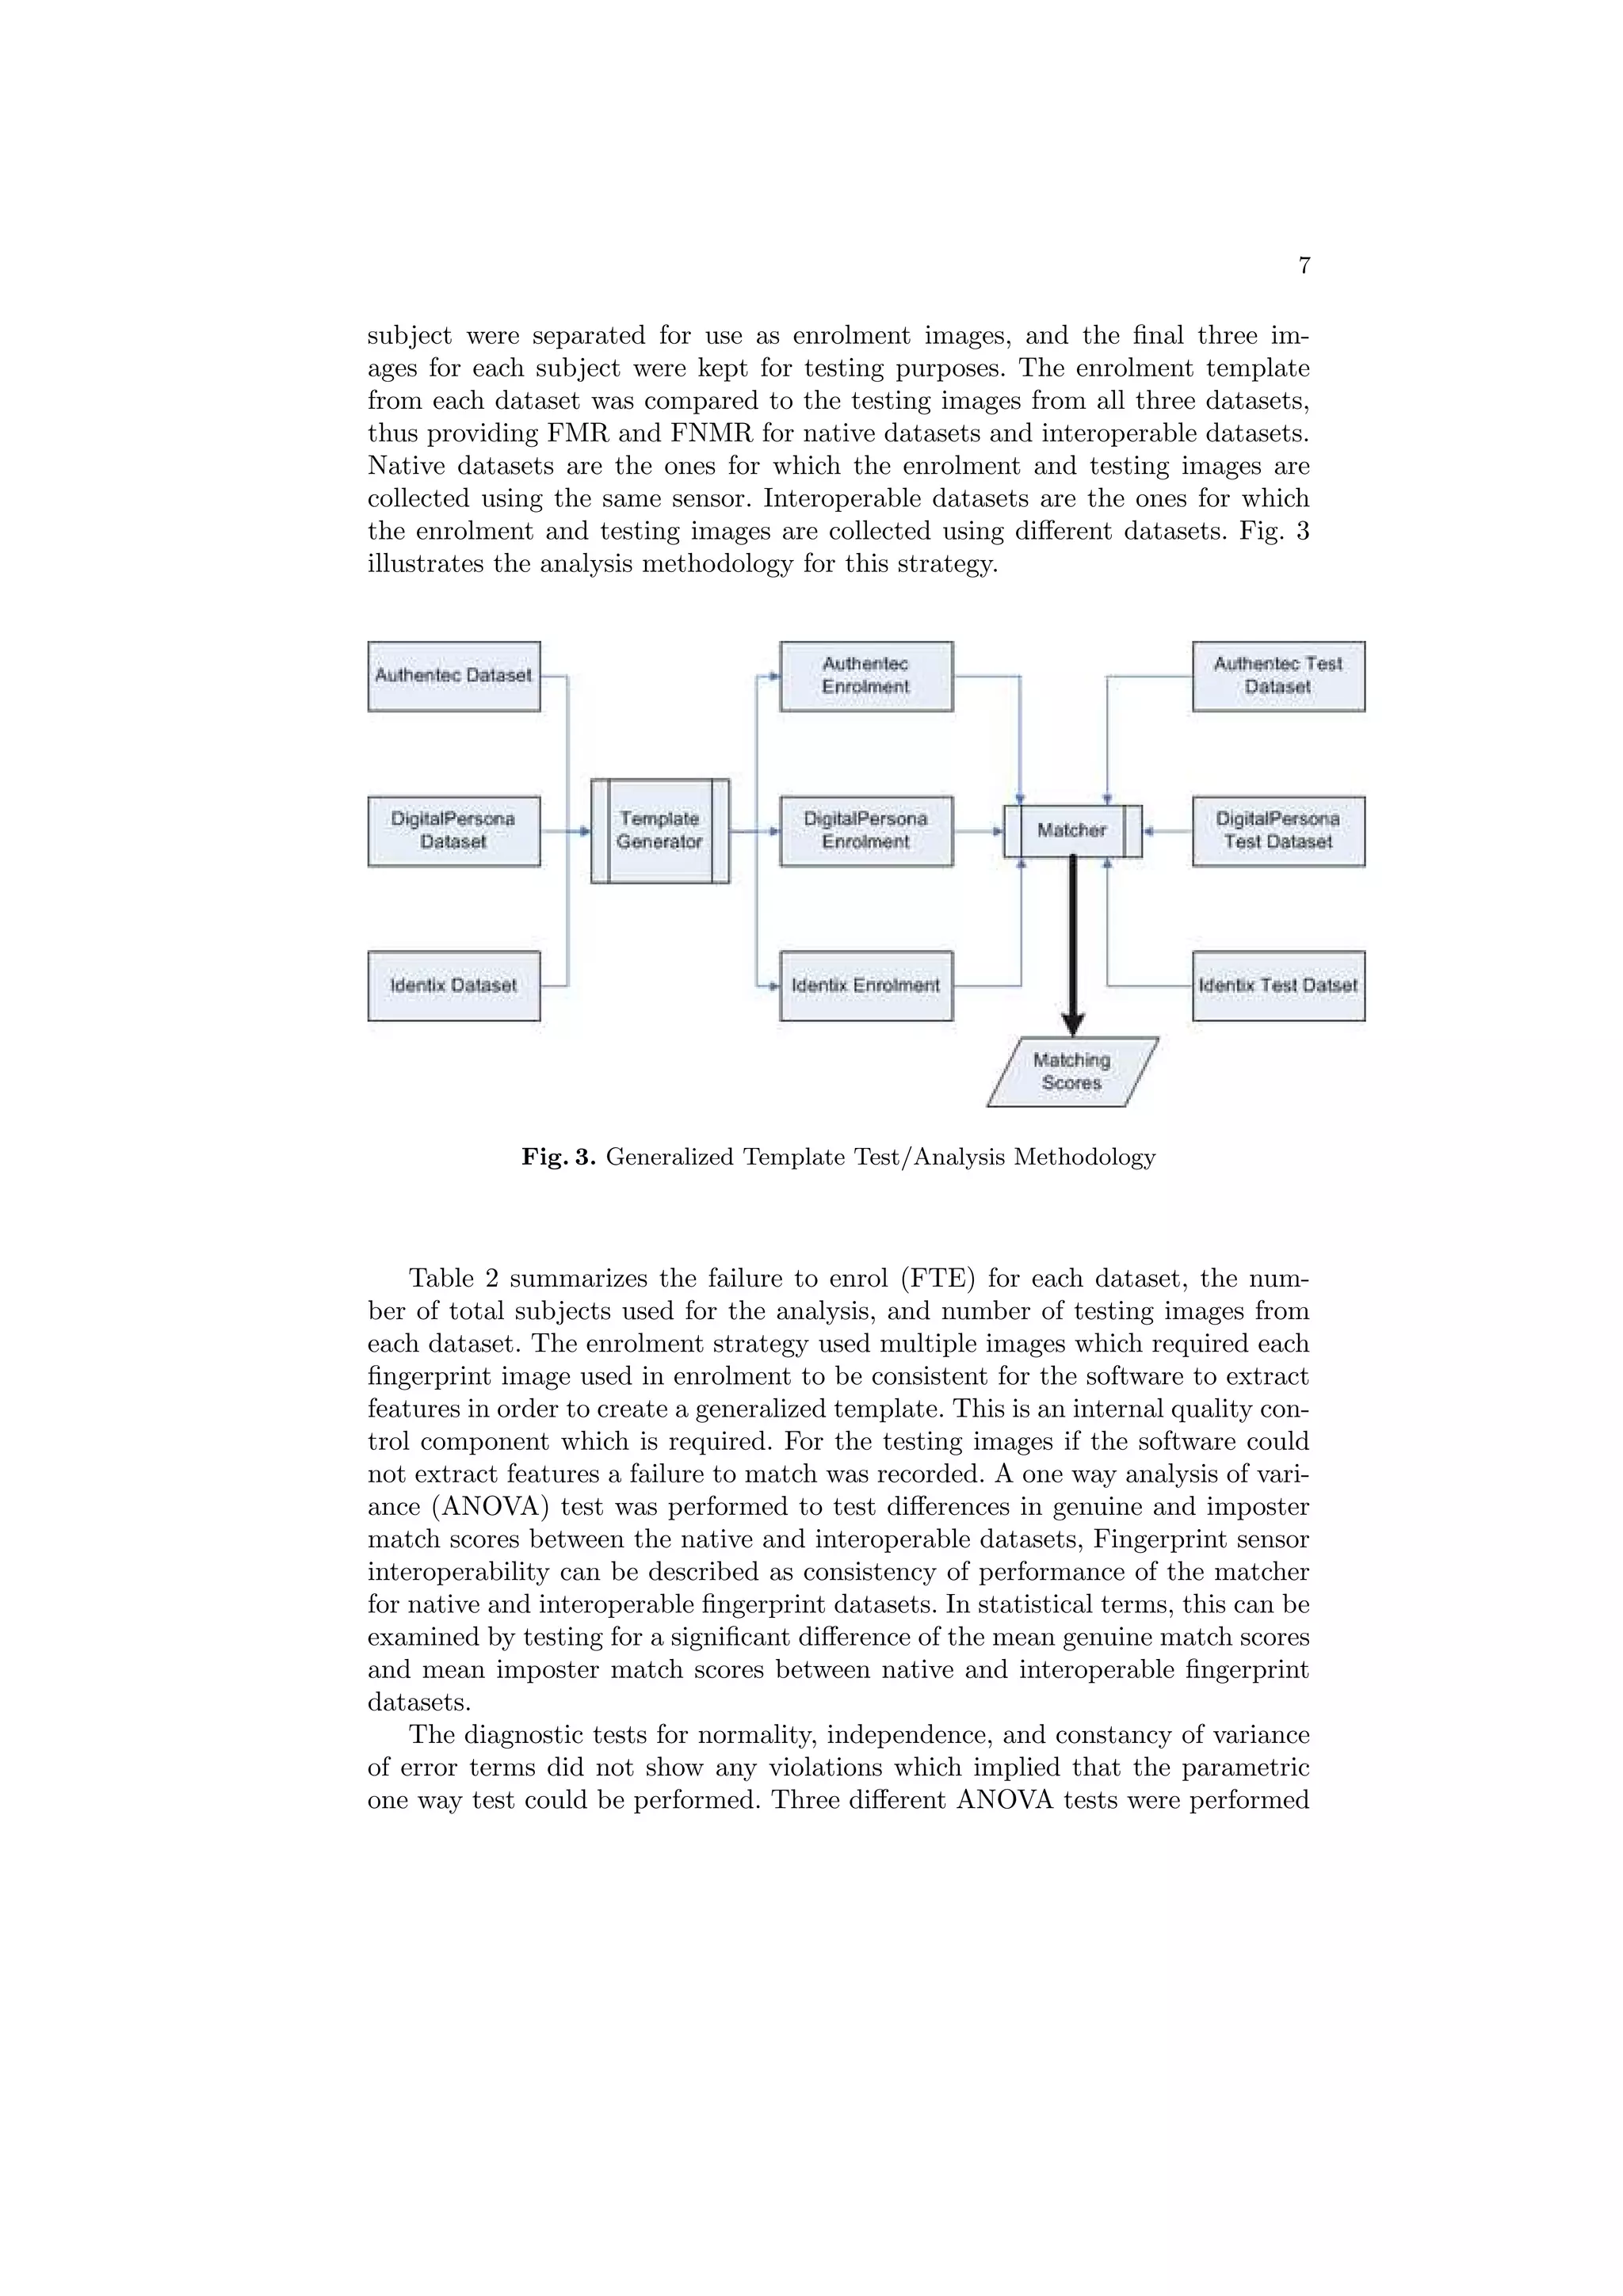
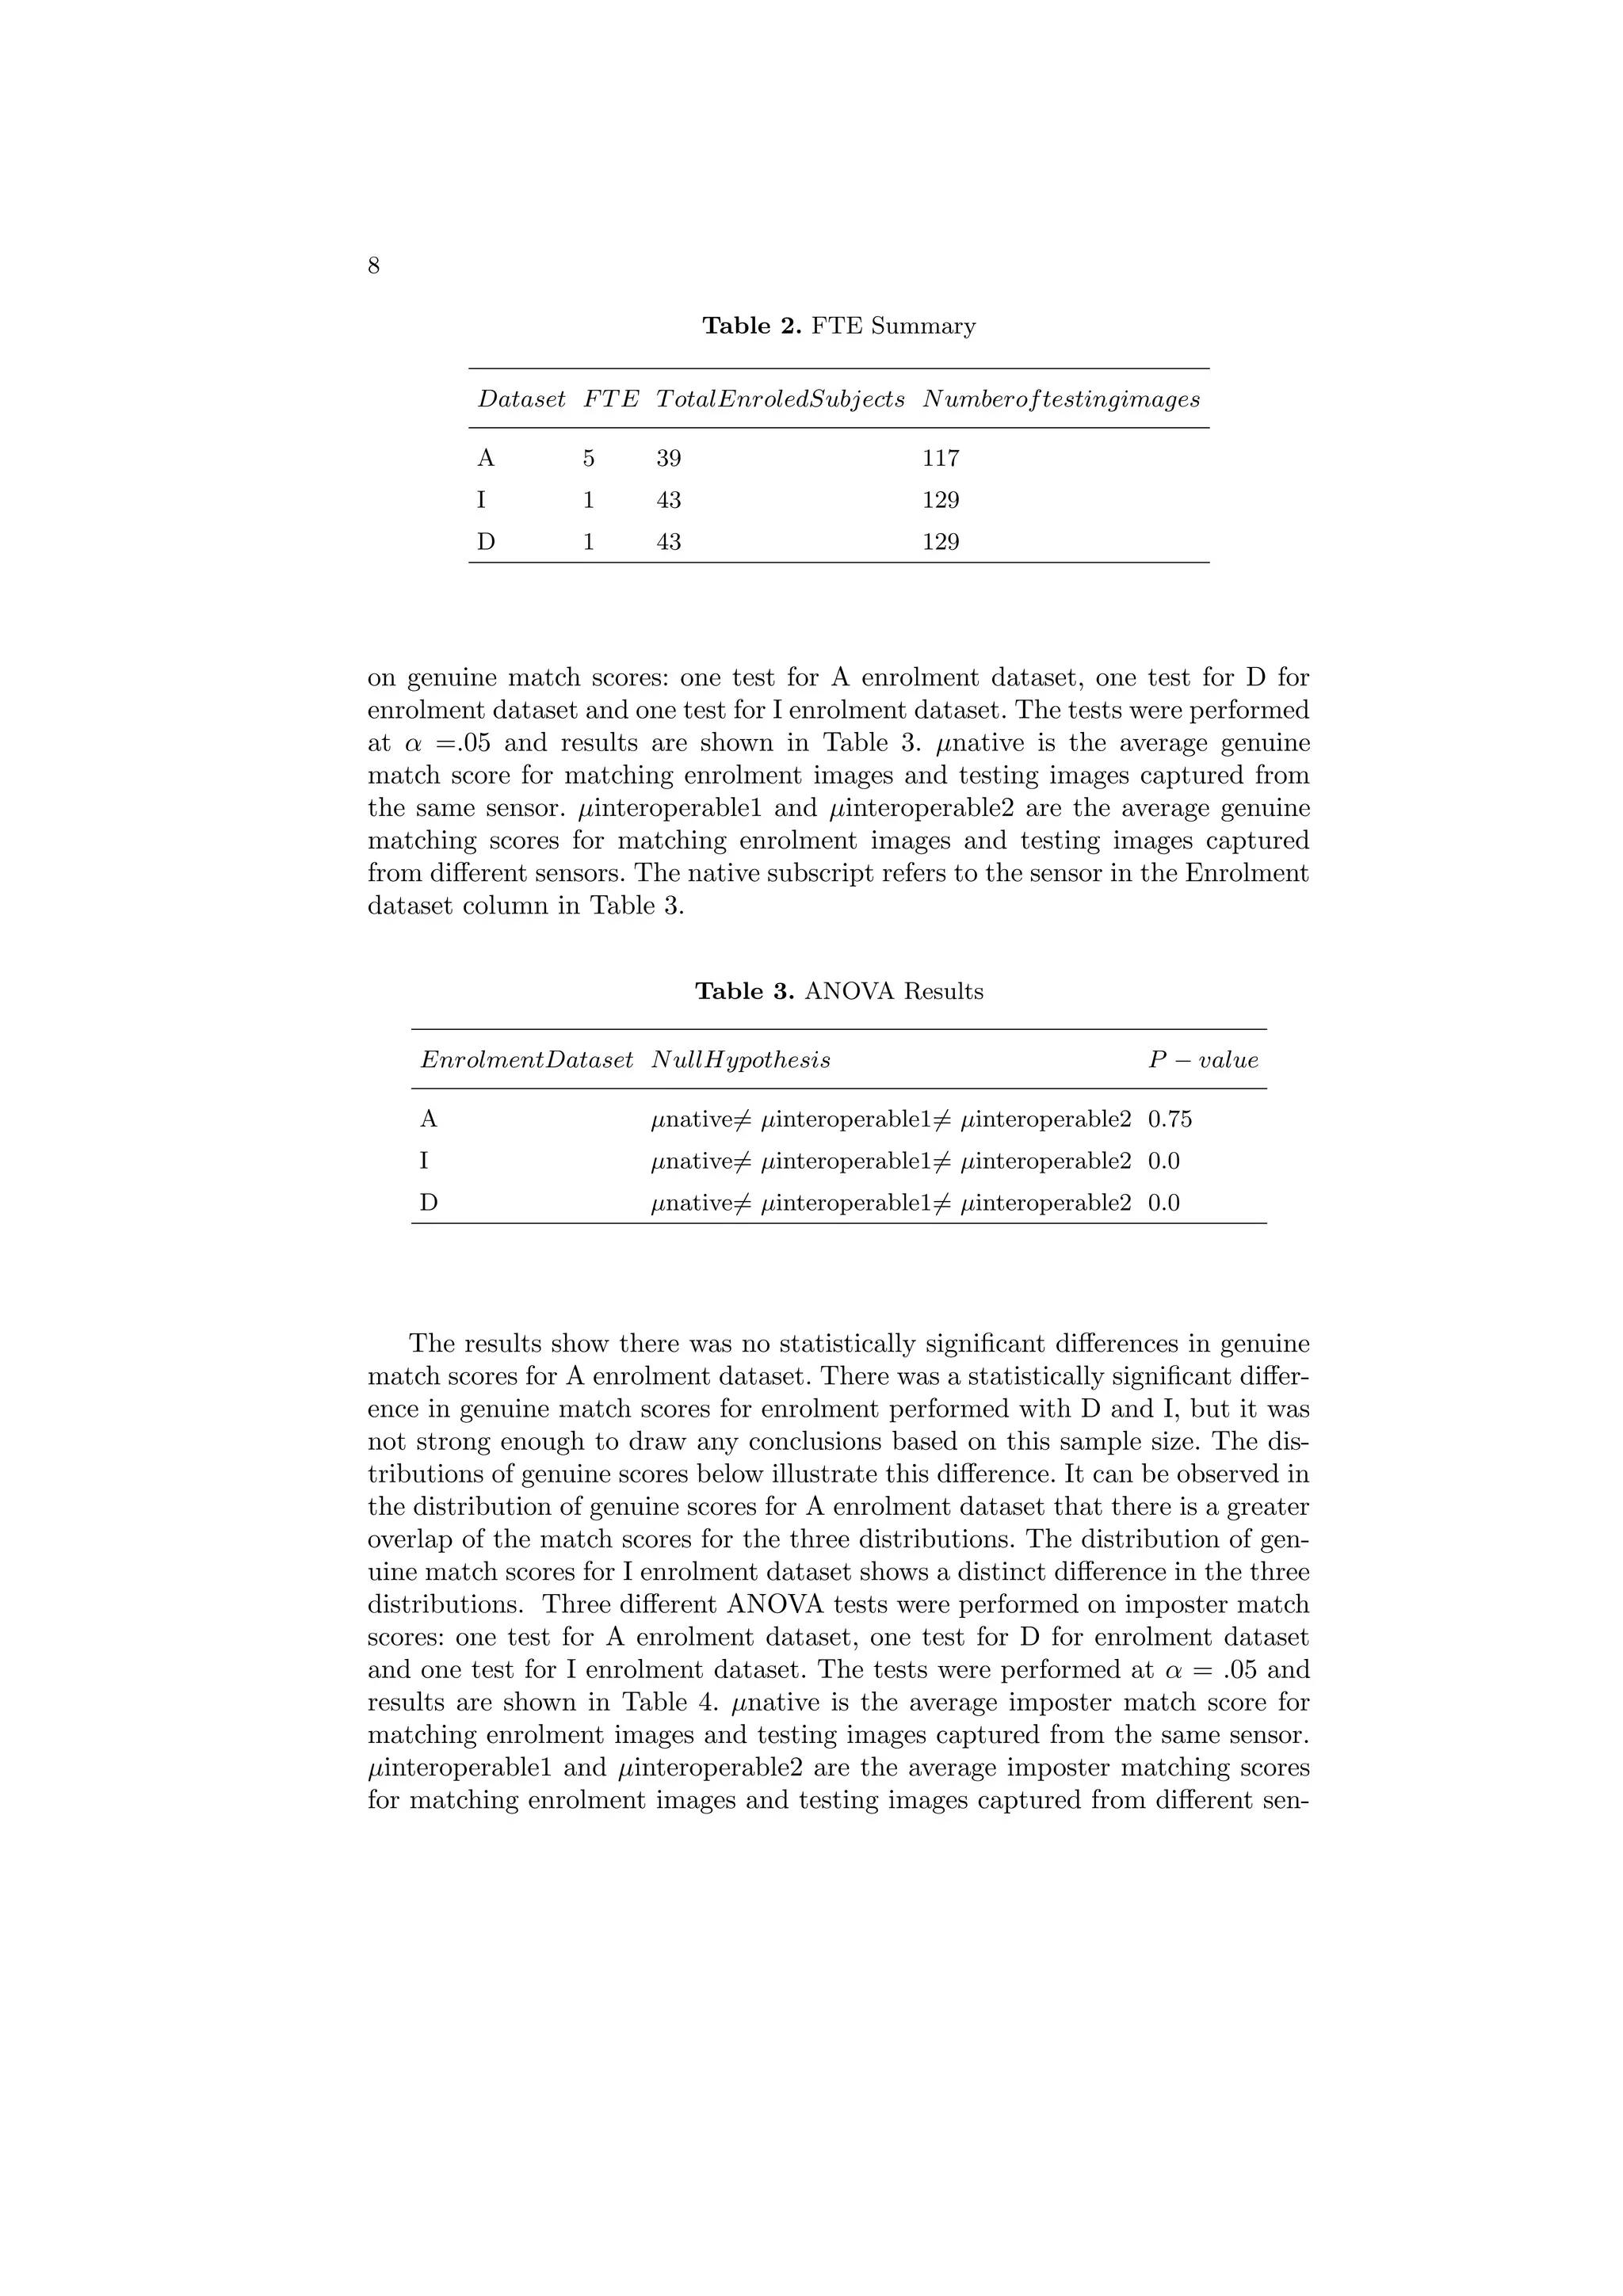
based on a variety of different technologies such as optical, capacitive, thermal,
or others. The physics behind these technologies introduces distortions and vari-
ations in the captured images which are characteristic of the technology, and
since the acquisition subsystem is the first point of contact between the user
and the systems, it is responsible for introducing part or all of the distortion.
Fingerprint recognition systems are the most widely deployed and commercially
available biometric systems, which makes interoperability germane for a number
of constituencies [4]. Taking a financial institution as an example of the need
for interoperability, some institutions are starting to deploy Automated Teller
Machines (ATM) which use fingerprint recognition for authenticating customers.
Such a system can be designed to take advantage of distributed acquisition archi-
tecture and use a centralized storage and matching architecture. Without proper
understanding of how fingerprints captured from different sensors affect the over-
all recognition rates, the financial institution would be forced to deploy the same
fingerprint sensor at all the ATMs. The effect of using different fingerprint sen-
sors for enrolment and recognition purposes on recognition rates is understood
but not well enough for it to be estimable. This requires an extraordinary level
of confidence and trust in the fingerprint sensor manufacturer in order to choose
just a single manufacturer. This could also be a hurdle to mass absorption of
this technology. If the sensor manufacturer was to stop supporting the particular
fingerprint sensors, the financial institution would be forced to replace all the
sensors and re-enrol all its clients. This could be a massive capital and labor cost
and could be a deterrent to using this technology. There is need to understand
the effect of different fingerprints on recognition rates not just from an algorithm
advancement perspective, but also from a technology usage perspective. The fo-
cus of this study was to gain further understanding into effect of sensor specific
distortions on recognition error rates and understand how to lower recognition
error rates for fingerprint datasets acquired from different fingerprint sensors.
This study did not attempt to study or examine sensor specific variations and
distortions on the fingerprint images itself. This study used two optical sensors
and a capacitive sensor and the results illustrated that fingerprint sensor effects
have a significant impact on error rates for different fingerprint datasets.
2 Review of Related Research
The majority of precision and consistency of feature extraction and matching
in fingerprint recognition depends on the ability of the fingerprint sensor to ac-
quire the fingerprint images. Fingerprint image acquisition is heavily affected
by interaction and contact issues [8]. Inconsistent contact, non-uniform contact
and irreproducible contact are specific issues which can affect fingerprint image
acquisition [3]. The mapping of a 3-D fingerprint shape onto a 2-D image intro-
duces distortions which are not uniform across different sensor technologies. The
inconsistencies introduced during the capture process affect how fingerprints cap-
tured on different sensors are assessed. Jain and Ross evaluated the error rates
for fingerprint matching for fingerprints captured on an optical and capacitive](https://image.slidesharecdn.com/iciss2007modielliottkim-100228075714-phpapp02/75/2007-Performance-Analysis-for-Multi-Sensor-Fingerprint-Recognition-System-2-2048.jpg)
![3
sensor [6]. Their results showed that Equal Error Rate (EER) for matching im-
ages collected from the optical sensor was 6.14% and EER for matching images
collected from the capacitive sensor was 10.39%. The EER for the matching im-
ages collected from optical sensor to capacitive sensor was 23.13%. Nagdir and
Ross have proposed a non-linear calibration scheme based on thin plate splines
to facilitate sensor interoperability for fingerprints [10]. Their calibration model
was designed to be applied to the minutiae dataset and to the fingerprint image
itself. They applied the minutiae and image calibration schemes to fingerprints
collected from an optical sensor and capacitive sensor and matched the cali-
brated images from the two sensors against each other. Their results showed an
increase in Genuine Accept Rate from approximately 30% to 70% for VeriFin-
ger matcher after applying the minutiae calibration model. Ko and Krishnan
illustrate the need to understand the impact on error rates of fingerprints cap-
tured by a new fingerprint sensor which is integrated into an existing fingerprint
recognition system infrastructure [7]. Their examination of the U.S. Department
of Homeland Securitys Biometric Identification System recommended measures
to facilitate maintenance and matcher accuracy of large scale applications. The
quality of fingerprint images heavily influences performance of fingerprint recog-
nition systems. Modi and Elliott observed that image quality and performance
of fingerprint dataset collected from an 18-25 year population is better than fin-
gerprint dataset collected from 62 years and above population [9]. The authors
of [2] presents a methodology to compensate for image resolution and distor-
tion differences for fingerprints from different fingerprint sensors. By calculating
the resolution and distortion information of fingerprint sensors, the statistical
analysis of compensated images from different sensors showed a reduction in dif-
ferences of features between the images from different sensors. NIST conducted
the MINEX Test in 2004 which assessed the error rates for fingerprint templates
created from different template generators and matched on different matchers
[1]. Their observations showed a significant difference in error rates for fingerprint
datasets which used different template generators and matchers. These previous
studies show a higher error rate for matching fingerprints collected from different
types of scanners. With distributed authentication architectures becoming more
pervasive, interoperability will become a paramount concern. The results from
these previous studies indicated a need to analyze and understand the difference
in error rates for fingerprint images captured from different sensors.
3 Sensor Technologies
The study was conducted using two types of fingerprint sensor technologies:
optical and capacitance. Most optical sensors are based on the phenomenon of
frustrated total internal reflection (FTIR) [11]. This technology utilizes a glass
platen, a light source and a CCD, or a CMOS camera for constructing finger-
print images [11]. Optical sensors introduce distortions which are characteristic
of its technology. The edges of fingerprint images captured using optical sen-
sors have a tendency of getting blurred due to the setup of the lenses. Optical](https://image.slidesharecdn.com/iciss2007modielliottkim-100228075714-phpapp02/75/2007-Performance-Analysis-for-Multi-Sensor-Fingerprint-Recognition-System-3-2048.jpg)
![4
physics could potentially lead to out of focus images which can be attributed
to the curvature of the lens. Sometimes residual incident light is reflected from
the ridges which can lead to a low contrast image [12]. A phenomenon called
Trapezoidal Distortion is also noticed in fingerprint images due to the unequal
optical paths between each point of the fingerprint and the image focusing lens
[5]. Capacitance sensors are constructed using a two-dimensional array of con-
ductive plates [13]. When a finger is placed on a surface above the array the
electrical capacitance of these plates is affected. The sensor plates under the
ridge will have a larger capacitance than the sensor plates beneath the valley.
Air has lower permittivity than skin, which leads to an increased capacitance in
plates under the skin. Capacitance sensors do not produce geometric distortions,
but they are prone to introduce distortions due to the electrical nature of the
capture technology. Electrostatic discharge can affect the resulting image since
the conductive plates are sensitive to it. Capacitance sensors can also be affected
from the 60Hz power line and electrical noise from within the sensor [10]. Both
these sensor technologies are affected by leftover residue on the surface and skin
conditions like sweat and oiliness. These technologies introduce distortions on
the resulting image and reduce its fidelity to the original source and also increase
inconsistencies in resulting images.
4 Instrumentation, Data Collection and Dataset
Summary
The analysis for this study was conducted using fingerprints collected from three
different fingerprint sensors. The three fingerprint sensors used were DigitalPer-
sona U.are.U4000a, Identix DFR 2080, and Authentec AF-S2. The DigitalPer-
sona U.are.U4000a and Identix DFR 2080 sensors are optical sensors, and Au-
thentec AF-S2 is a capacitive sensor. Table 1 shows the specifications for the
three fingerprint sensors. 44 subjects provided 6 fingerprint samples of their
right index finger on these three sensors which resulted in total of 264 finger-
prints from each sensor.
Table 1. Fingerprint Sensor Information
SensorN ame SensorT ype Resolution CaptureArea(mm)
DigitalPersona U.are.U4000 Optical Sensor 512 dpi 14.6X18.1
Authentec AF-S2 Capacitive Sensor 250 dpi 13X13
Identix DFR 2080 Optical Sensor 500 dpi 15X15
VeriFinger 5.0 SDK was used to perform the feature extraction and match-
ing. This setup simulates one of the main objectives of the experiment: capture](https://image.slidesharecdn.com/iciss2007modielliottkim-100228075714-phpapp02/75/2007-Performance-Analysis-for-Multi-Sensor-Fingerprint-Recognition-System-4-2048.jpg)
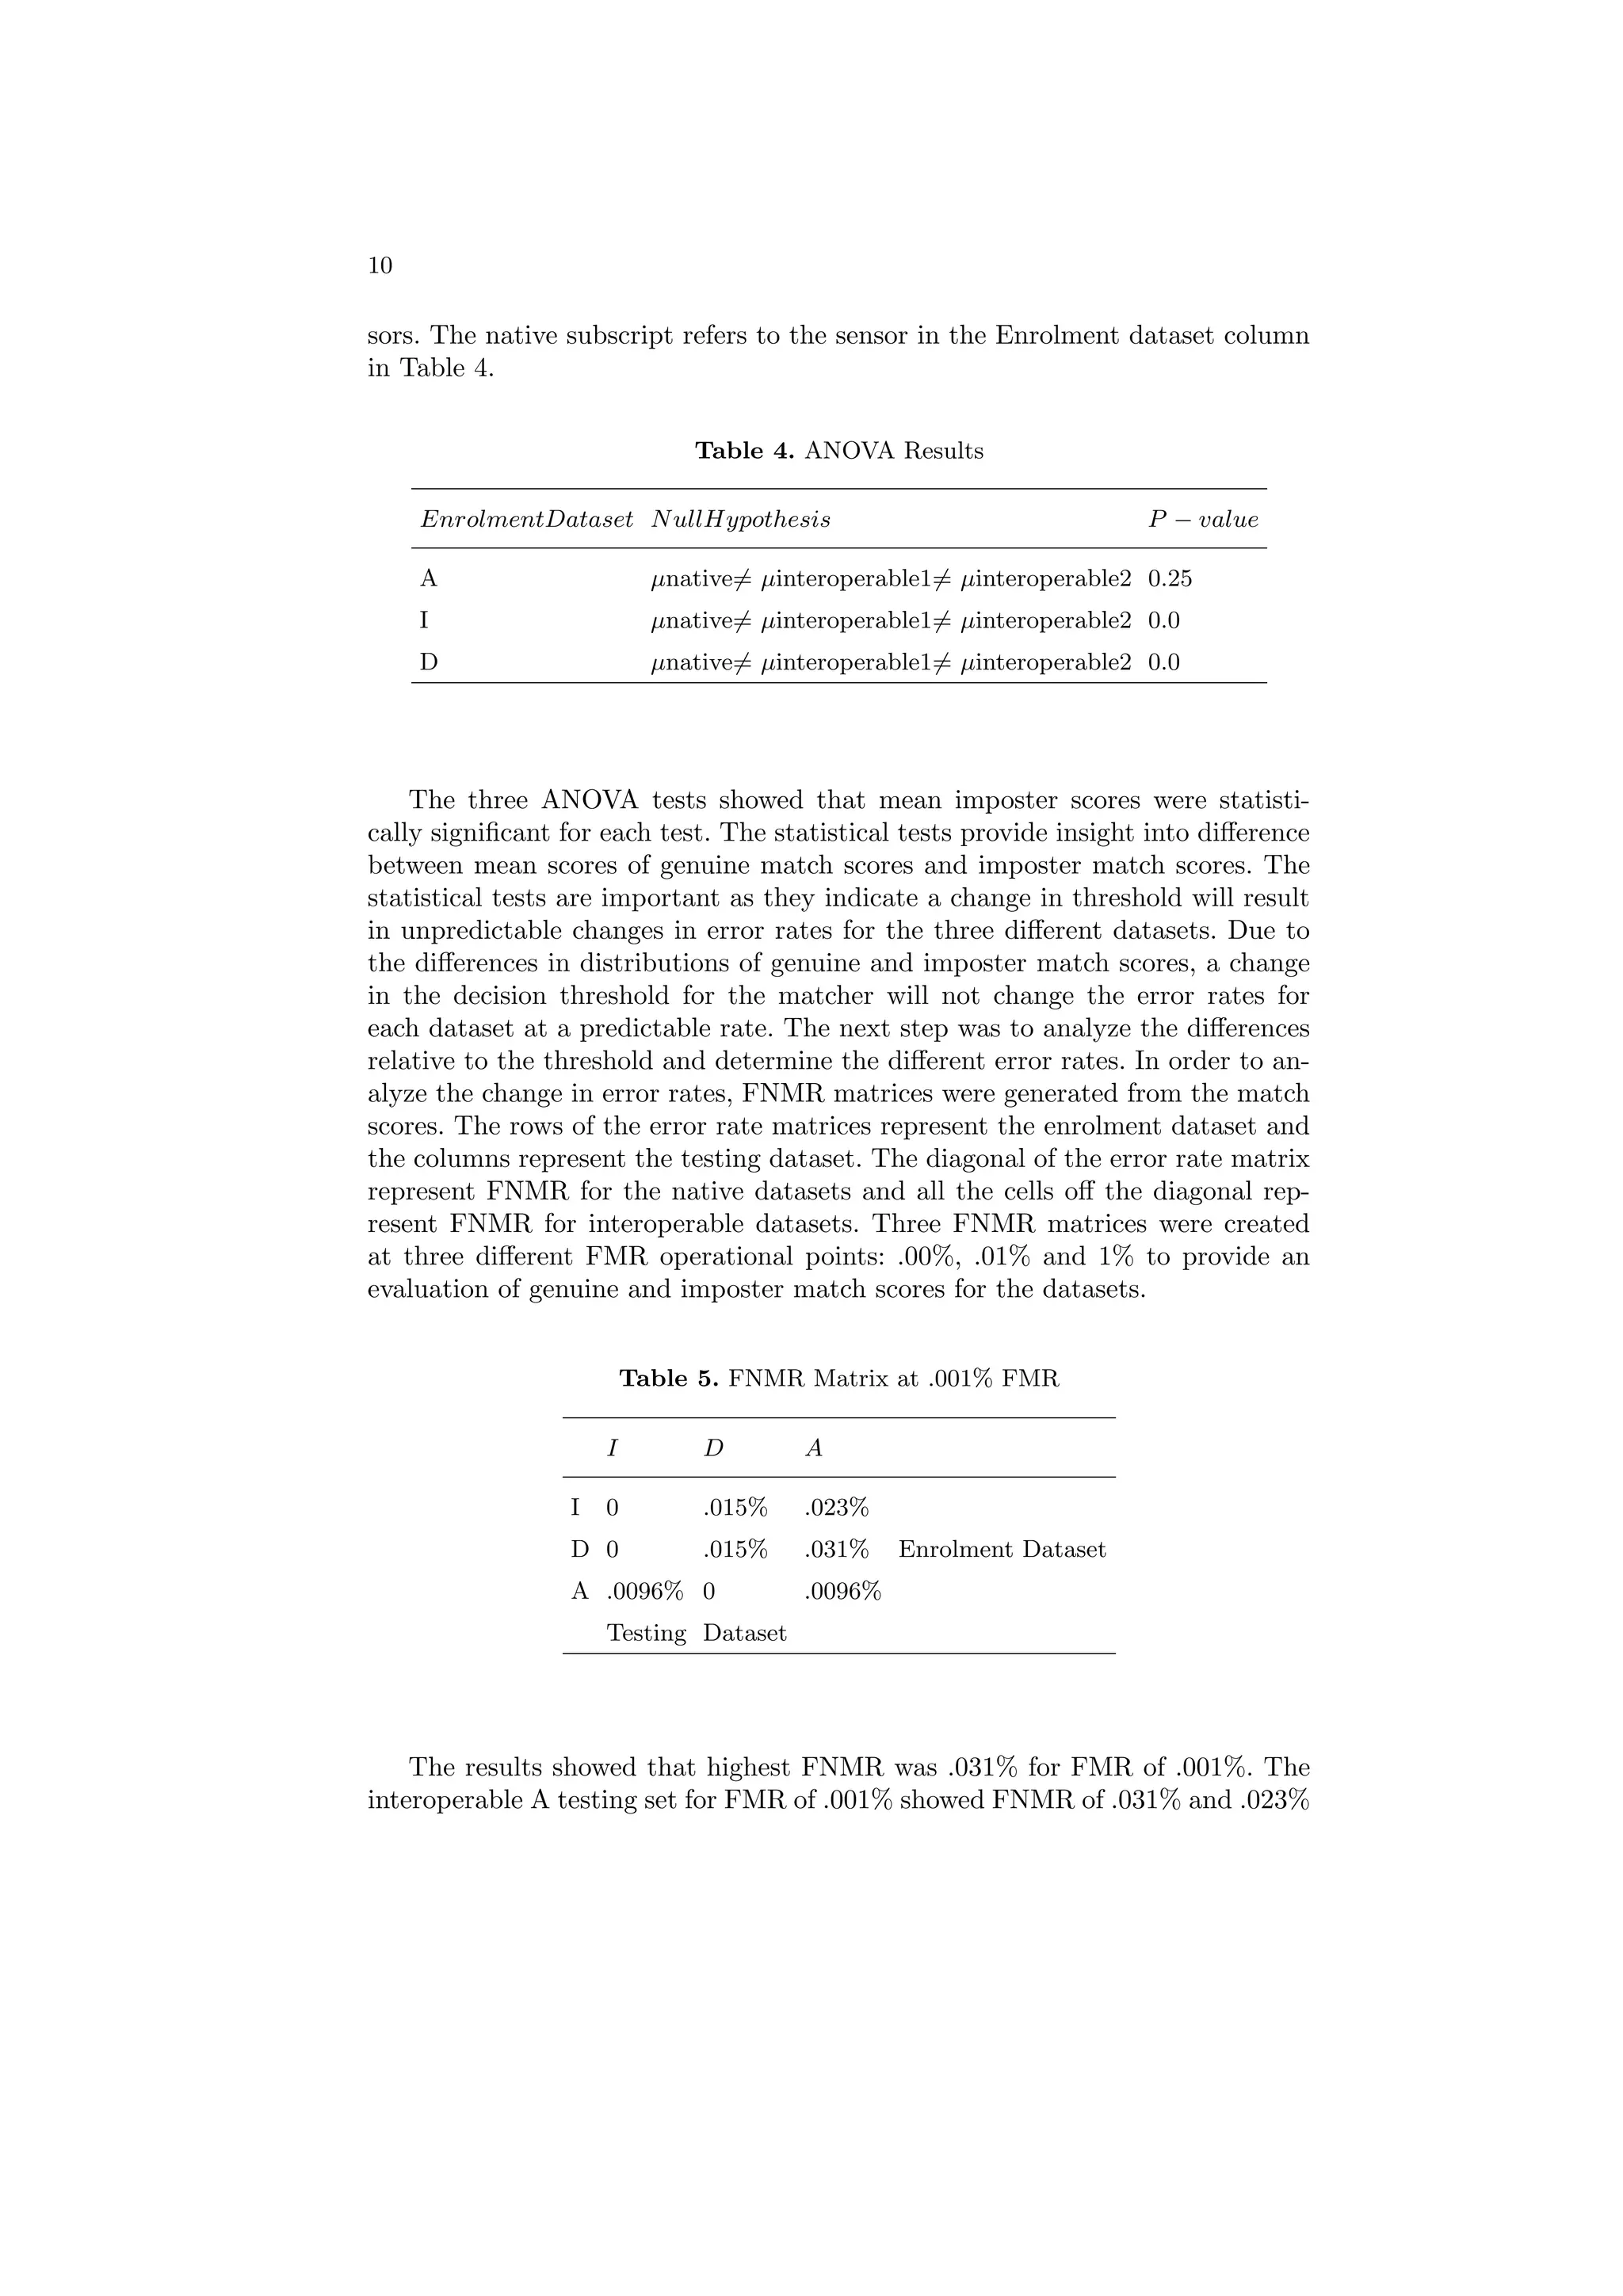
![11
Table 6. FNMR Matrix at .01% FMR
I D A
I 0 .015% .023%
D 0 .015% 0% Enrolment Dataset
A .0096% 0 0%
Testing Dataset
Table 7. FNMR Matrix at 1% FMR
I D A
I 0 0% 0%
D 0 0% 0% Enrolment Dataset
A 0% 0 0%
Testing Dataset
with the interoperable optical datasets. These error rates are significantly lower
compared to previous studies related to interoperability of fingerprint [6]. The
FNMR matrix for FMR of 1% showed a FNMR of 0% for native and interop-
erable datasets. The A enrolment dataset showed a relatively low FNMR with
the interoperable optical datasets in Table 5 which was an interesting result.
Contrarily, the A testing dataset showed the highest FNMR in Table 5. The
optical sensor datasets showed a relatively low FNMR for interoperability tests
compared to the FNMR for interoperability tests between optical and capacitive
sensor datasets. The trend of these results is similar to previous studies, although
this approach achieved considerably lower FNMR compared to previous studies.
The distributions of minutiae count and quality scores for the capacitive sensor
dataset were the most variable, and the capacitive dataset showed the highest
FNMR with the optical interoperable datasets. This relationship is interesting as
it indicates a possibility for improving performance of interoperability datasets
by controlling for minutiae count and quality of input samples relative to the
native dataset.
6.2 Generalized Hybrid Template
The analysis of results from the generalized simple template methodology led the
researchers to test a hybrid template strategy. This strategy involved generating
a hybrid template from three fingerprints images, where each fingerprint image
was collected from a different sensor. To achieve this, one image from each dataset
was used to create the enrolment template, and the remaining 5 images for each](https://image.slidesharecdn.com/iciss2007modielliottkim-100228075714-phpapp02/75/2007-Performance-Analysis-for-Multi-Sensor-Fingerprint-Recognition-System-11-2048.jpg)
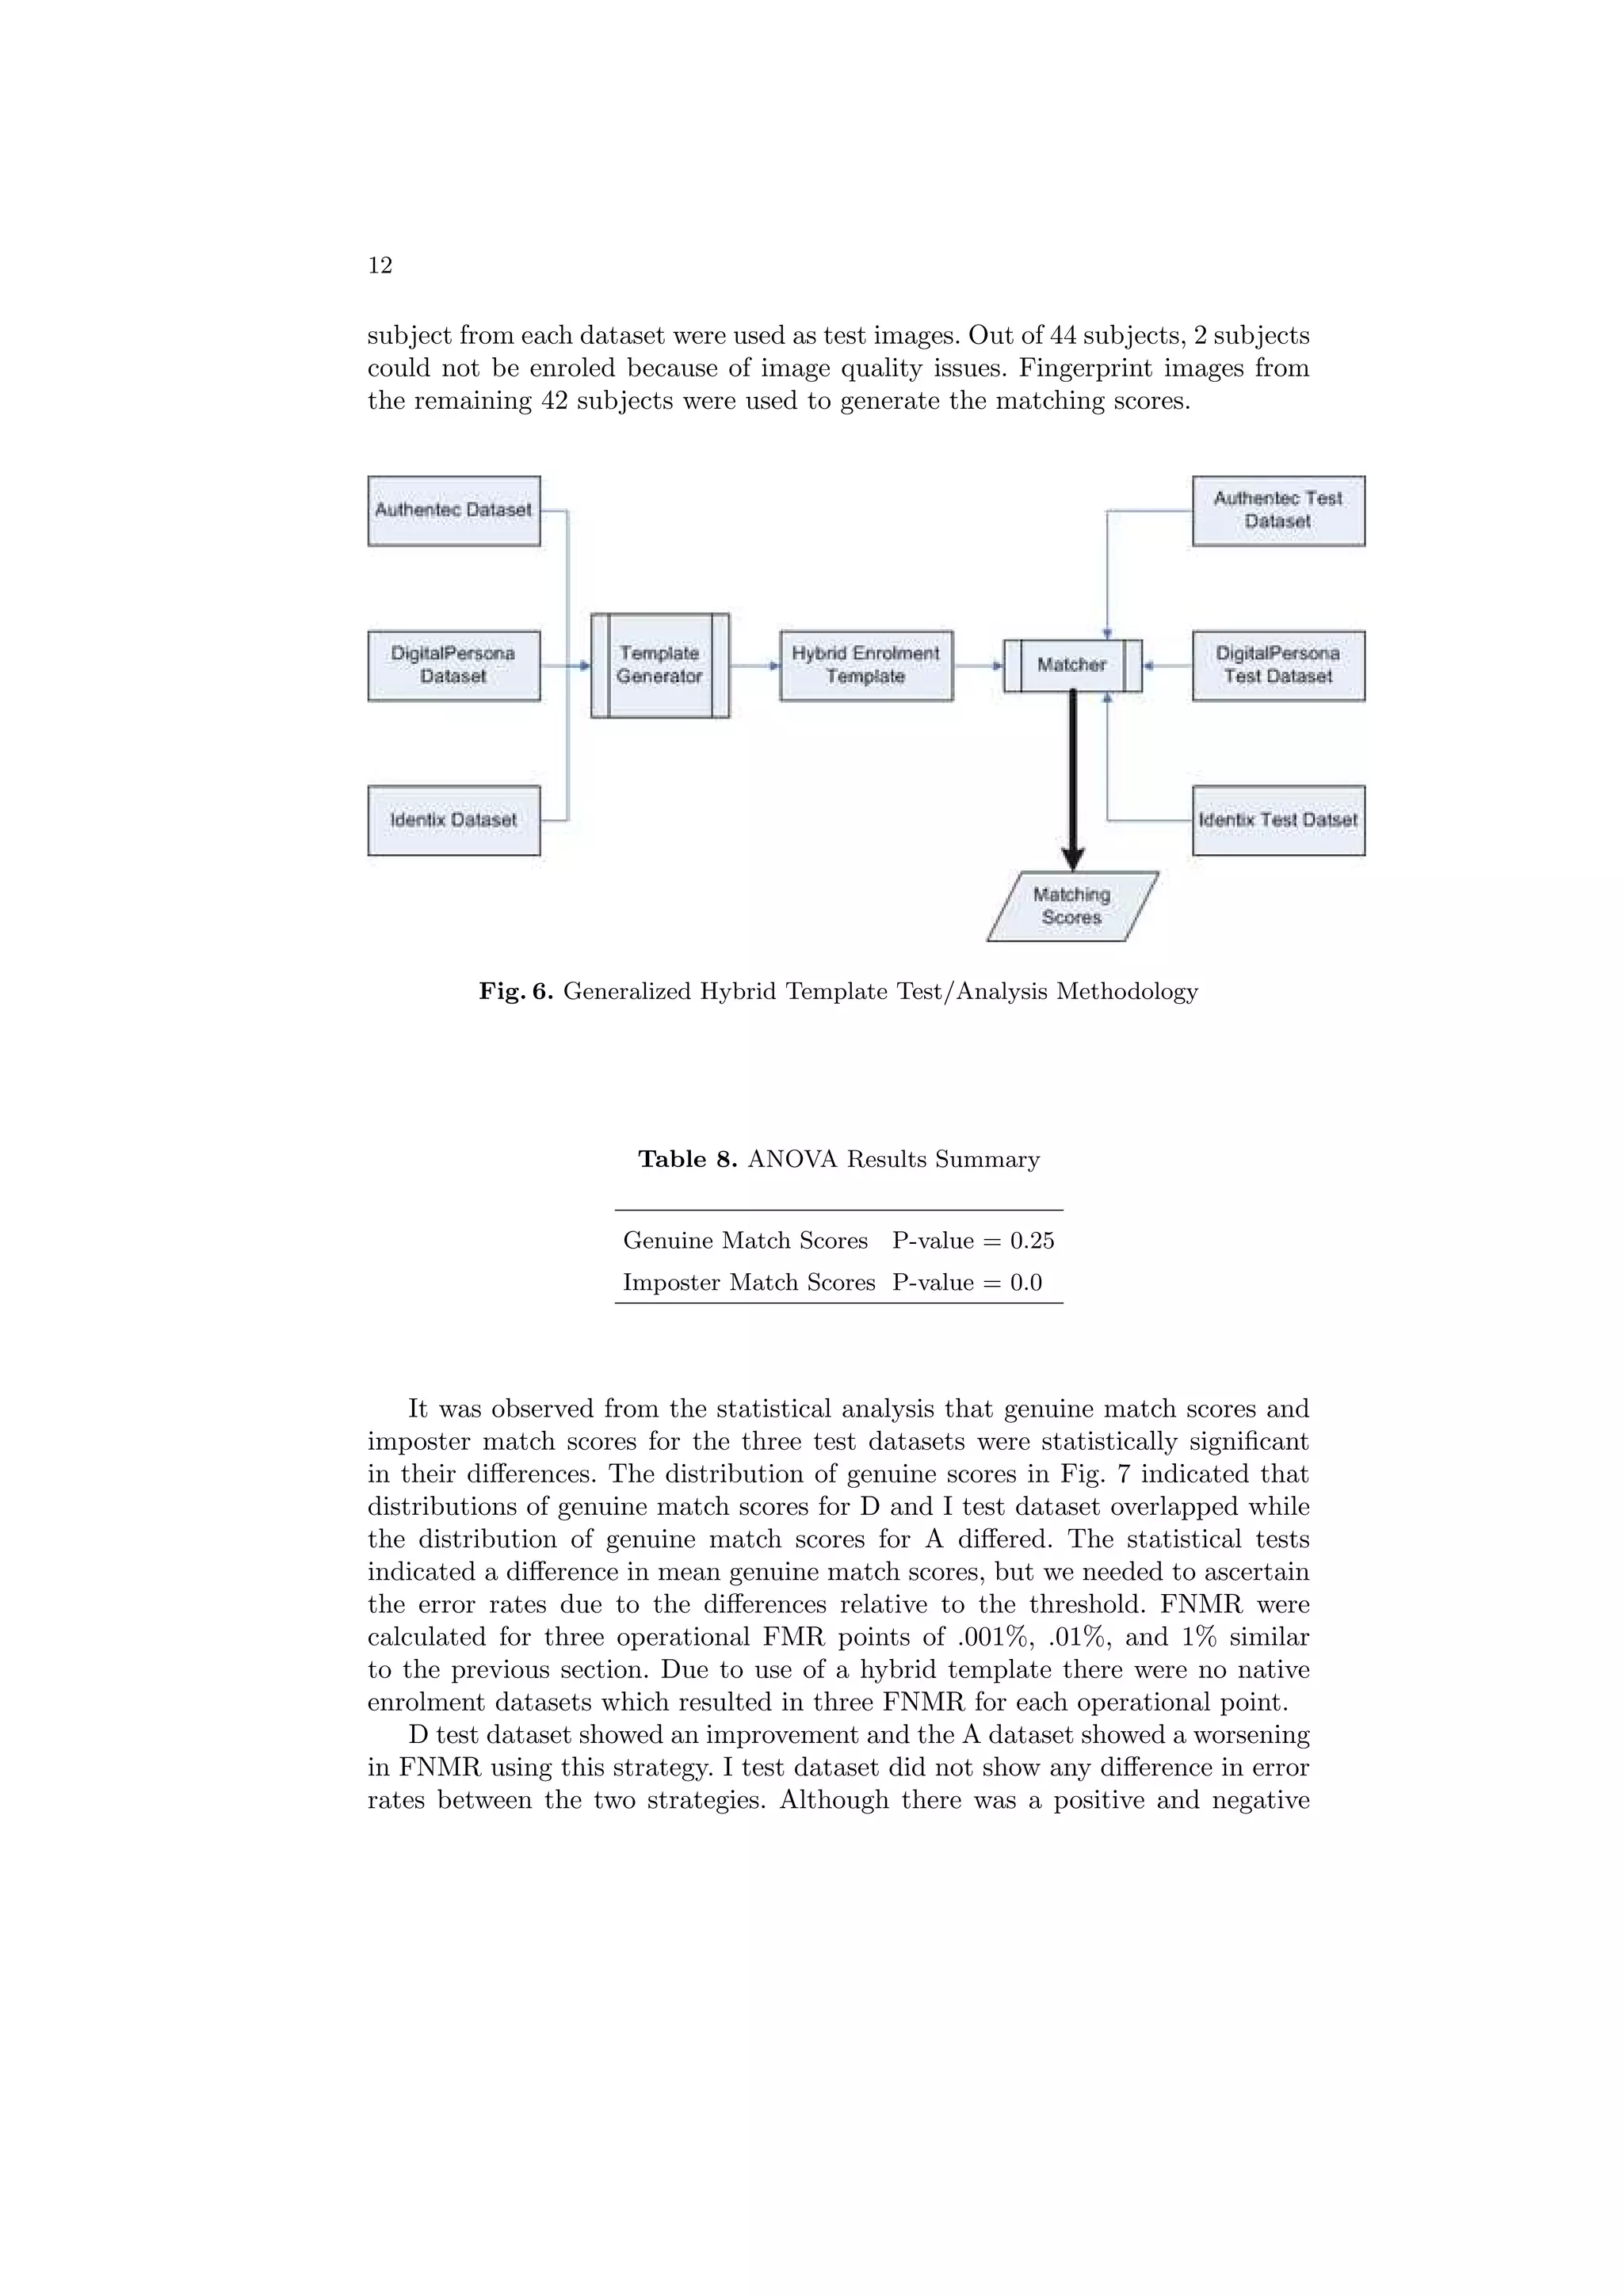
![14
change in error rates they were not relatively large. At 1% FMR all three datasets
showed a 0% FNMR. This result was consistent with observations from the
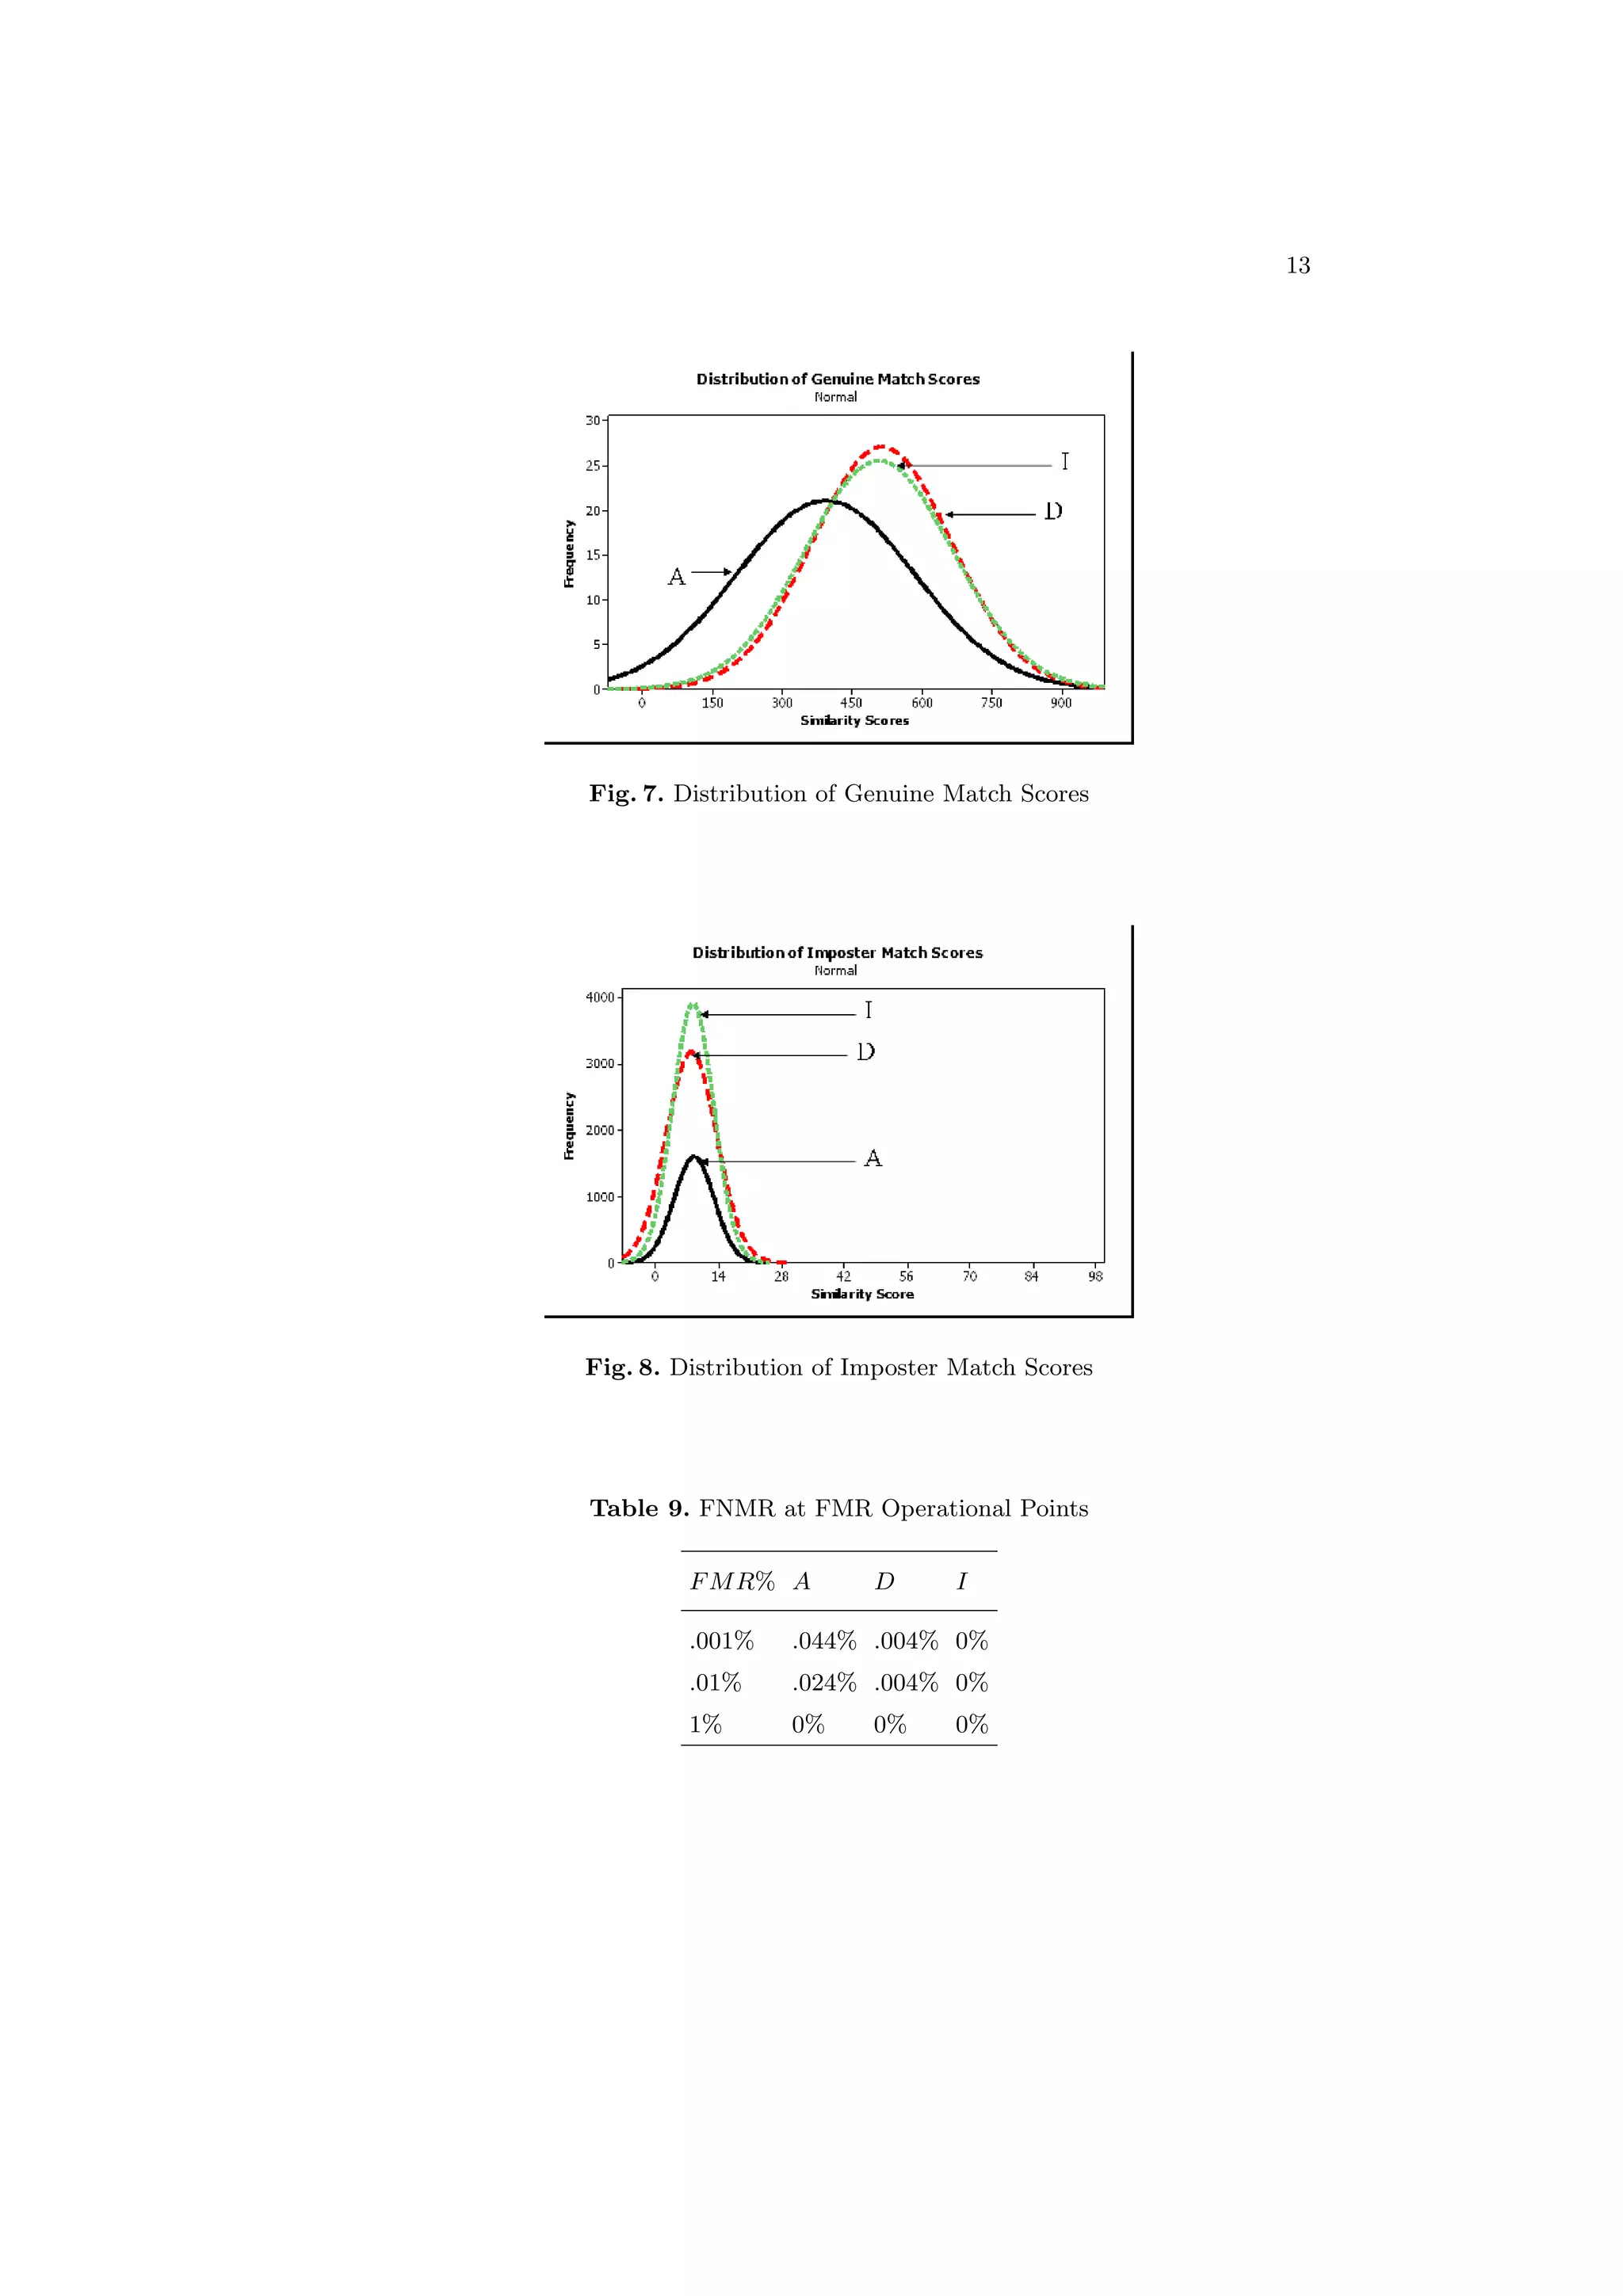
previous section. It was observed earlier that the distribution of A genuine match
scores did not overlap as much as the distributions for I and D. This can be
directly related to the low FNMR for D and I test datasets and the slightly
higher FNMR for A dataset. The lower resolution and smaller image size of
fingerprint images from sensor A compared to fingerprint images from other
sensors made this result predictable. Results from both the template generation
techniques showed that matching scores for native and interoperable datasets
were not statistically similar but this did not have an effect on the error rates.
Although the matching scores were not similar they were significantly greater
than the threshold to have a 0% FNMR at 1% FMR.
7 Conclusions
Both the strategies presented in this paper resulted in a significant improvement
in FNMR for interoperable fingerprint datasets compared to previous studies.
Although both the strategies presented in this paper were different, the difference
in error rates did not appear to be significantly different. This novel approach
using commercially available tools is a positive indicator for efforts to lower in-
teroperability error rates. The results of the statistical tests demonstrate a need
to further understand and reliably predict changes in error rates for matching
interoperable fingerprint datasets. This study also employed quality control as
part of generating the generalized templates which is also one the factors re-
sponsible for a lower FNMR. The importance of quality control in lowering error
rates has been demonstrated in several other studies, and using it as part of
the enrolment strategy can result in better performance. The use of multiple
fingerprints to capture more features of the fingerprint resulted in better per-
formance compared to the use of a single fingerprint. Analyzing the minutiae
count distribution and the error rate matrices indicates that overlap of minutiae
distribution can potentially reduce error rates for interoperable databases. Such
a strategy would require minutiae count distribution of interoperable datasets
be compared to some reference database. The ANSI INCITS 378-2004 finger-
print minutiae data interchange format explicitly states the usage of only basic
minutiae information like x coordinate, y coordinate, angle, type and minutiae
quality to be used in the matching process. Using a template generalization
technique while controlling for minutiae distribution for generation of INCITS
378-2004 fingerprint templates in an interoperability scenario would be an in-
teresting experiment. The importance of interoperability is becoming evermore
evident, and so is the importance of finding a solution to alleviate its problems.
There are several ongoing efforts which are attempting to reduce the error rates
for interoperability datasets. Normalization of fingerprint images collected from
sensors of different technologies which result in images of different resolution and
sizes is also an ongoing effort [2]. An extension of this work would be to apply
the image normalization technique and then follow the template generalization](https://image.slidesharecdn.com/iciss2007modielliottkim-100228075714-phpapp02/75/2007-Performance-Analysis-for-Multi-Sensor-Fingerprint-Recognition-System-14-2048.jpg)

This research investigates interoperability in multi-sensor fingerprint recognition systems, focusing on its effect on error rates between various optical and capacitive fingerprint sensors. The study analyzed performance using data from 44 subjects across three sensors, achieving interoperable false reject rates below 0.31% with two enrollment strategies. The results highlight significant impacts of sensor-specific distortions on recognition accuracy and underline the necessity for advancements in biometric interoperability.


![MDD Project Report By Dharmendra singh [Srm University] Ncr Delhi](https://cdn.slidesharecdn.com/ss_thumbnails/finalmddfilepdf-180424131522-thumbnail.jpg?width=640&height=640&fit=bounds)


![Vibe Coding vs. Spec-Driven Development [Free Meetup]](https://cdn.slidesharecdn.com/ss_thumbnails/vibecodingvsspecdrivendevelopment-251209105622-43f455e7-thumbnail.jpg?width=640&height=640&fit=bounds)


