Download to read offline
![• “The measured or measurable period during which an action, process, or condition
exists or continues” [1].
• “Indefinite, unlimited duration in which things are considered as happening in the
past, present, or future; every moment there has ever been or ever will be” [2].
• “The science of arranging time in fixed periods for the purpose of dating events
accurately and arranging them in order of occurrence” [2].
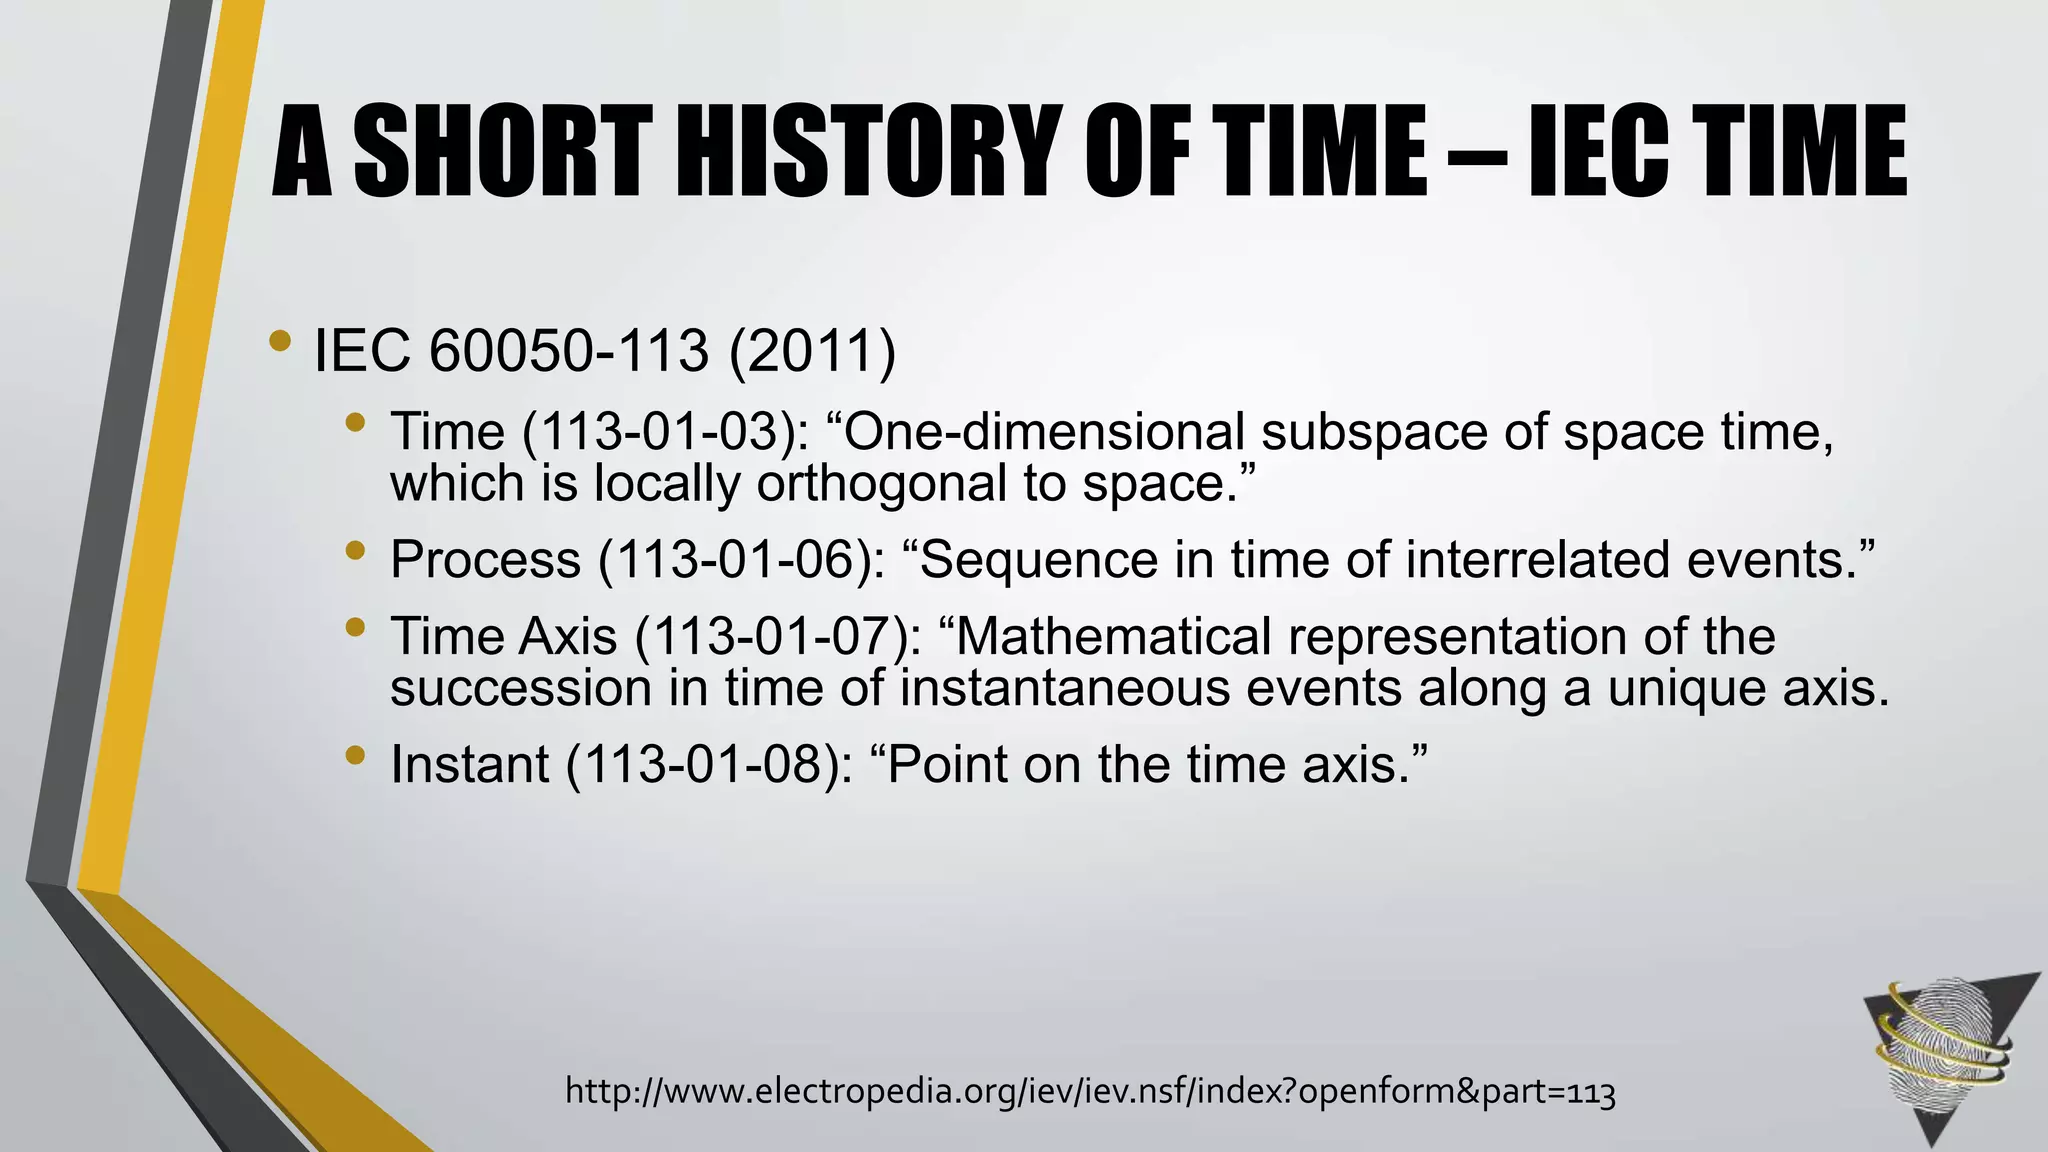
• International Electrotechnical Commission Time Definition (60050-113-01-03): “One-
dimensional subspace of space-time, which is locally orthogonal to space.”
WHAT IS TIME?](https://image.slidesharecdn.com/timingpowerpoint-150311075202-conversion-gate01/75/Best-Practices-in-Reporting-Time-Duration-in-Biometrics-3-2048.jpg)
![• The current model of time in the biometrics field are not consistently applied, as there
are limited definitions that can be used.
• Researchers speak of very specific intervals of data collection which may be
confusing and create a disconnect between studies, making them hard to compare.
• Time, though, “is basically a human construct to fit the needs of humans as we grow
and evolve, it stands to reason that we can and should rethink and try to adapt our
ideas and use of time into something that will be more useful” [3].
• Namely, a new construct should be developed to fit the needs of the field.
WHY EXAMINE TIME IN BIOMETRICS?](https://image.slidesharecdn.com/timingpowerpoint-150311075202-conversion-gate01/75/Best-Practices-in-Reporting-Time-Duration-in-Biometrics-4-2048.jpg)
![• Examples of “time” in biometrics literature:
• “One set in particular, the US-VISIT Point of Entry dataset (POE) contains all
fingerprints collected by US-VISIT between January and June 2004” [15].
• “All of the iris images used in this study were acquired with the same LG 2200
iris imaging camera, located in the same studio throughout the four years of
image acquisition” [16].
• “The database comprises 264,645 iris images of 676 unique subjects captured
over 27 sessions” [17].
• “The final dataset was collected in four acquisition sessions, which spanned a
total of 12 weeks” [18].
WHY EXAMINE TIME IN BIOMETRICS](https://image.slidesharecdn.com/timingpowerpoint-150311075202-conversion-gate01/75/Best-Practices-in-Reporting-Time-Duration-in-Biometrics-5-2048.jpg)
![•Animal bones dating to 20,000 years ago used
to keep track of the number of days between
moon cycles [4].
•2776 BC, Egyptians calculated the year to be
365 days year [4].
A SHORT HISTORY OF TIME](https://image.slidesharecdn.com/timingpowerpoint-150311075202-conversion-gate01/75/Best-Practices-in-Reporting-Time-Duration-in-Biometrics-6-2048.jpg)
![•The Sumerians into divided their days into 12 equal
parts [4].
•1000 years later, the Babylonians created the
modern framework of 24 hour days with each hour
divided into 60 minutes and each minute divided
into 60 seconds [4].
A SHORT HISTORY OF TIME](https://image.slidesharecdn.com/timingpowerpoint-150311075202-conversion-gate01/75/Best-Practices-in-Reporting-Time-Duration-in-Biometrics-7-2048.jpg)
![• Romans merged the framework of the Egyptian
system of 365 days per year with the Babylonian
concept of hour, minutes, and seconds [5].
• Developed the Julian calendar system.
• The Gregorian calendar (1582) updated the Julian
calendar to take into account that the Earth takes 365
¼ days to revolve the sun [5].
A SHORT HISTORY OF TIME](https://image.slidesharecdn.com/timingpowerpoint-150311075202-conversion-gate01/75/Best-Practices-in-Reporting-Time-Duration-in-Biometrics-8-2048.jpg)
![• Clocks that changed the world
• Clepsydras (water clocks) developed in Egypt (1500 BC) [4]
• Pendulum regulated clock created by Christiaan Huygens
(1656) [6]
• The Harrison chronometer accurate to one second loss per
day and required for accurate Atlantic ocean navigation
(1737) [7]
A SHORT HISTORY OF TIME](https://image.slidesharecdn.com/timingpowerpoint-150311075202-conversion-gate01/75/Best-Practices-in-Reporting-Time-Duration-in-Biometrics-9-2048.jpg)
![• Clocks that changed the world
• The most capable mechanical clock is the Shortt clock capable of one
tenth of a second error per day (1921) [8]
• The first atomic clocks developed capable of 0.00001 seconds of error
per day and is more accurate then any measure of time that could be
calculated from astronomical observations (1949) [7]
• Current cesium based clocks are accurate to one trillionth of a second
uncertainty per day [7]
A SHORT HISTORY OF TIME](https://image.slidesharecdn.com/timingpowerpoint-150311075202-conversion-gate01/75/Best-Practices-in-Reporting-Time-Duration-in-Biometrics-10-2048.jpg)
![• ISO 8601 created in 1988, in part to restore “numerous
misconceptions of dates and time”.
• [hh] refers to a zero-padded hour 00 – 24
• [mm] refers to a zero-padded minute 00 – 59
• [ss] refers to a zero-padded second 00 – 60
• Time Zone Designators: Z
• Example: 15:43:07.159Z = 15 hours, 43 minutes, 7.159 seconds
A SHORT HISTORY OF TIME – ISO TIME](https://image.slidesharecdn.com/timingpowerpoint-150311075202-conversion-gate01/75/Best-Practices-in-Reporting-Time-Duration-in-Biometrics-13-2048.jpg)
![• Definitional
• Operational Times [9]
• The Relationship Between Presentations, Attempts and Transactions [11]
• Non-definitional
• ‘Subject biometric information was collected once every __ (days, weeks,
months, years, semesters, etc.) in __ visits over __ amount of time.’
• Very sporadic time frames that are confusing and difficult to
interpret/replicate.
TIME IN BIOMETRICS – SUBJECTIVE
MEASUREMENTS](https://image.slidesharecdn.com/timingpowerpoint-150311075202-conversion-gate01/75/Best-Practices-in-Reporting-Time-Duration-in-Biometrics-21-2048.jpg)
![• Total Transaction Time: The “…sum of all the subcomponent periods of time
associated with the biometric application system” [9].
• Overt Biometric Transaction Time: “This begins with the biometric sample
presentation and ends with the biometric decision. Therefore, this includes the
presentation of the biometric trait portion of the subject interaction time, biometric
subsystem processing time, which includes sample acquisition and sample
processing time, and the biometric decision time” [9].
• Subject Interaction Time: “…commences when a claim of identity is made (or
presented)… The time ends when the individual has presented his/her biometric
characteristic(s) and the sensor begins to acquire the sample” [9].
TIME IN BIOMETRICS – OPERATIONAL
TIMES](https://image.slidesharecdn.com/timingpowerpoint-150311075202-conversion-gate01/75/Best-Practices-in-Reporting-Time-Duration-in-Biometrics-23-2048.jpg)
![• Biometric Subsystem Processing/Transaction Time: “…the time taken for the system
to acquire the biometric sample, to evaluate the quality of the sample, and if the
quality is satisfied, to process that sample for comparison. For the samples of bad
quality, the biometric system requests the subject to submit the biometric trait. The
biometric subsystem processing time ends when either a comparison score or a
request for re-submission is generated” [9].
• Biometric Decision Time: “…the time required by the biometric subsystem to
generate an accept or reject response based on the comparison score and the
decision logic” [9].
• External Operation Time: “…the time required to complete the application
transaction” [9].
TIME IN BIOMETRICS – OPERATIONAL
TIMES](https://image.slidesharecdn.com/timingpowerpoint-150311075202-conversion-gate01/75/Best-Practices-in-Reporting-Time-Duration-in-Biometrics-24-2048.jpg)
![TIME IN BIOMETRICS – OPERATIONAL
TIMES [9]](https://image.slidesharecdn.com/timingpowerpoint-150311075202-conversion-gate01/75/Best-Practices-in-Reporting-Time-Duration-in-Biometrics-25-2048.jpg)
![• Using the logic of the operational times, [10] found mean
enrollment and mean verification times of hand geometry
recognition machines.
• By measuring and analyzing the frames of collected video
recordings of subject interactions with the machine, the
researchers we able to accurately conclude transaction
times to the closest one-fifteenth of a second.
• “This paper has shown that videos can be automatically
coded post-hoc to determine transaction times without the
use of a human operator” [10].
TIME IN BIOMETRICS – OPERATIONAL
TIMES APPLIED](https://image.slidesharecdn.com/timingpowerpoint-150311075202-conversion-gate01/75/Best-Practices-in-Reporting-Time-Duration-in-Biometrics-26-2048.jpg)
![TIME IN BIOMETRICS – THE RELATIONSHIP
BETWEEN PRESENTATIONS, ATTEMPTS AND
TRANSACTIONS [11]](https://image.slidesharecdn.com/timingpowerpoint-150311075202-conversion-gate01/75/Best-Practices-in-Reporting-Time-Duration-in-Biometrics-28-2048.jpg)
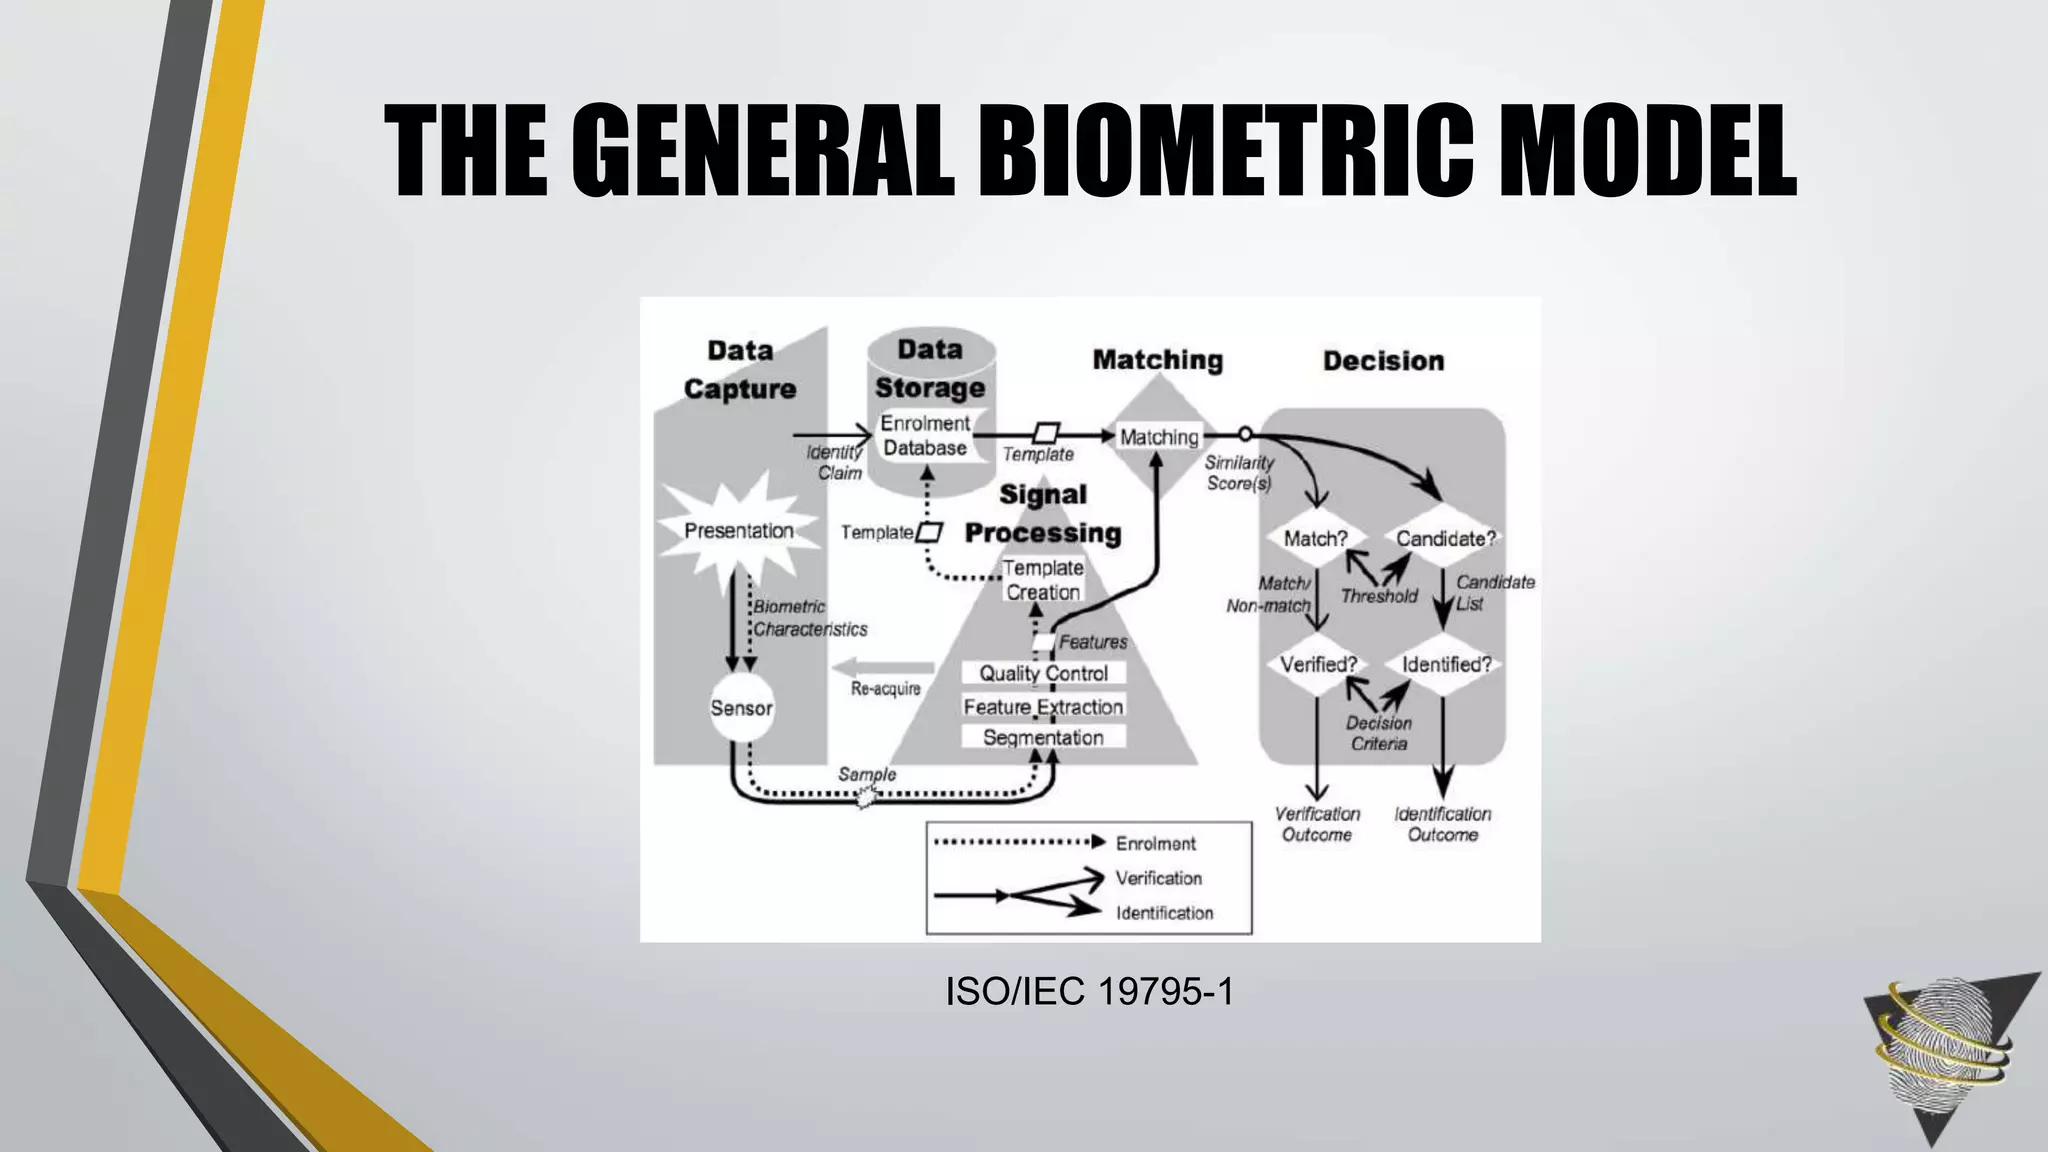
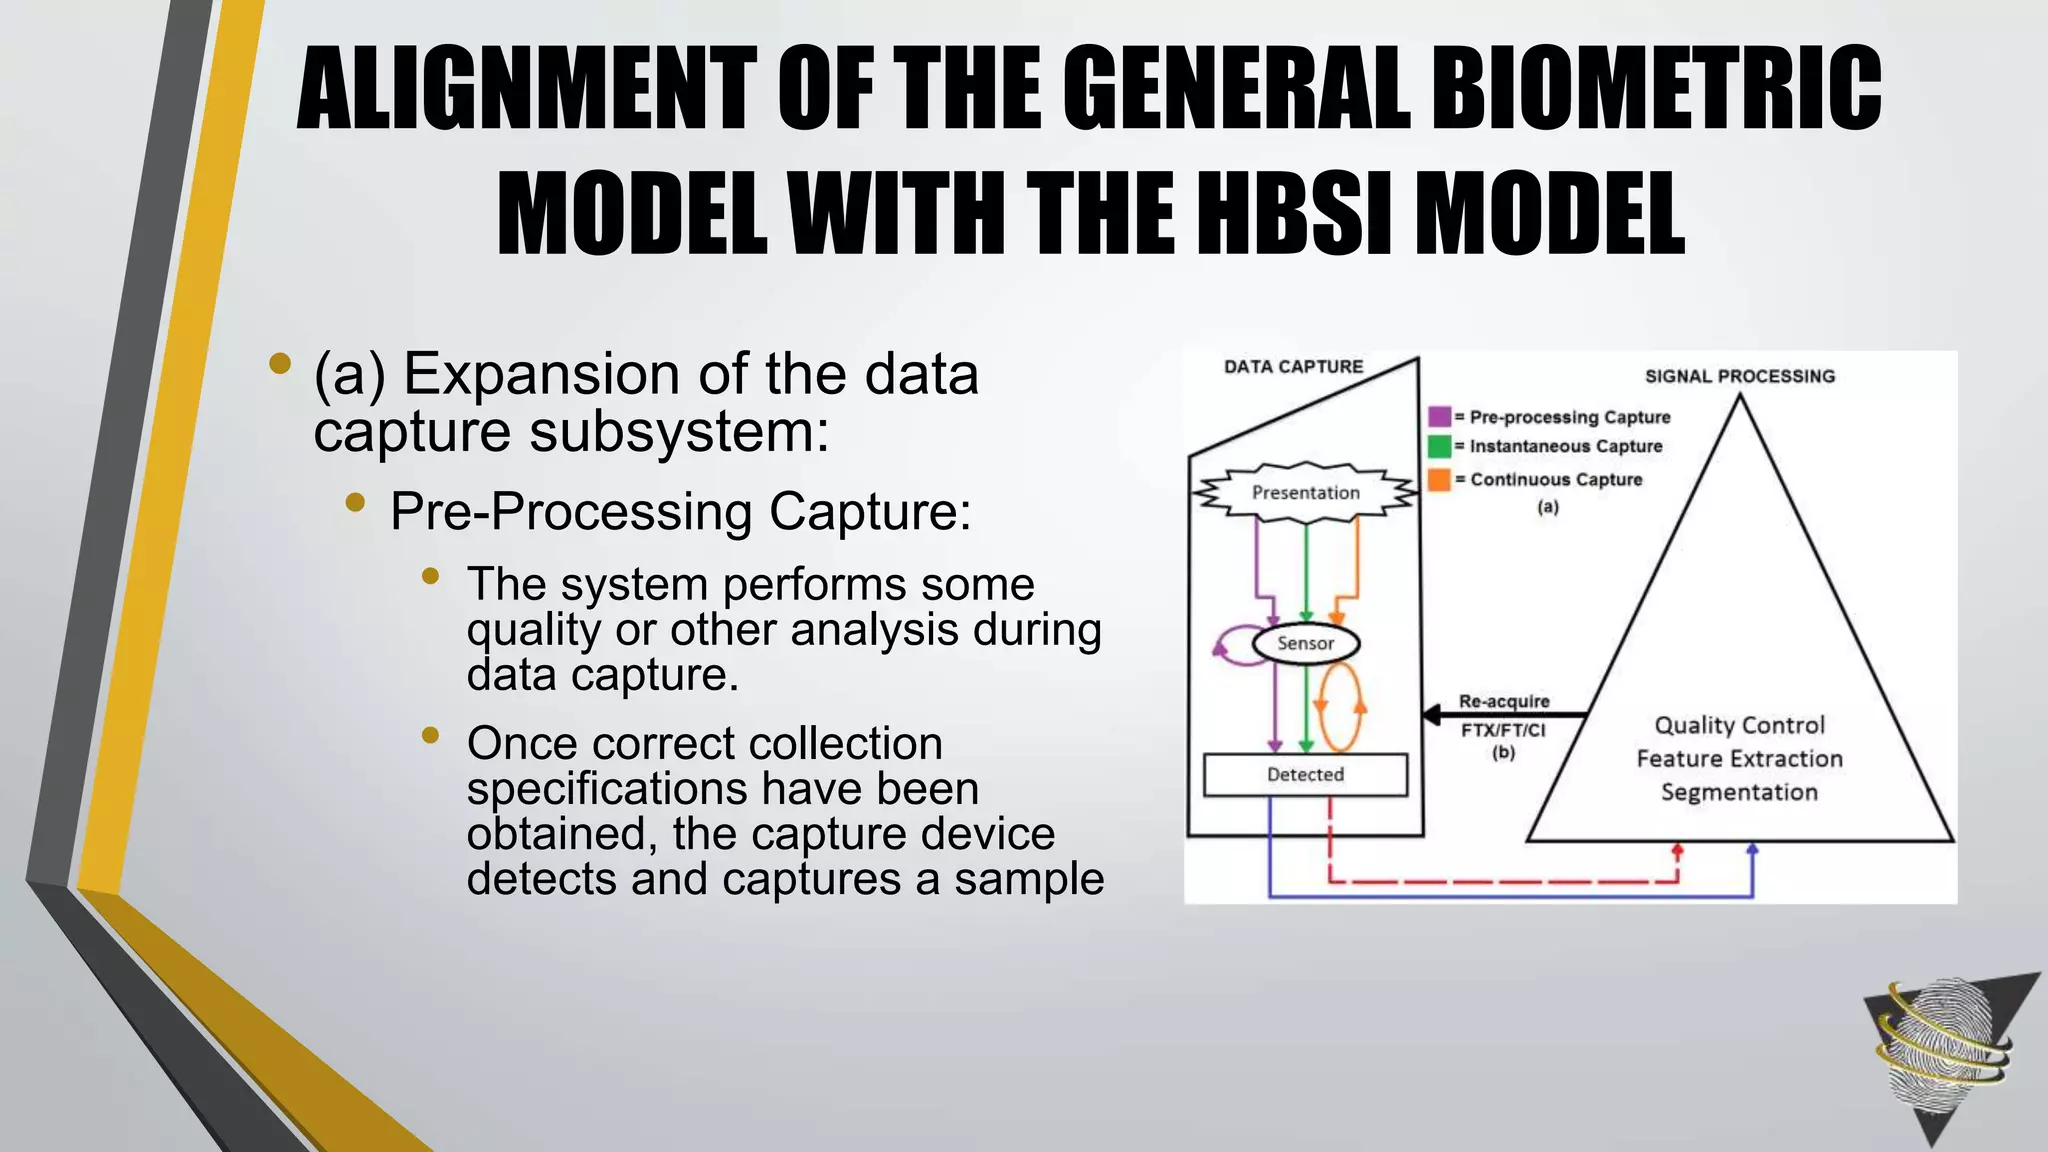
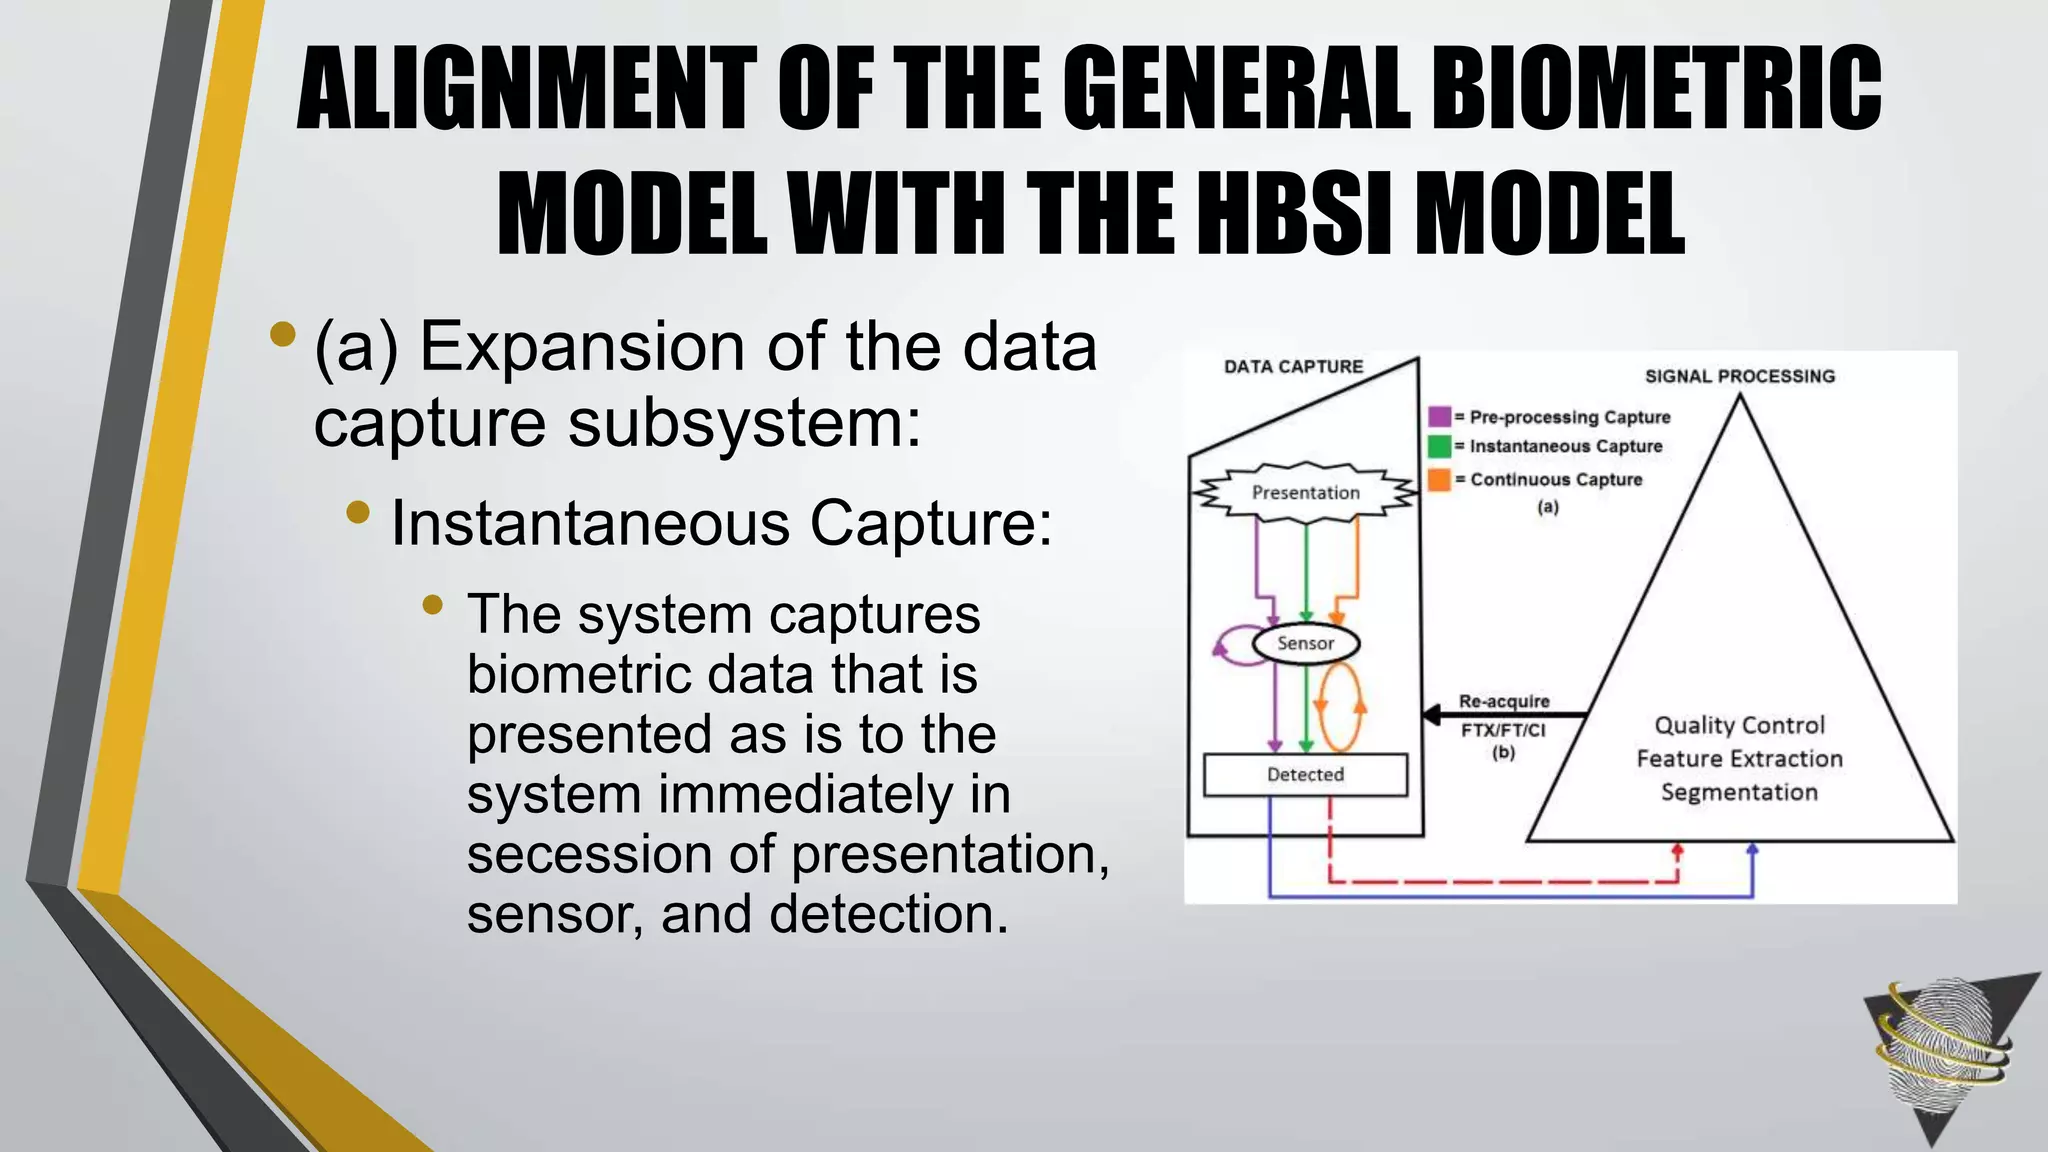
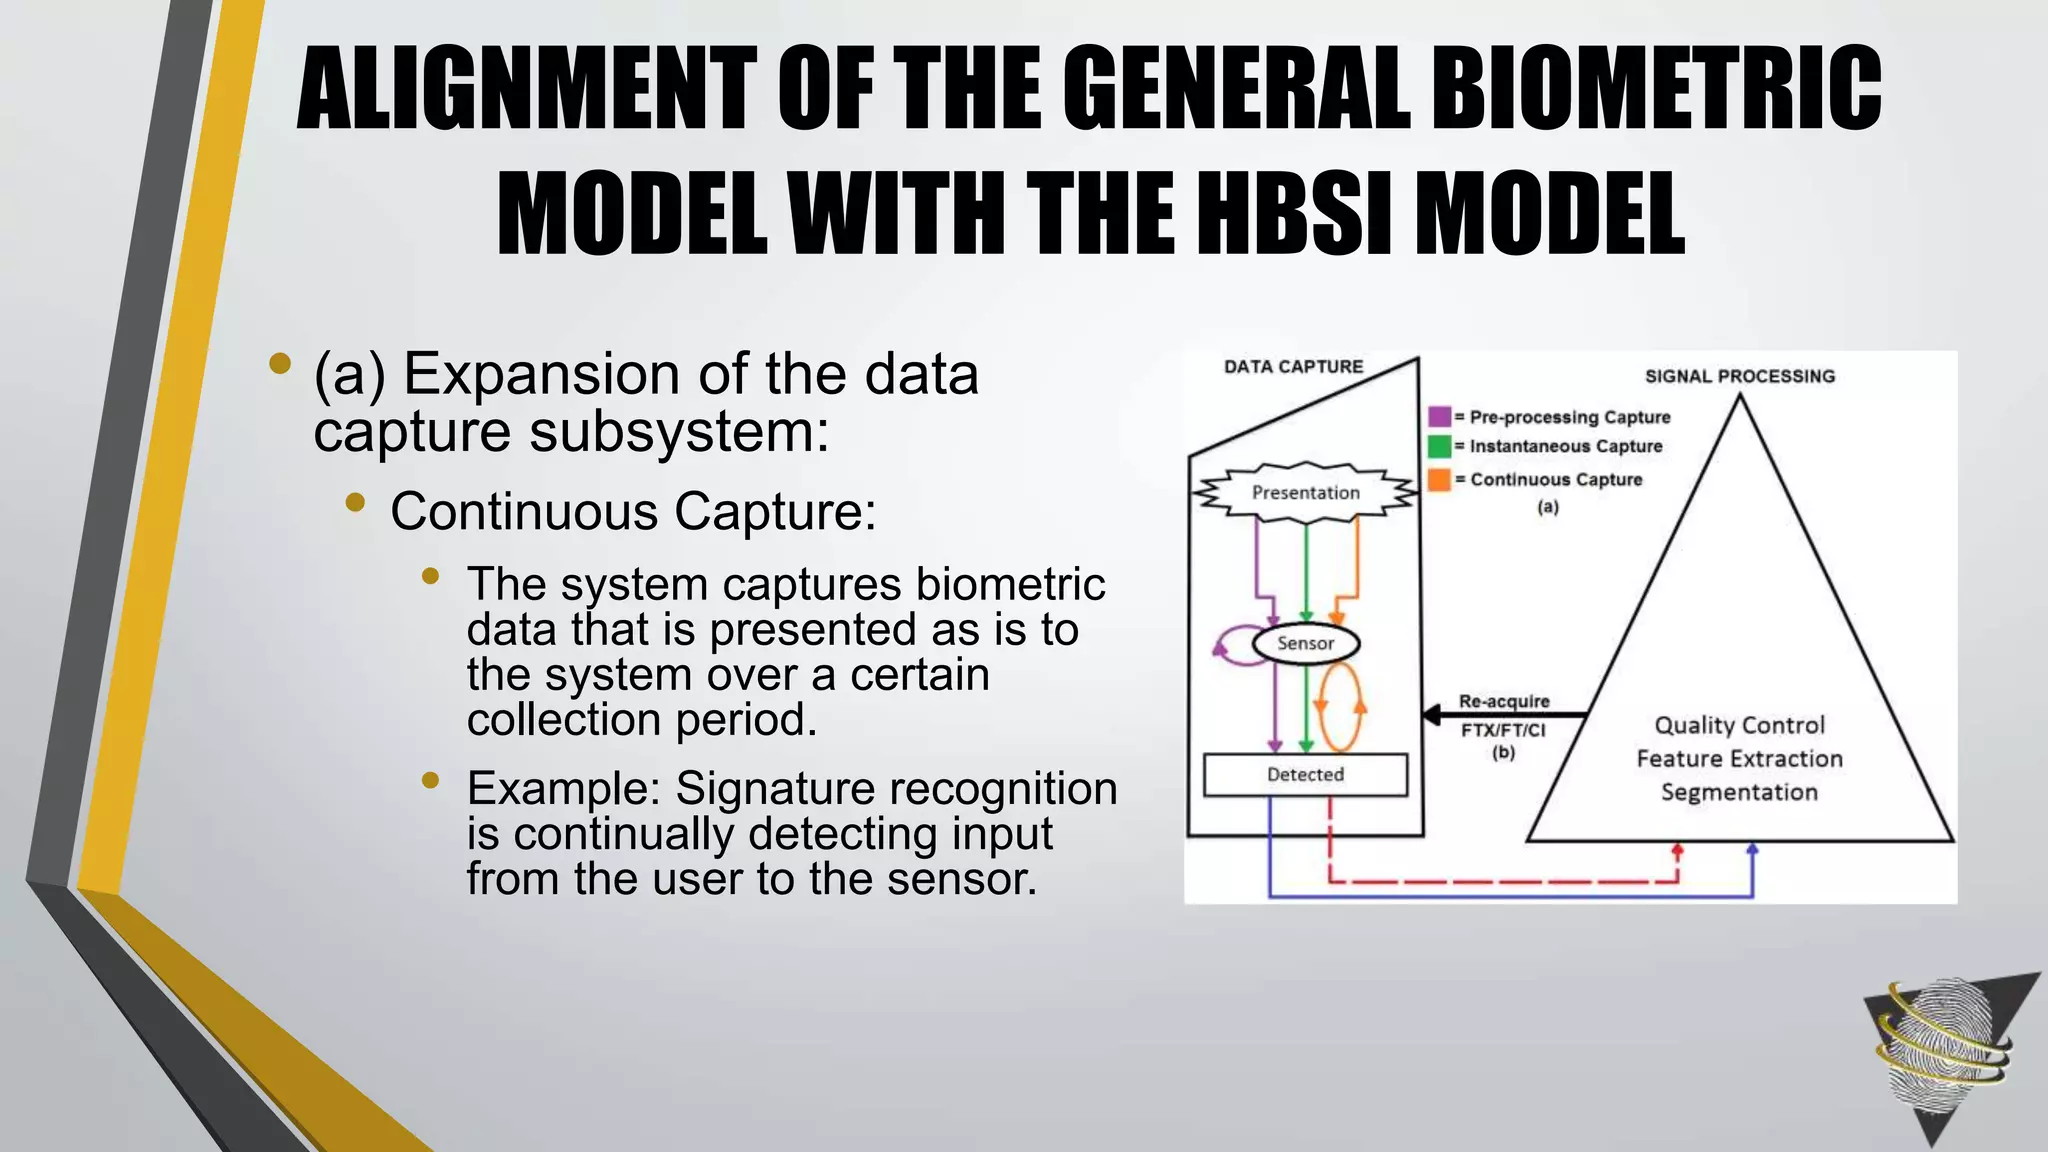
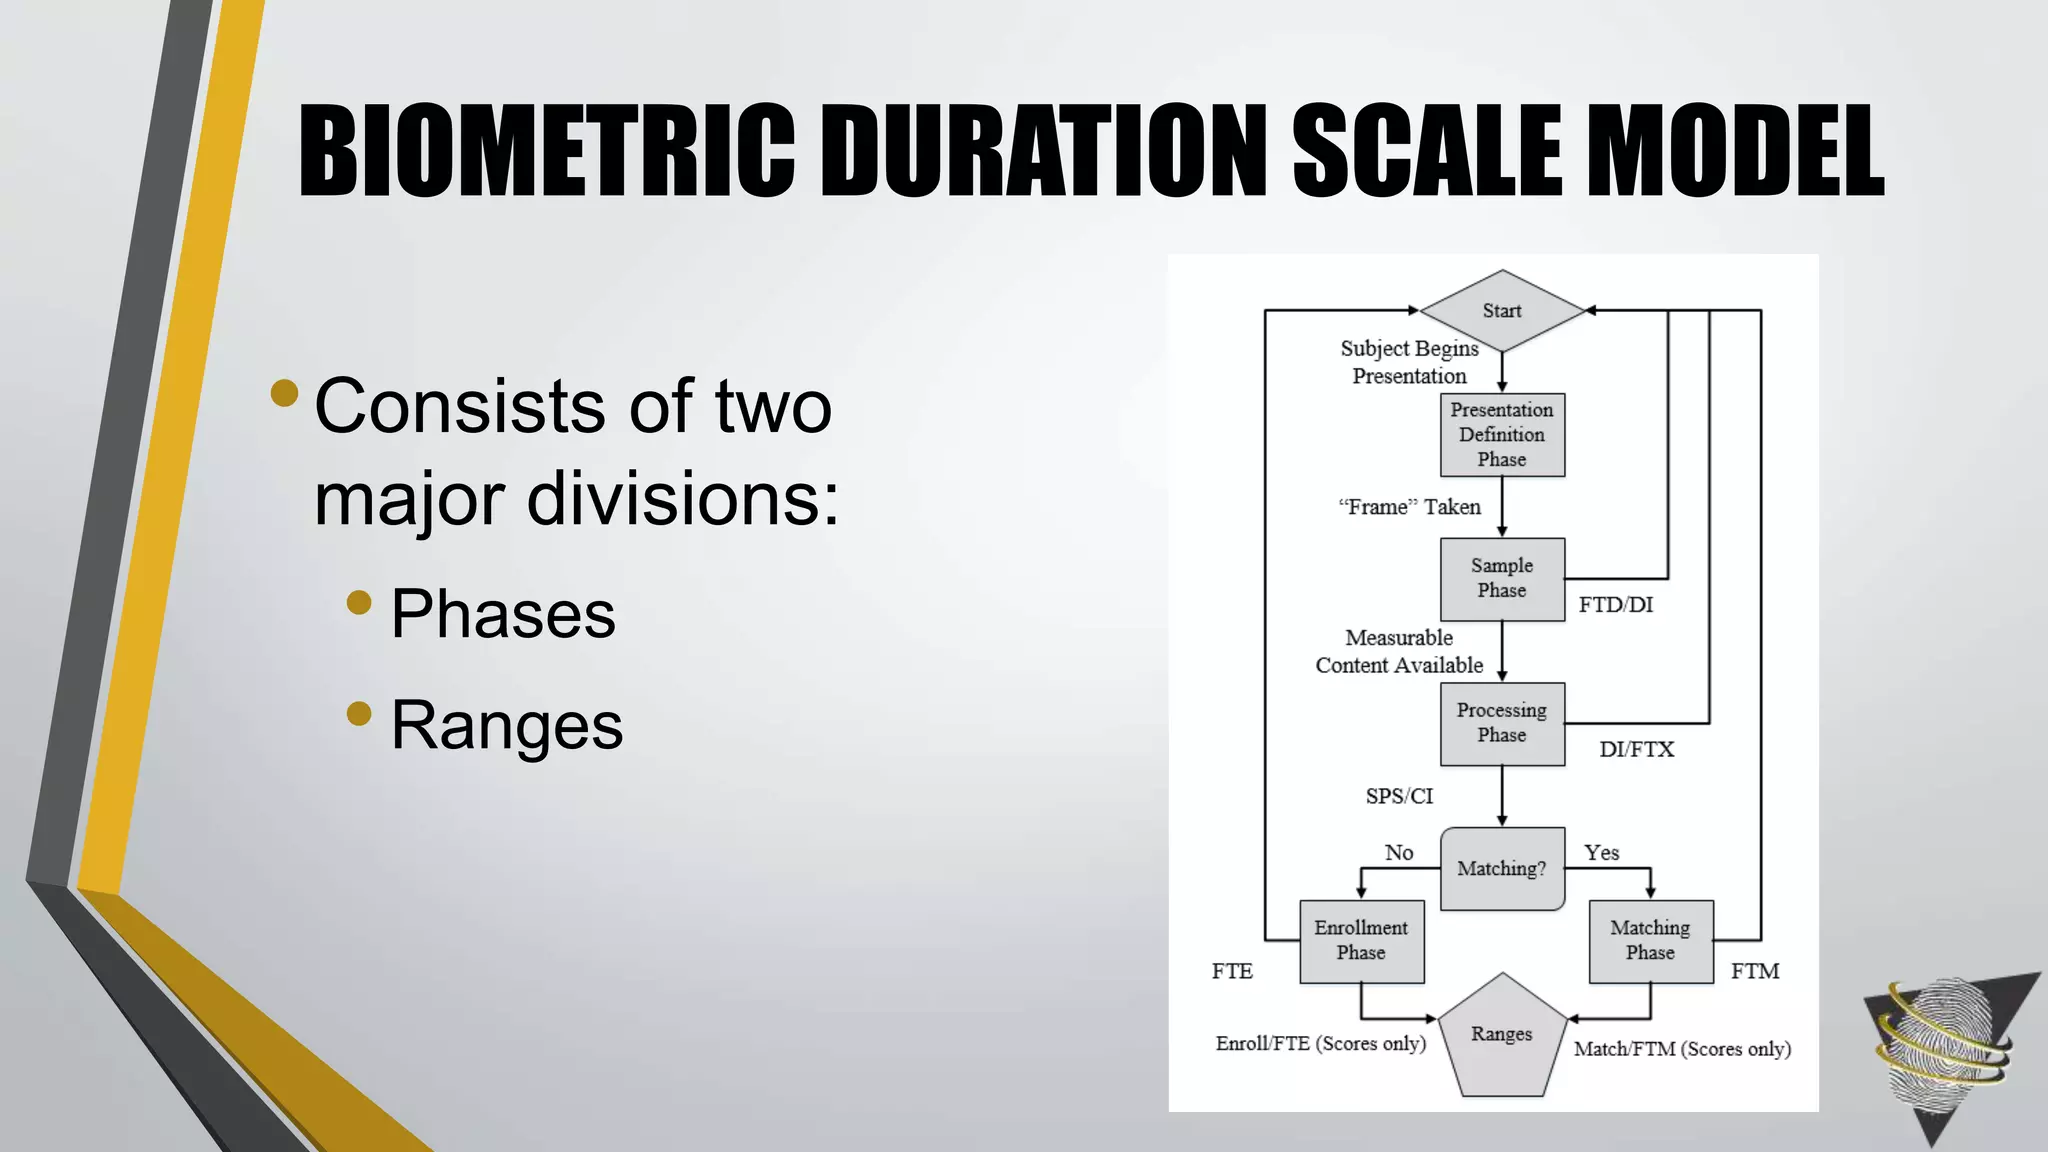
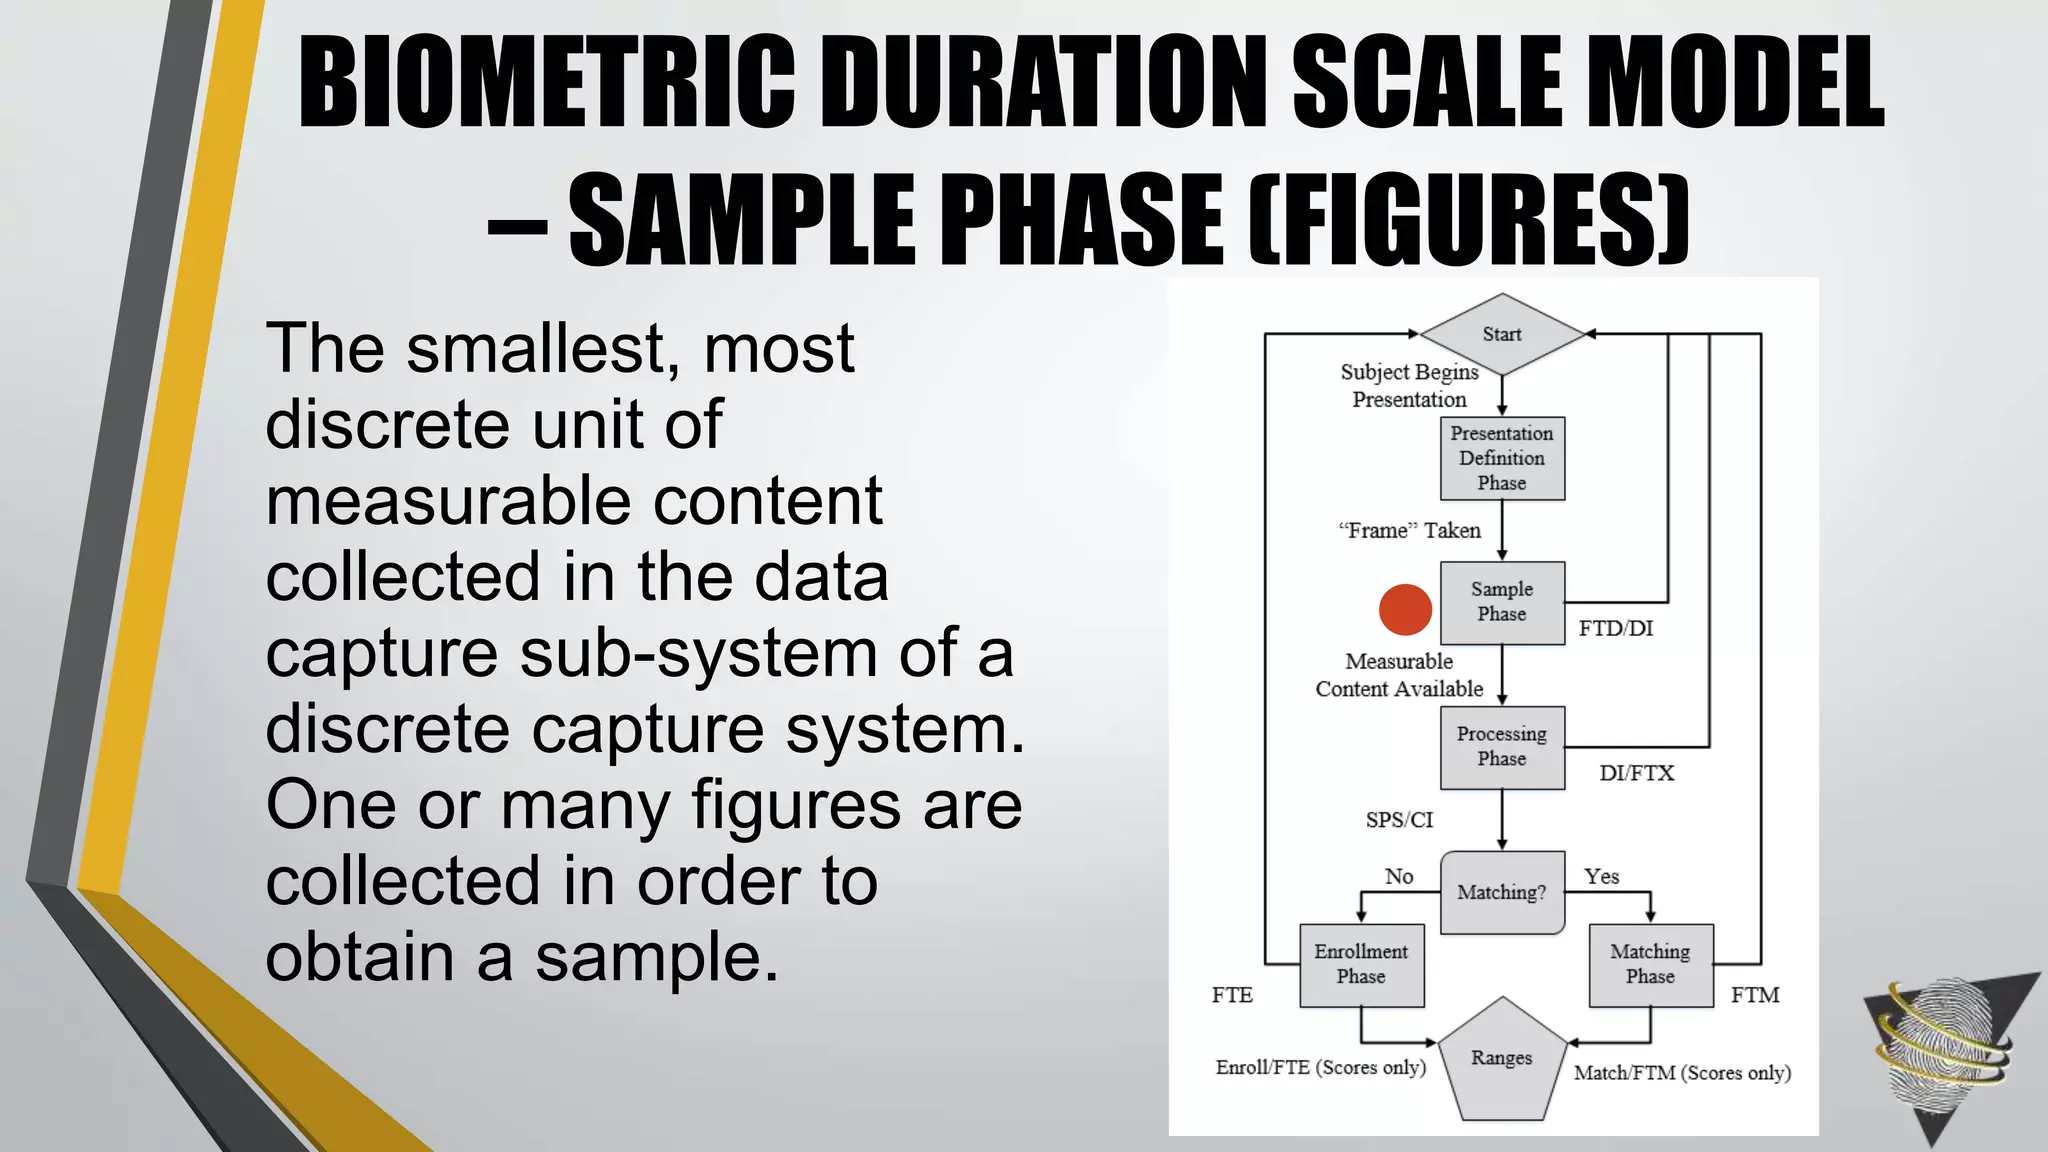
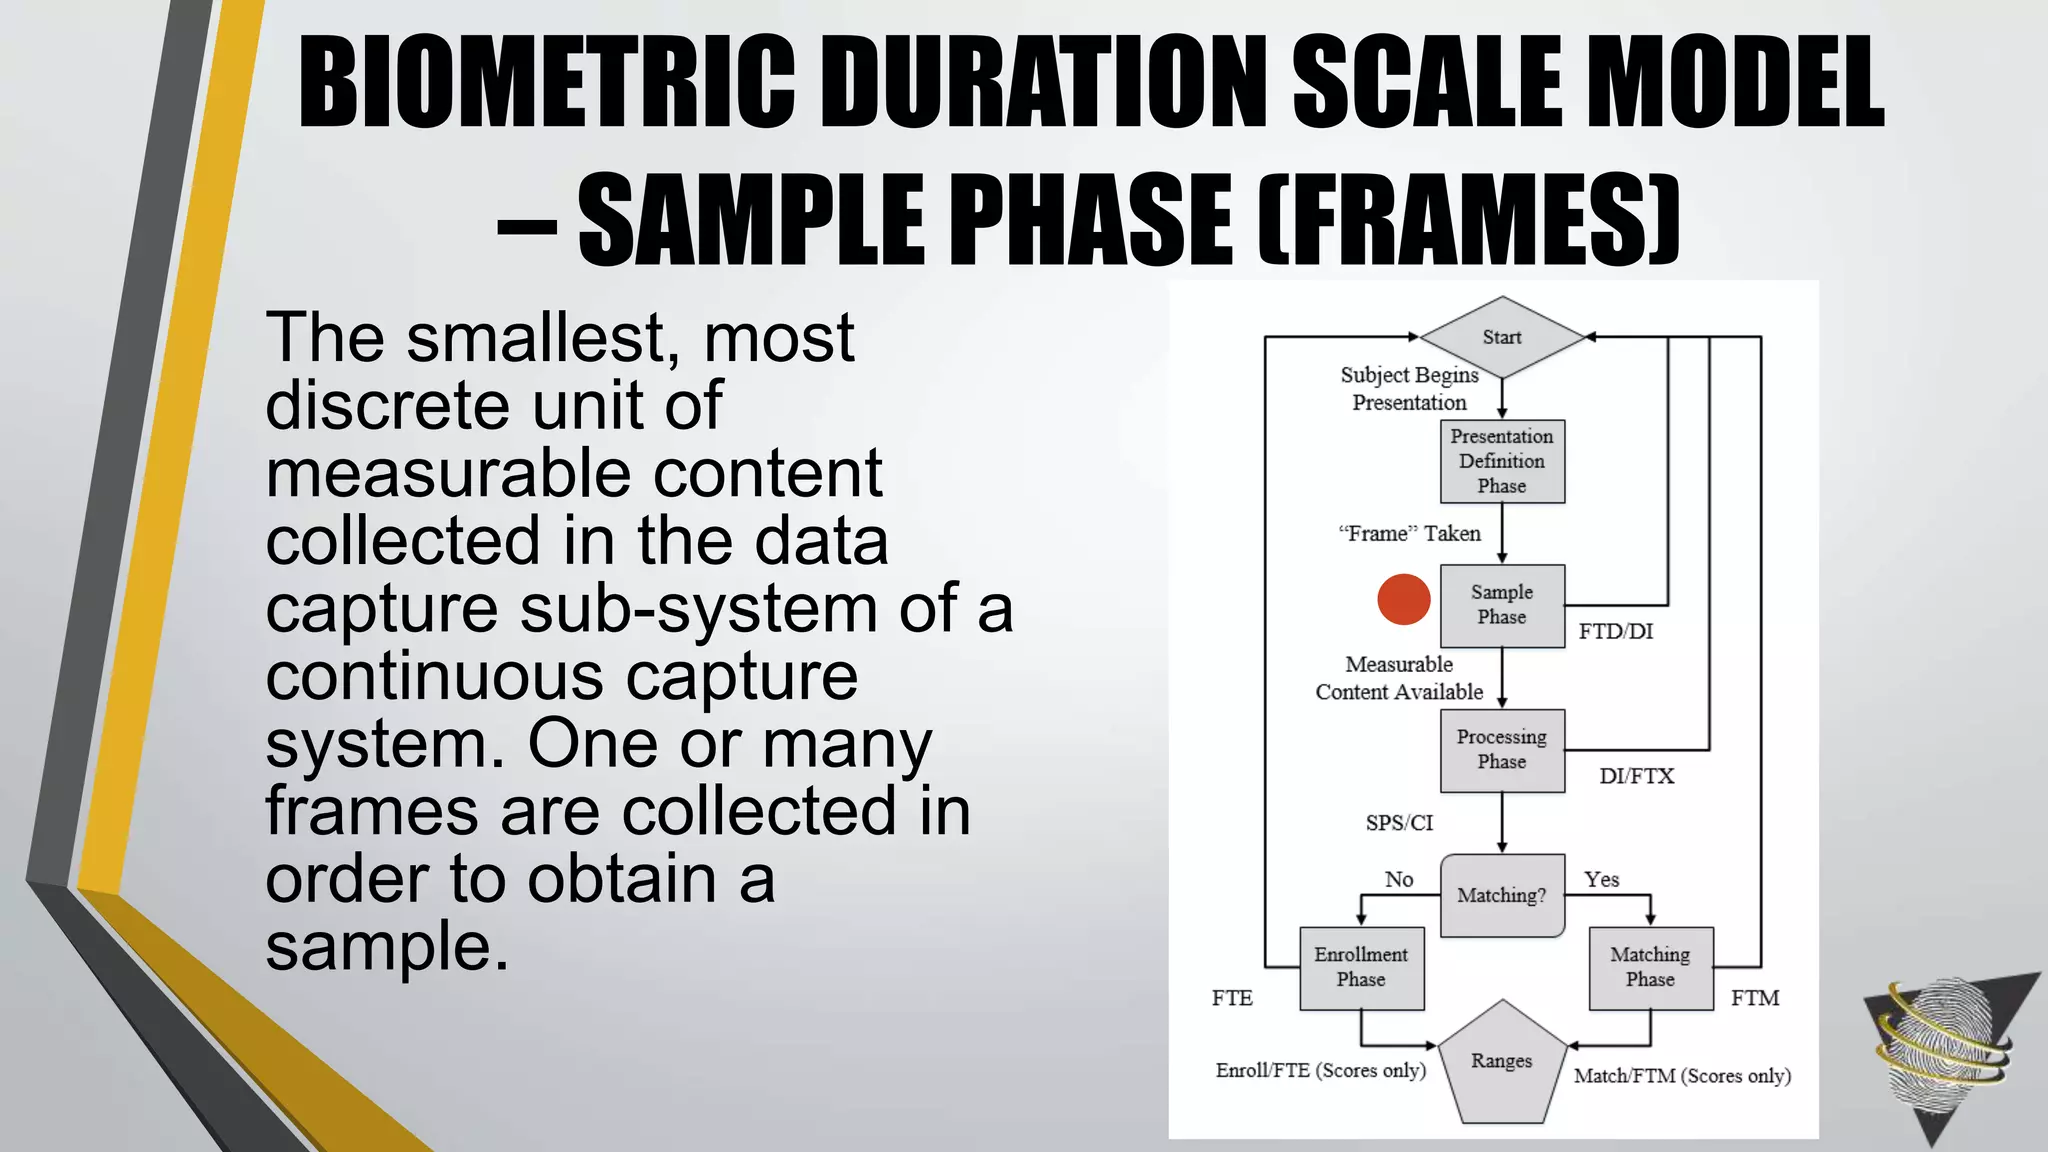
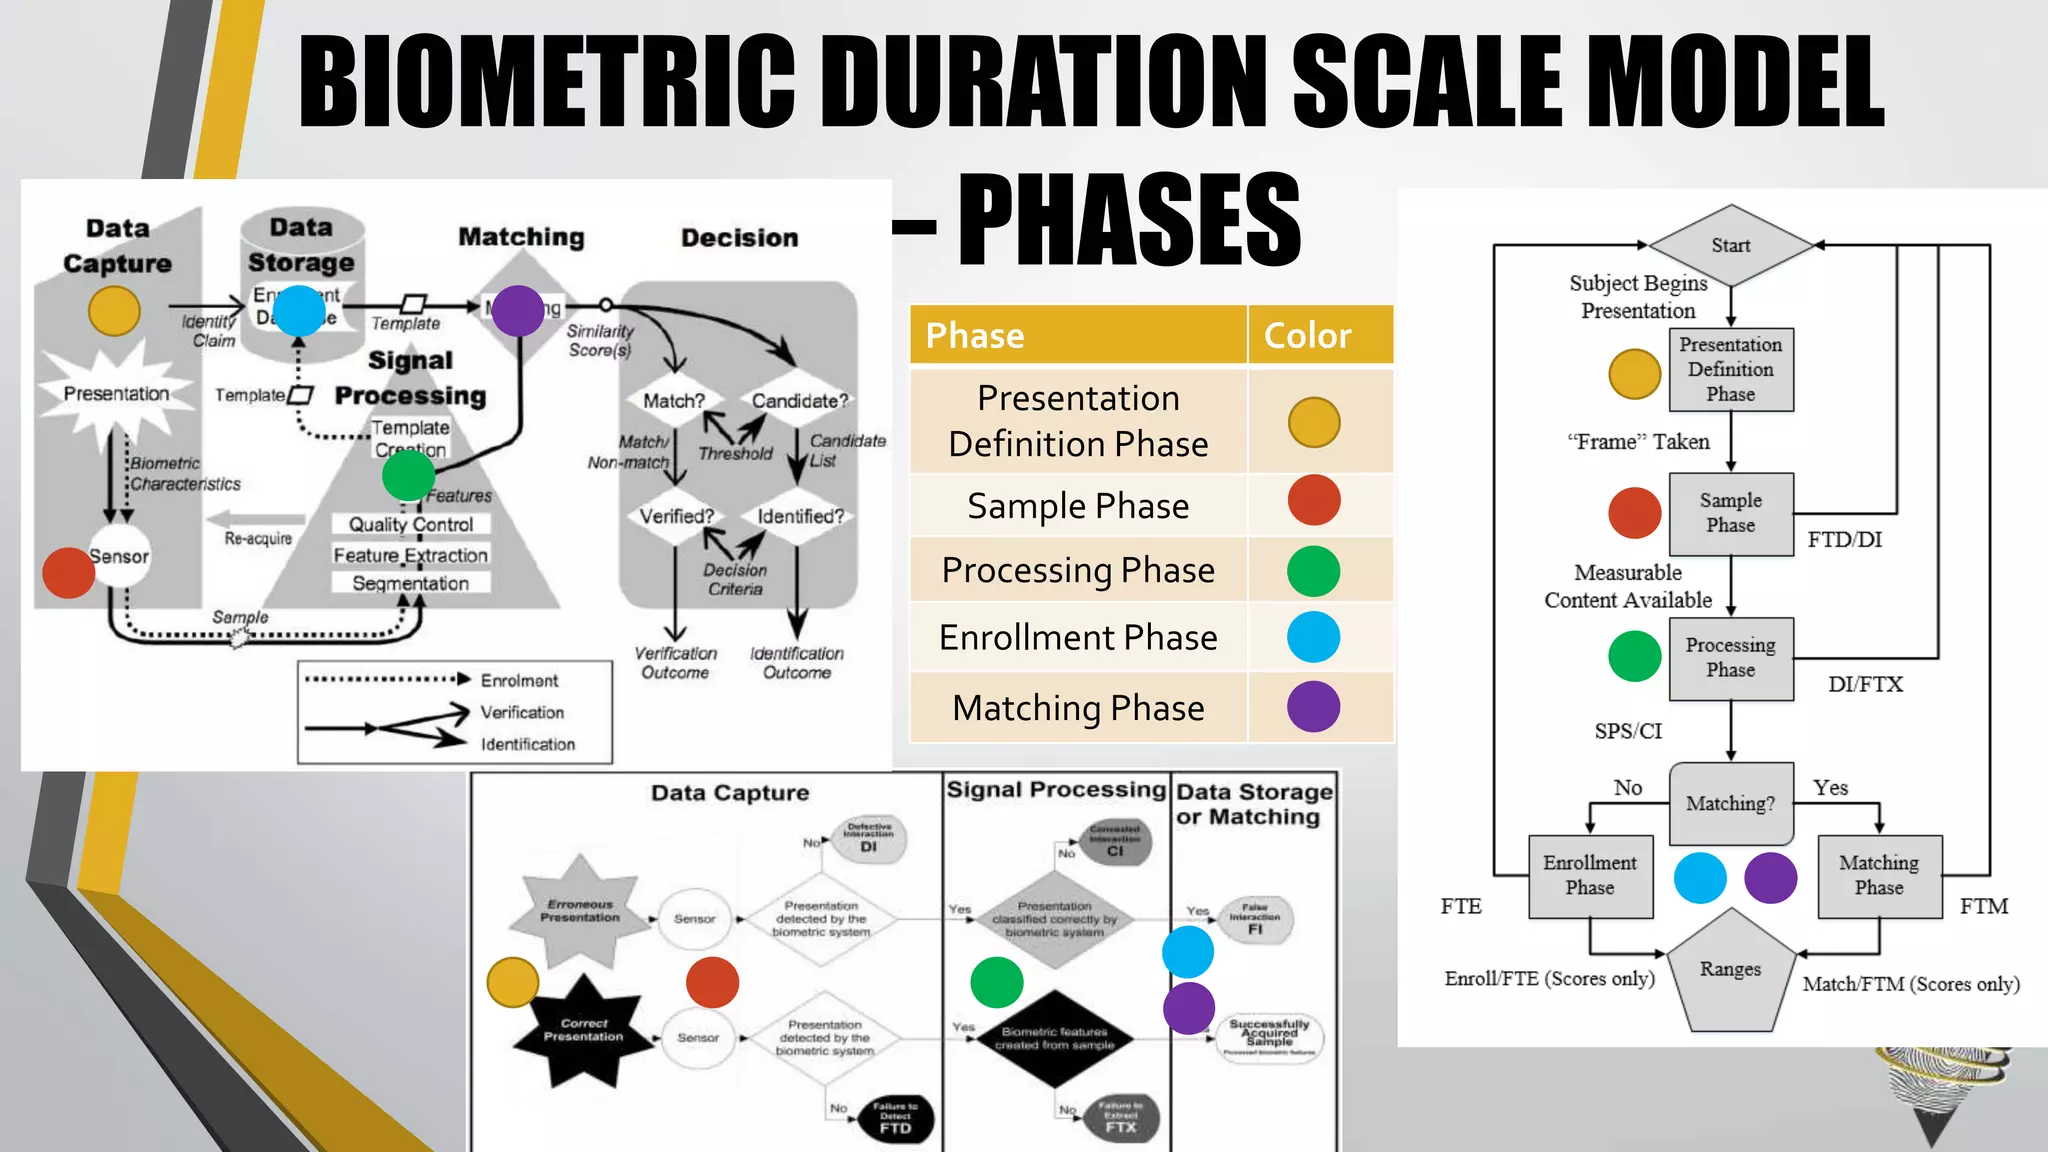
![•The general biometric model was in 1998 and aims
to identify “the common structures and parallelisms
between seemingly disparate methodologies” [12].
•The most recent version provides better clarity with
regards to data storage, matching, and decision
making processes
TAKING A STEP BACK – THE GENERAL
BIOMETRIC MODEL](https://image.slidesharecdn.com/timingpowerpoint-150311075202-conversion-gate01/75/Best-Practices-in-Reporting-Time-Duration-in-Biometrics-30-2048.jpg)
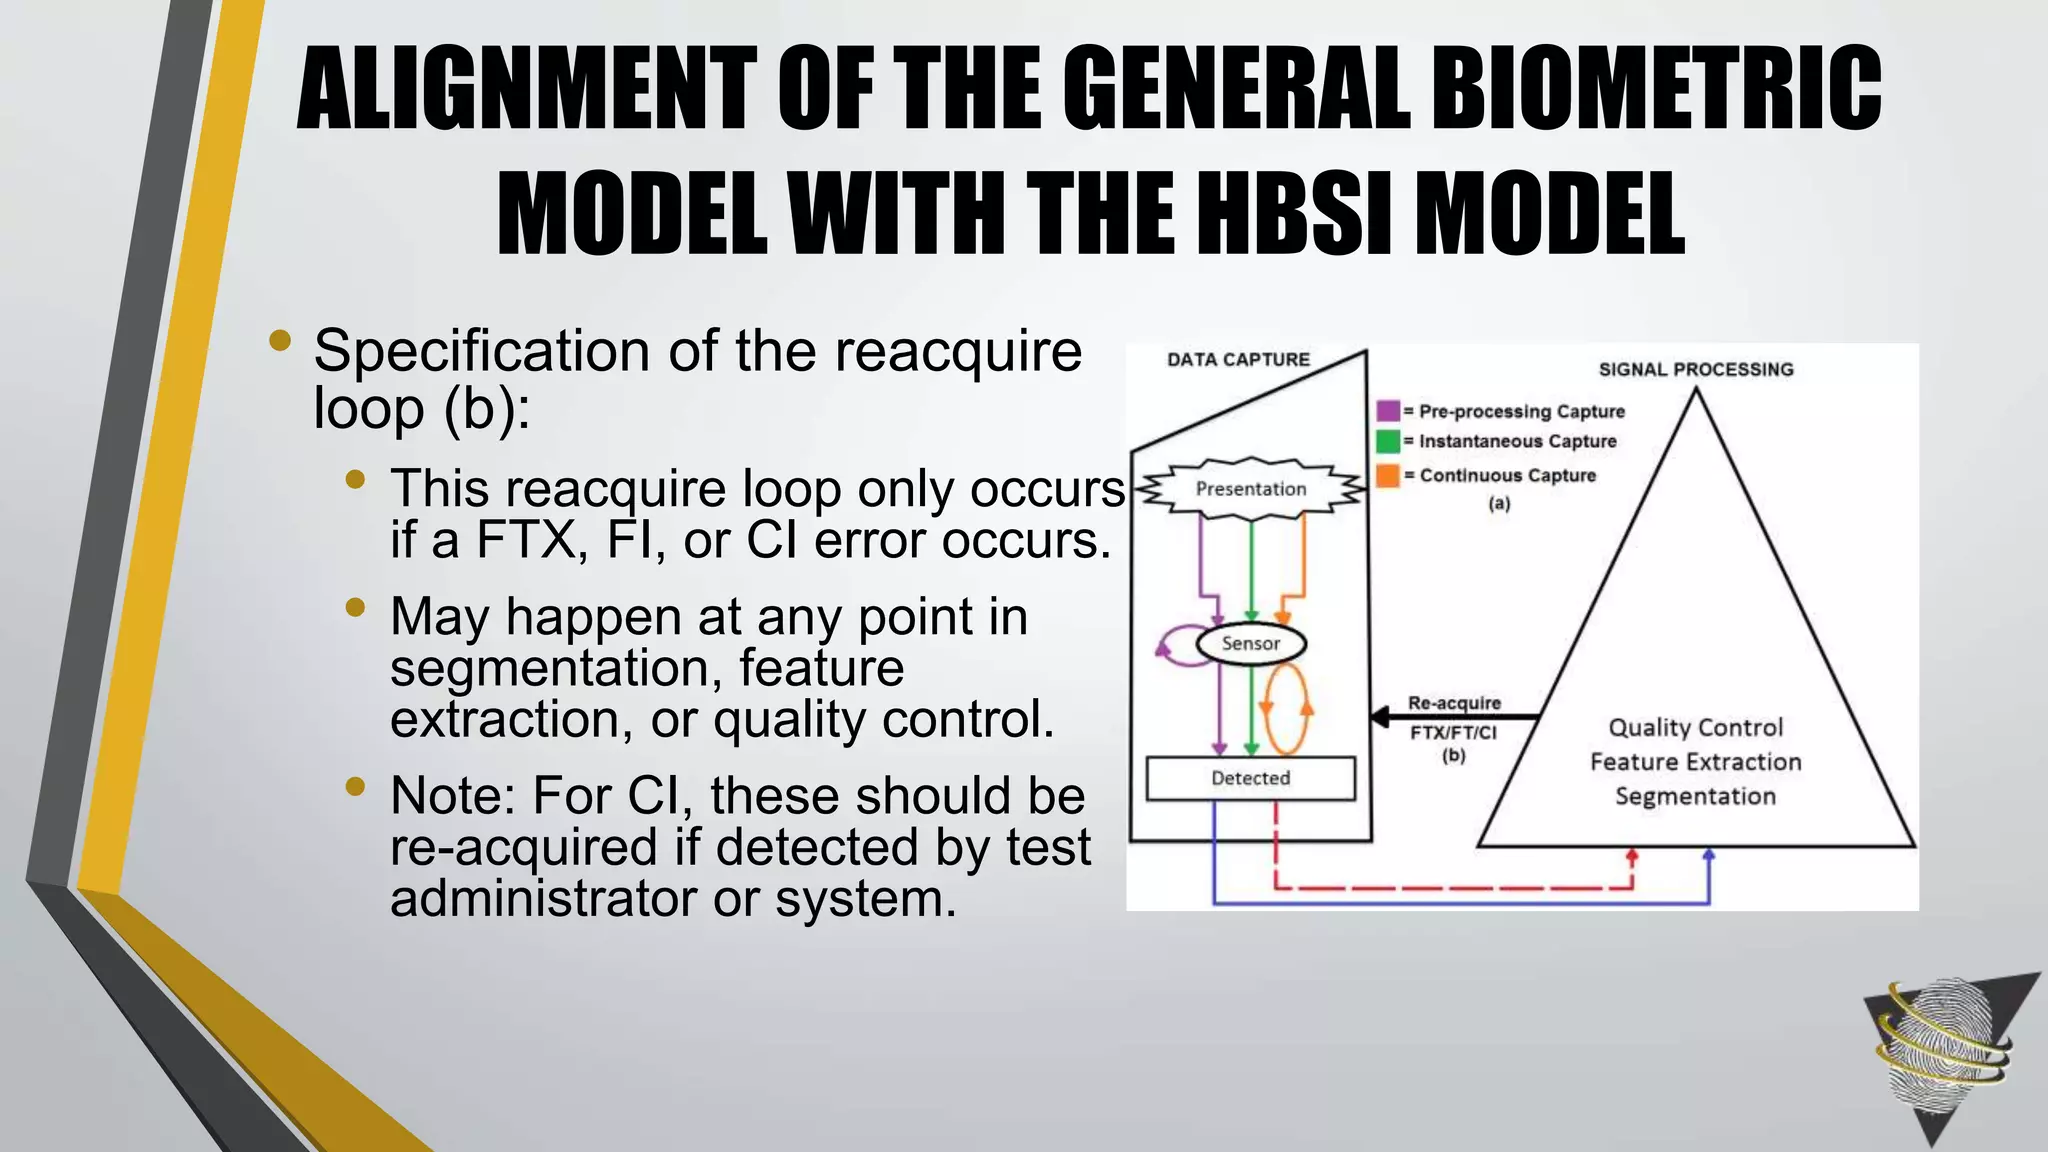
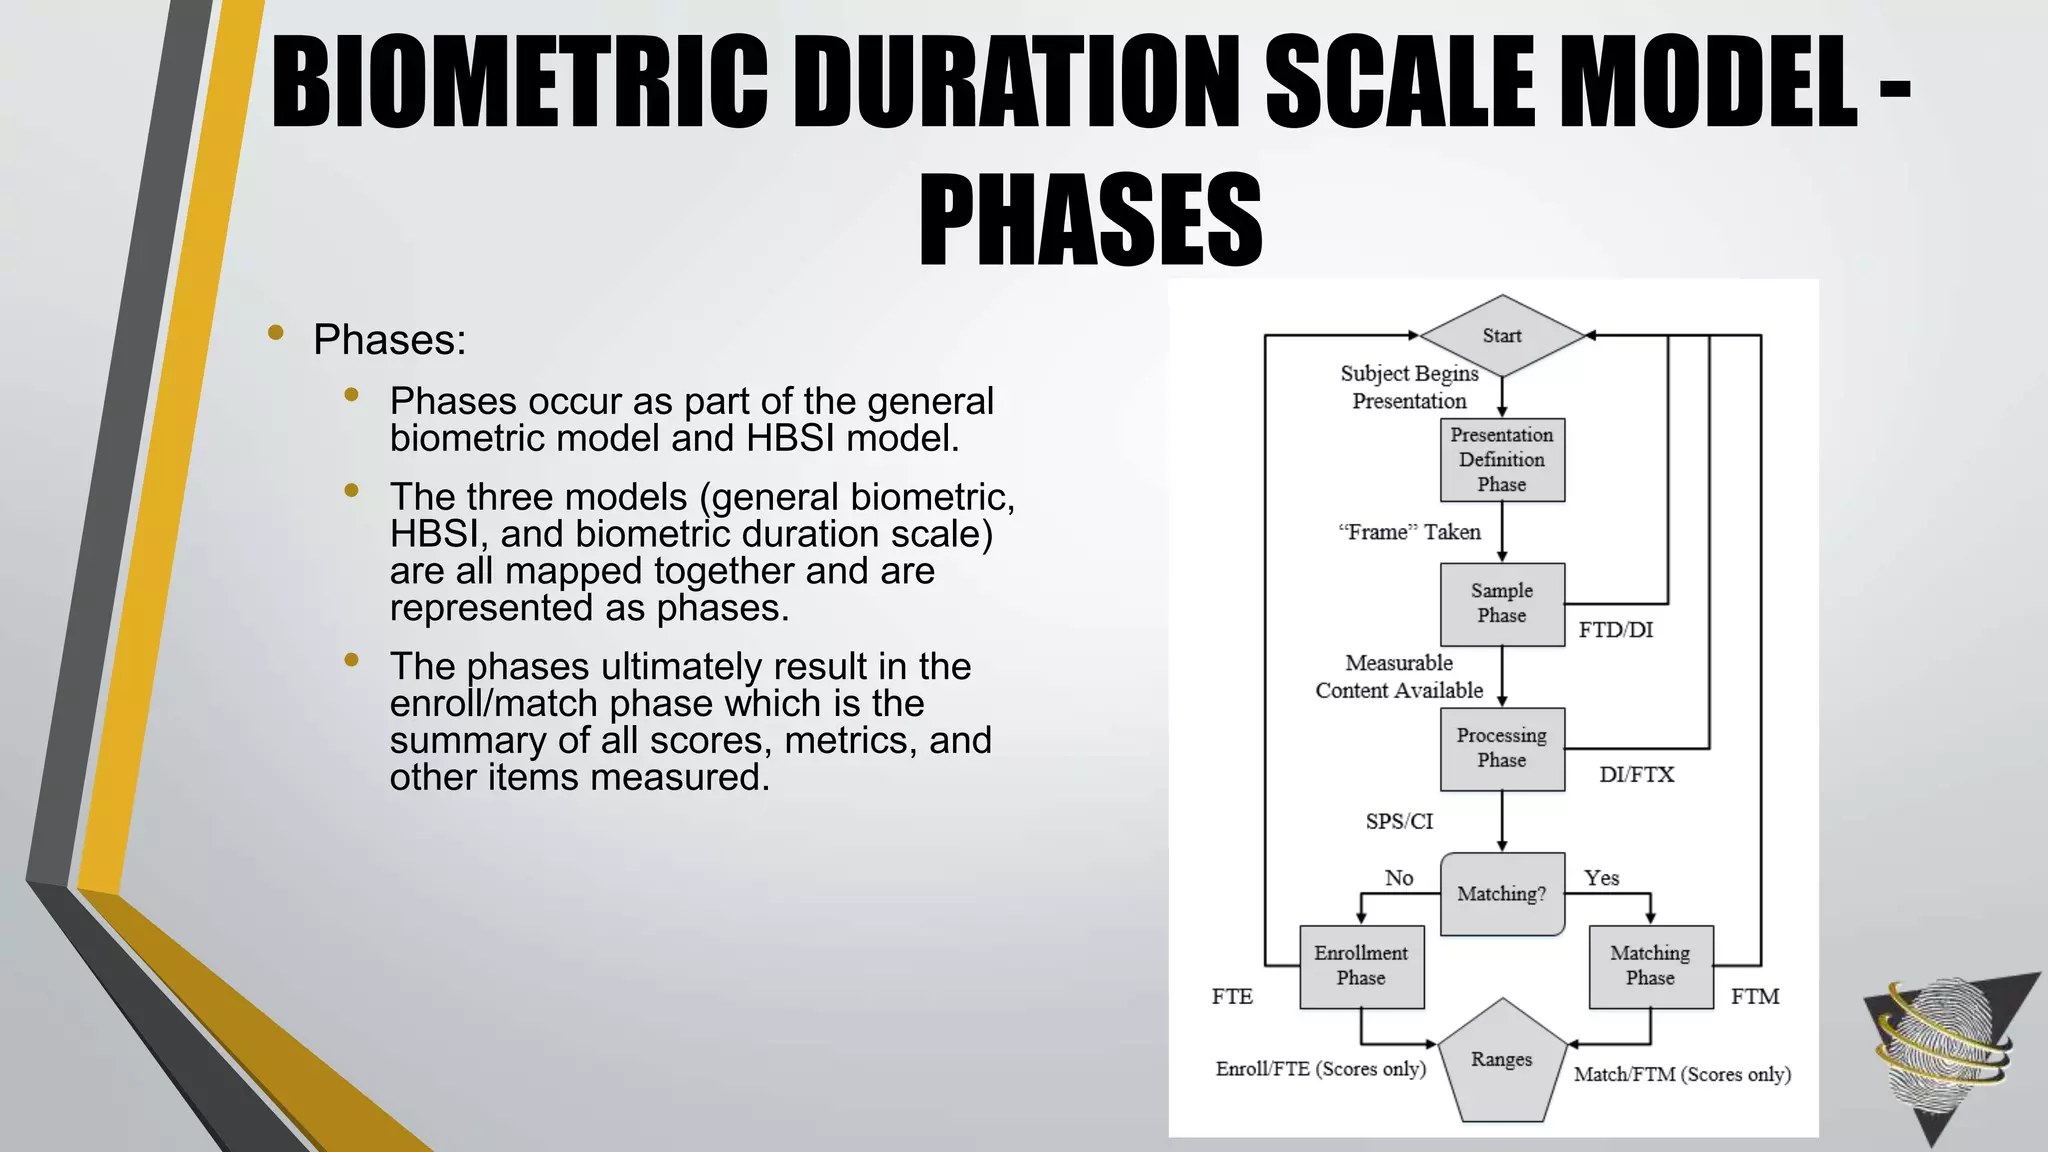
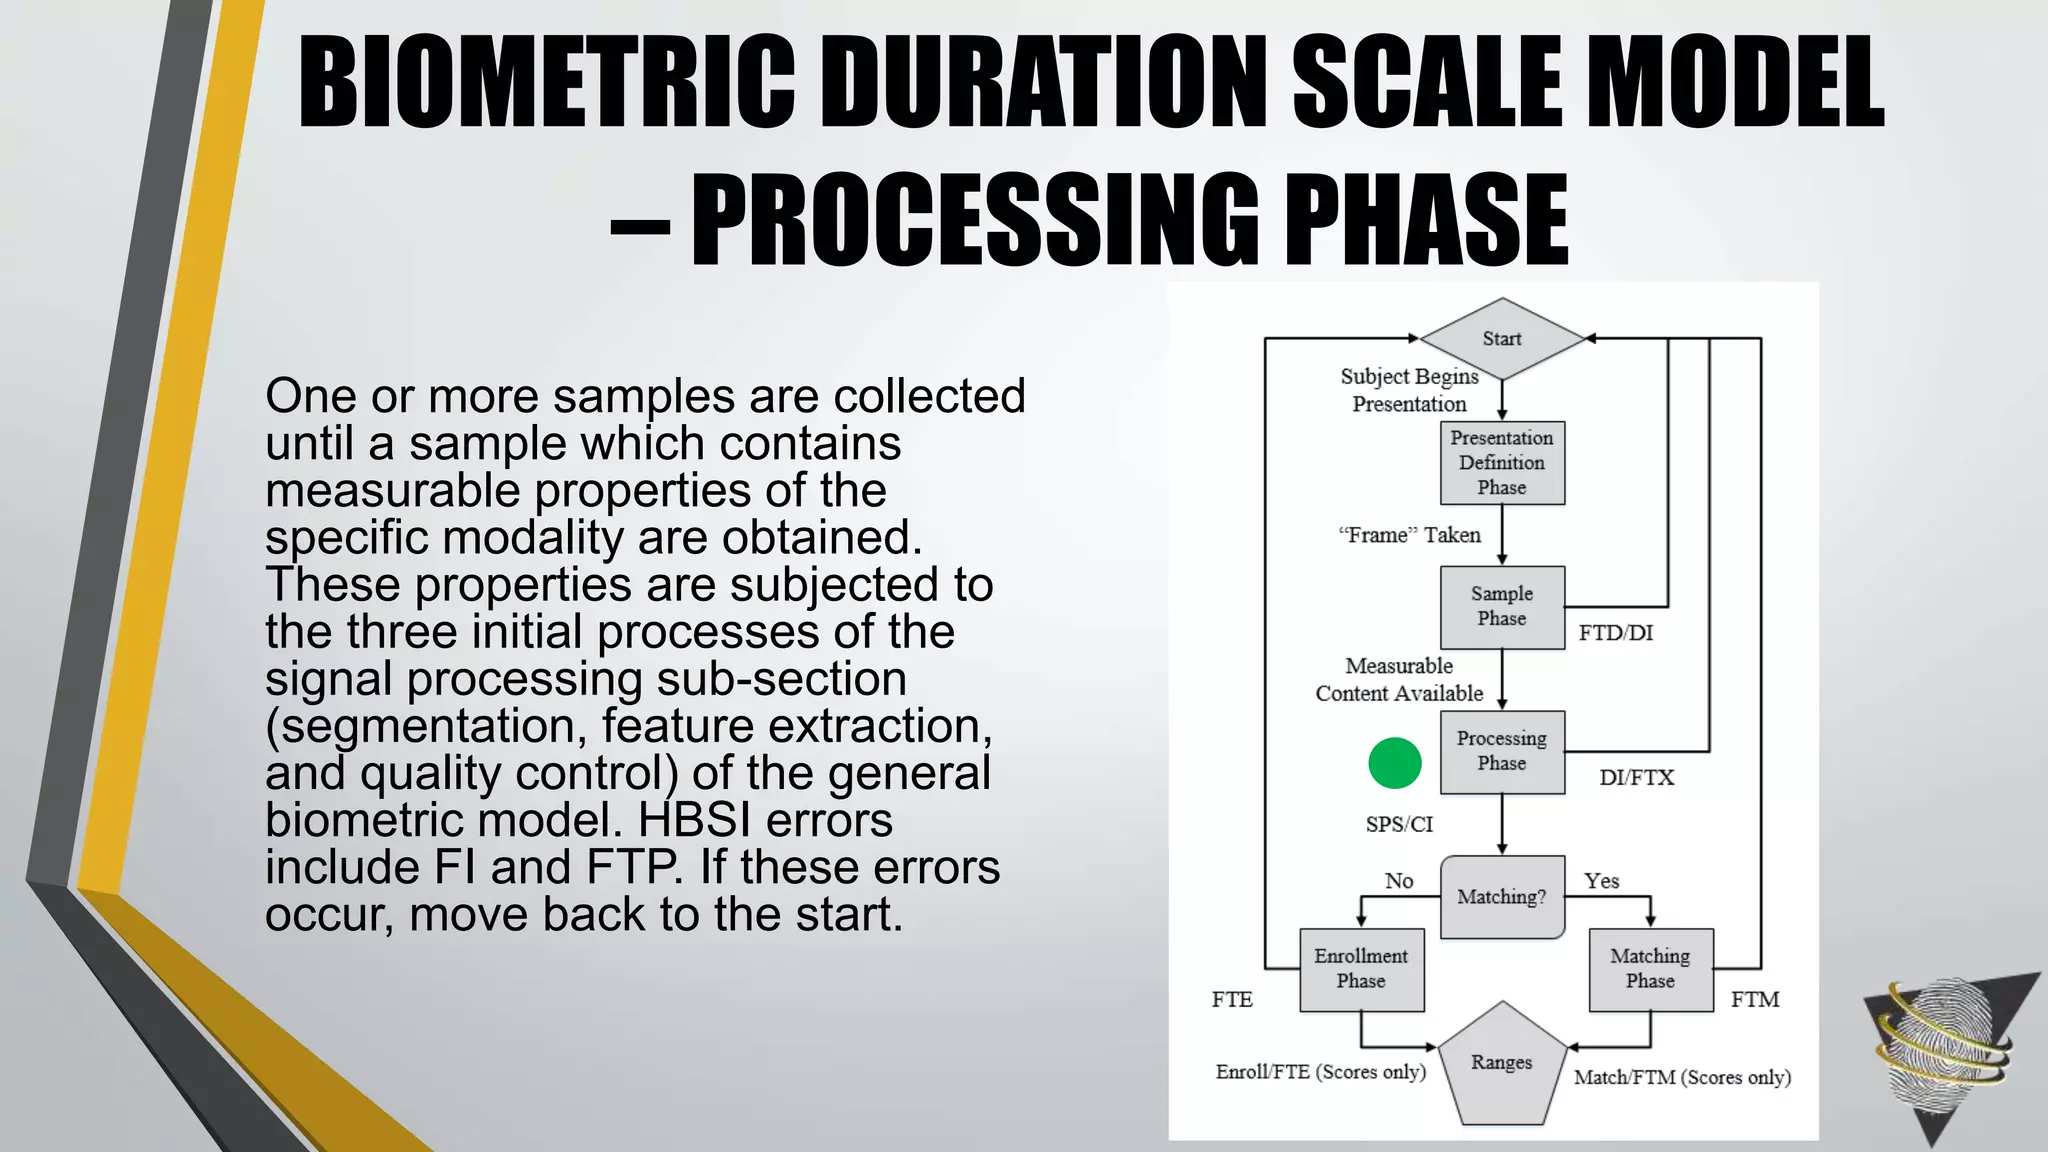
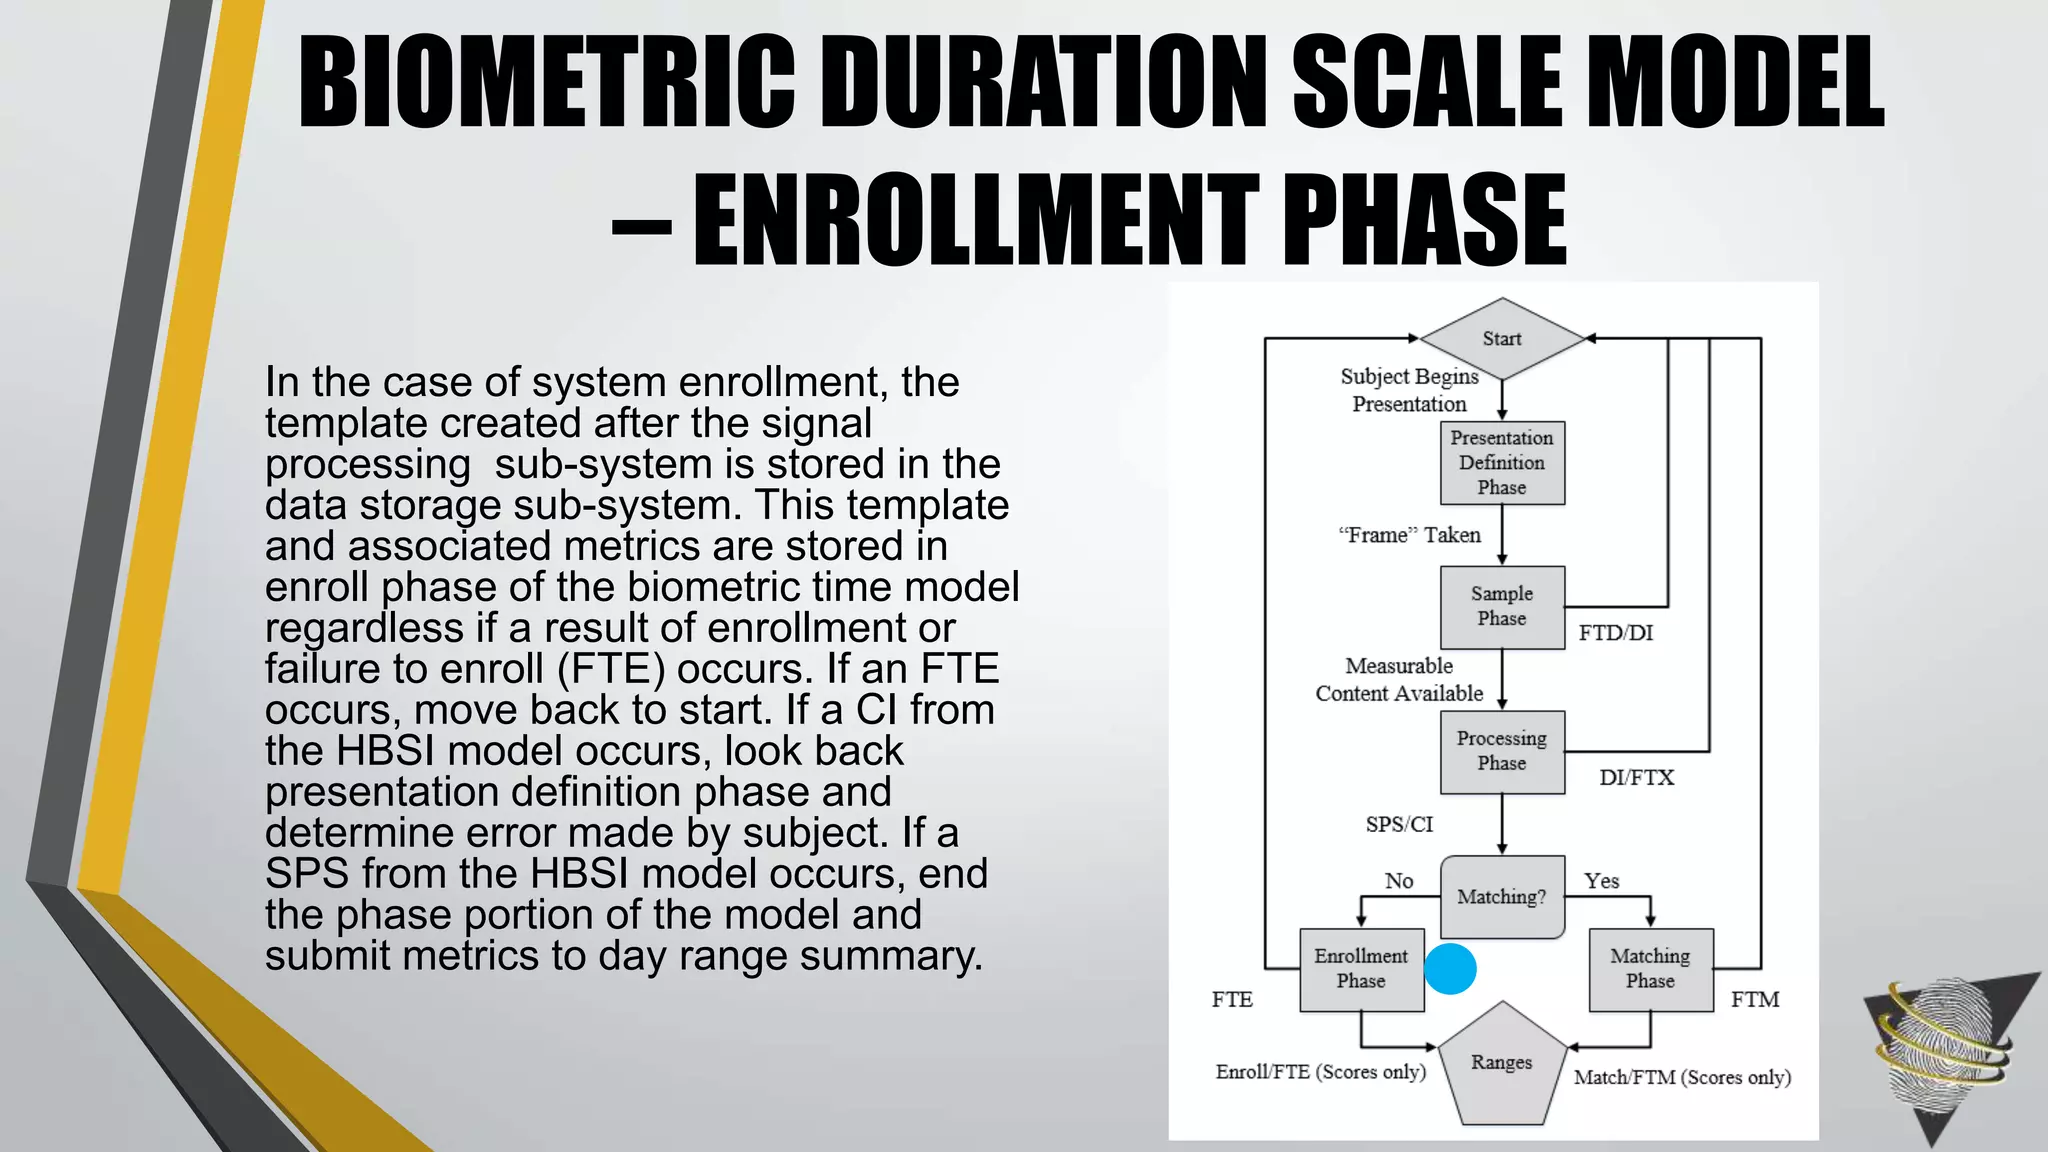
![• The Human-Biometric Sensor Interaction (HBSI) model was created “to demonstrate
how metrics from biometrics (sample quality and system performance), ergonomics
(physical and cognitive), and usability (efficiency, effectiveness, and satisfaction)
overlap and can be used to evaluate overall functionality and performance of a
biometric system” [13].
• Strengths of the HBSI model
• The ability to define how to user interacts with a system
• What errors, especially common ones, are made by the user
• What is causing these errors to occur repeatedly
• How well does the user need to be trained to correctly interact with the system
THE HUMAN BIOMETRIC-SENSOR
(HBSI) MODEL](https://image.slidesharecdn.com/timingpowerpoint-150311075202-conversion-gate01/75/Best-Practices-in-Reporting-Time-Duration-in-Biometrics-32-2048.jpg)
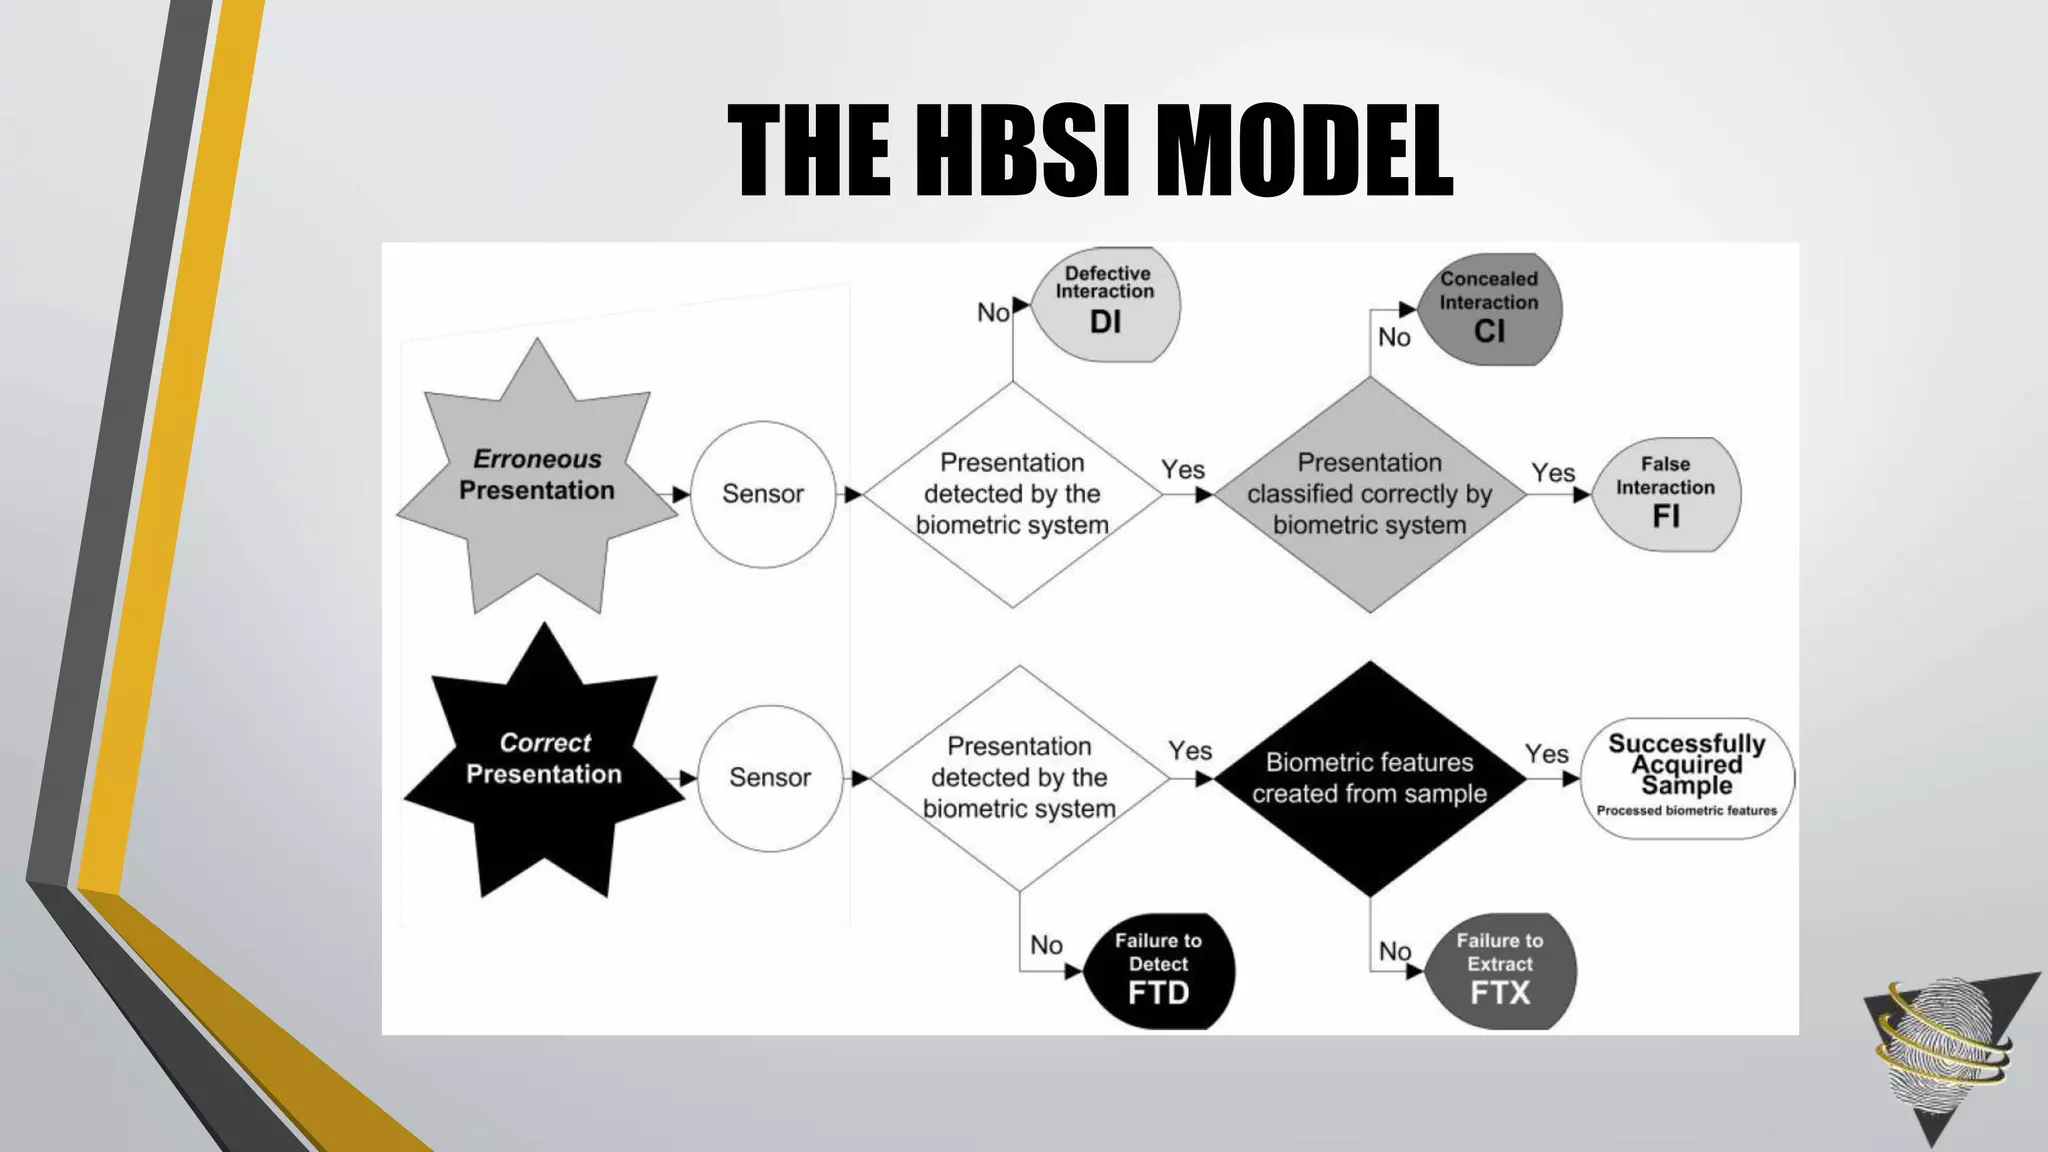
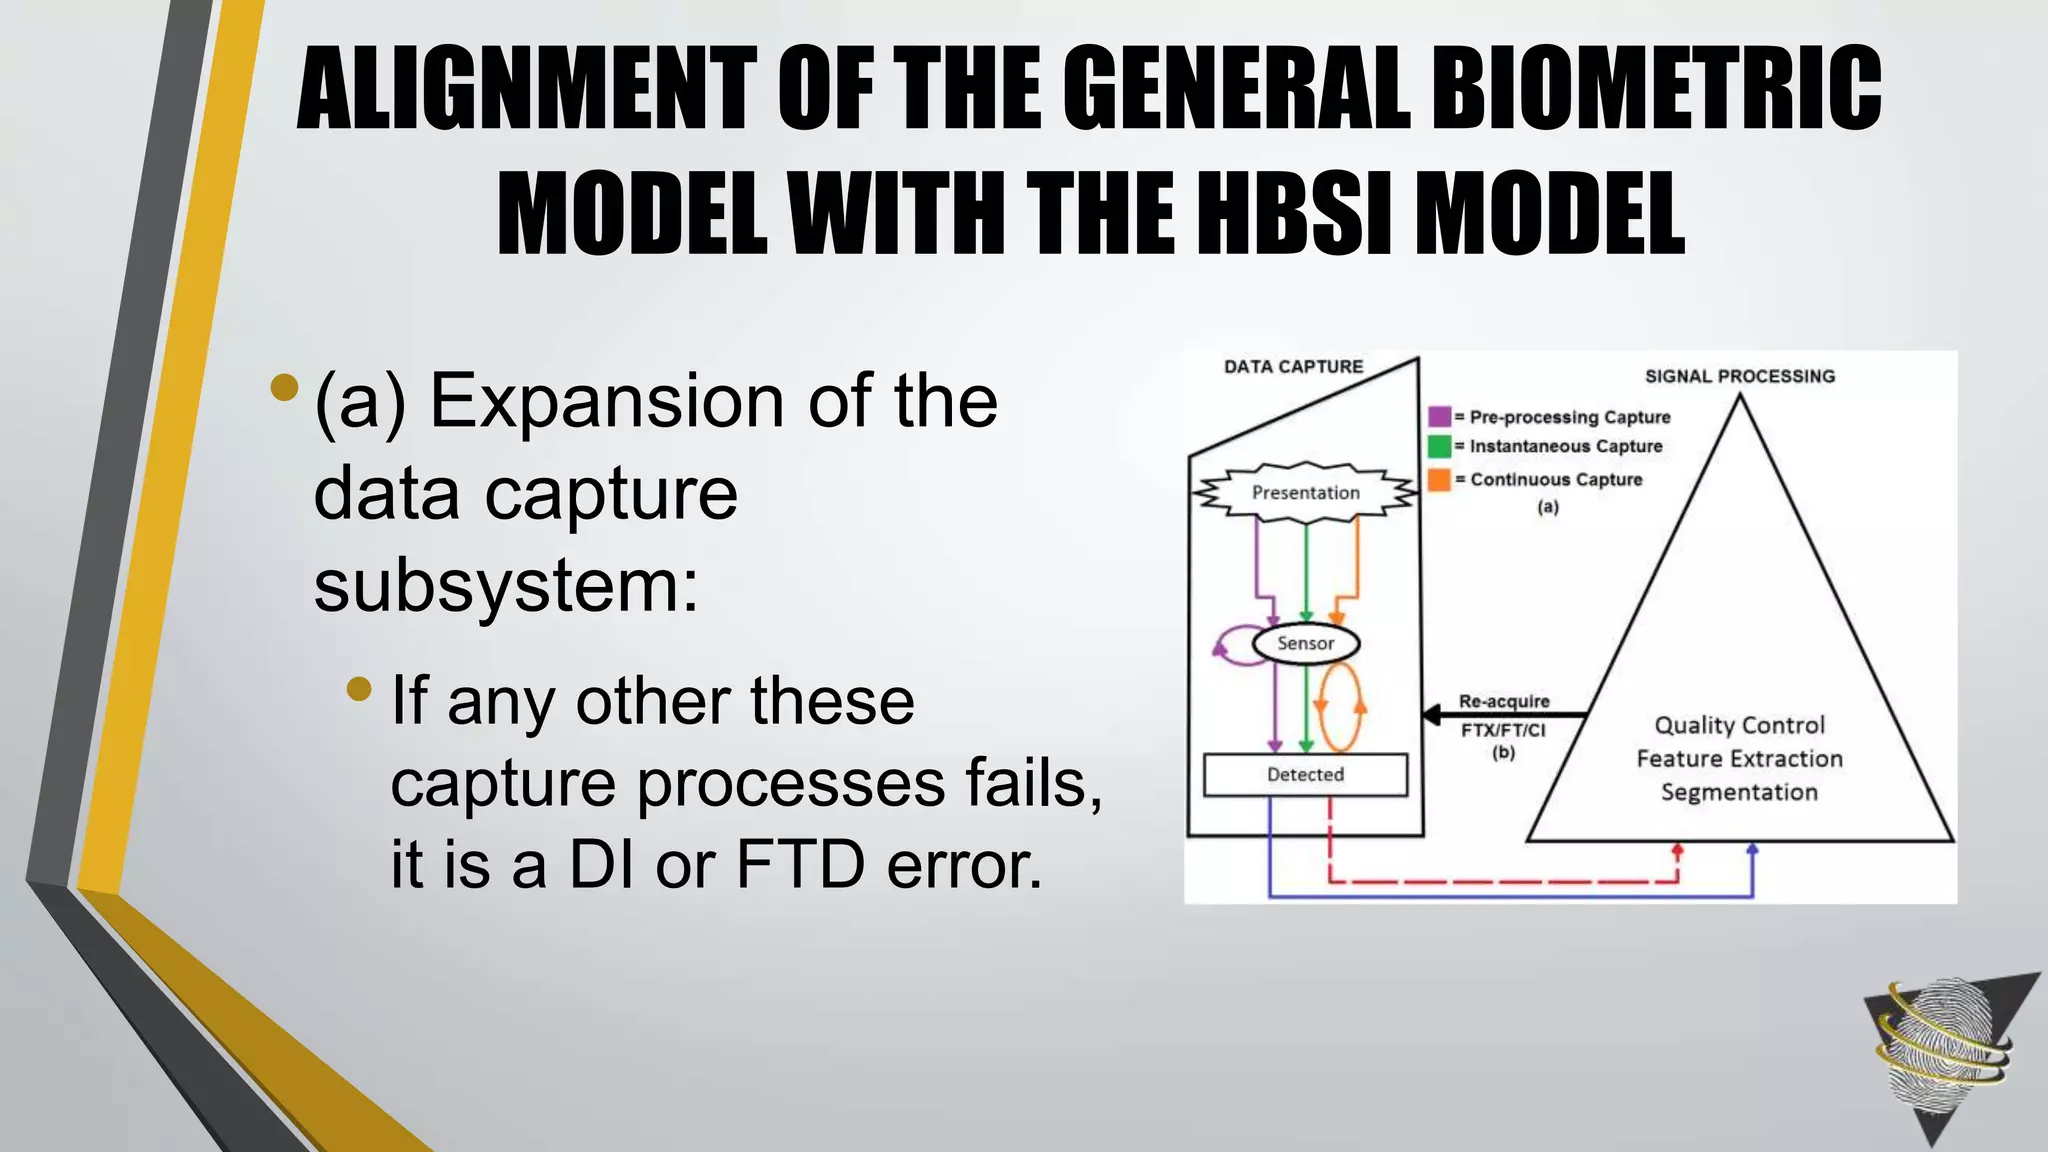
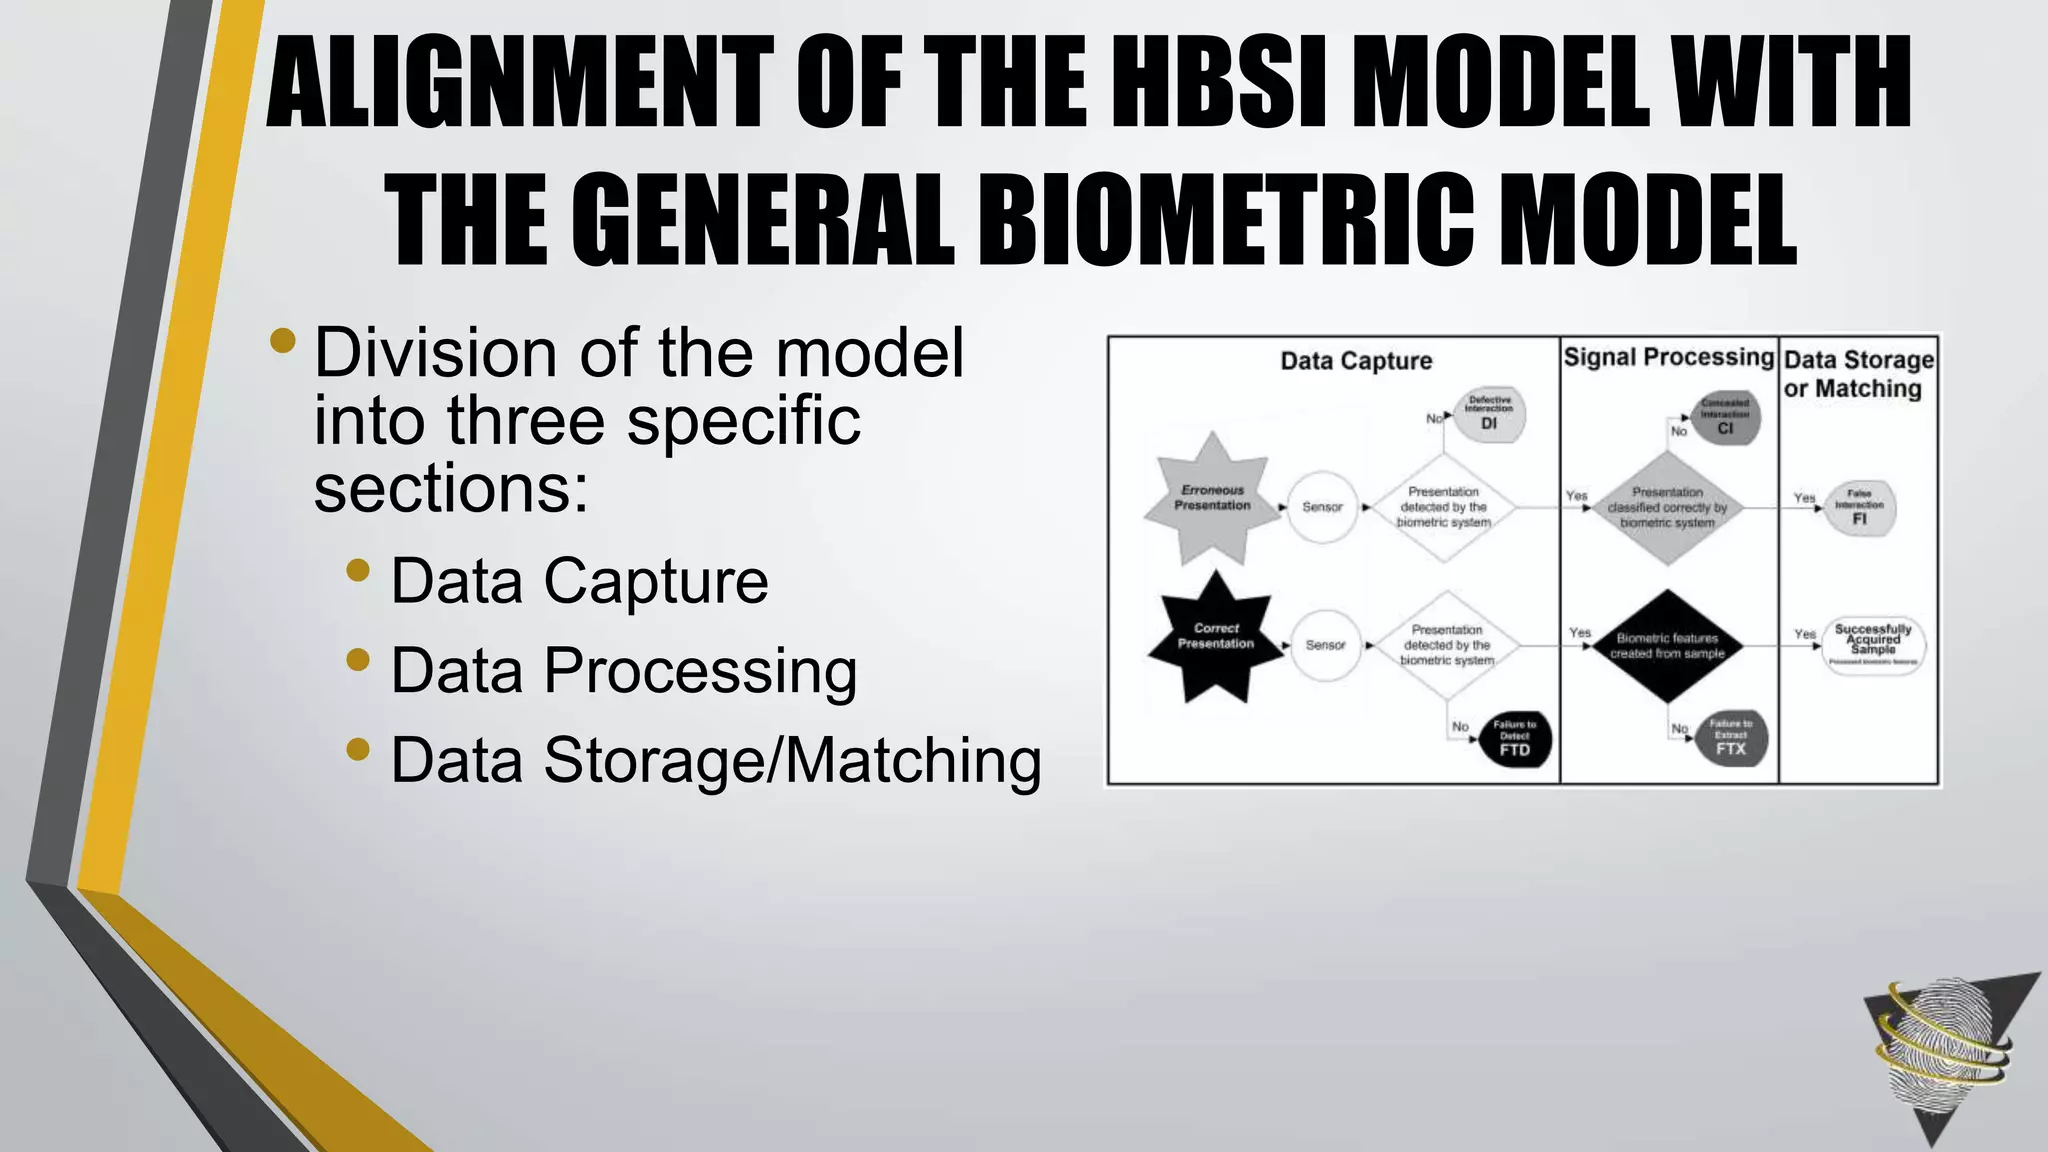
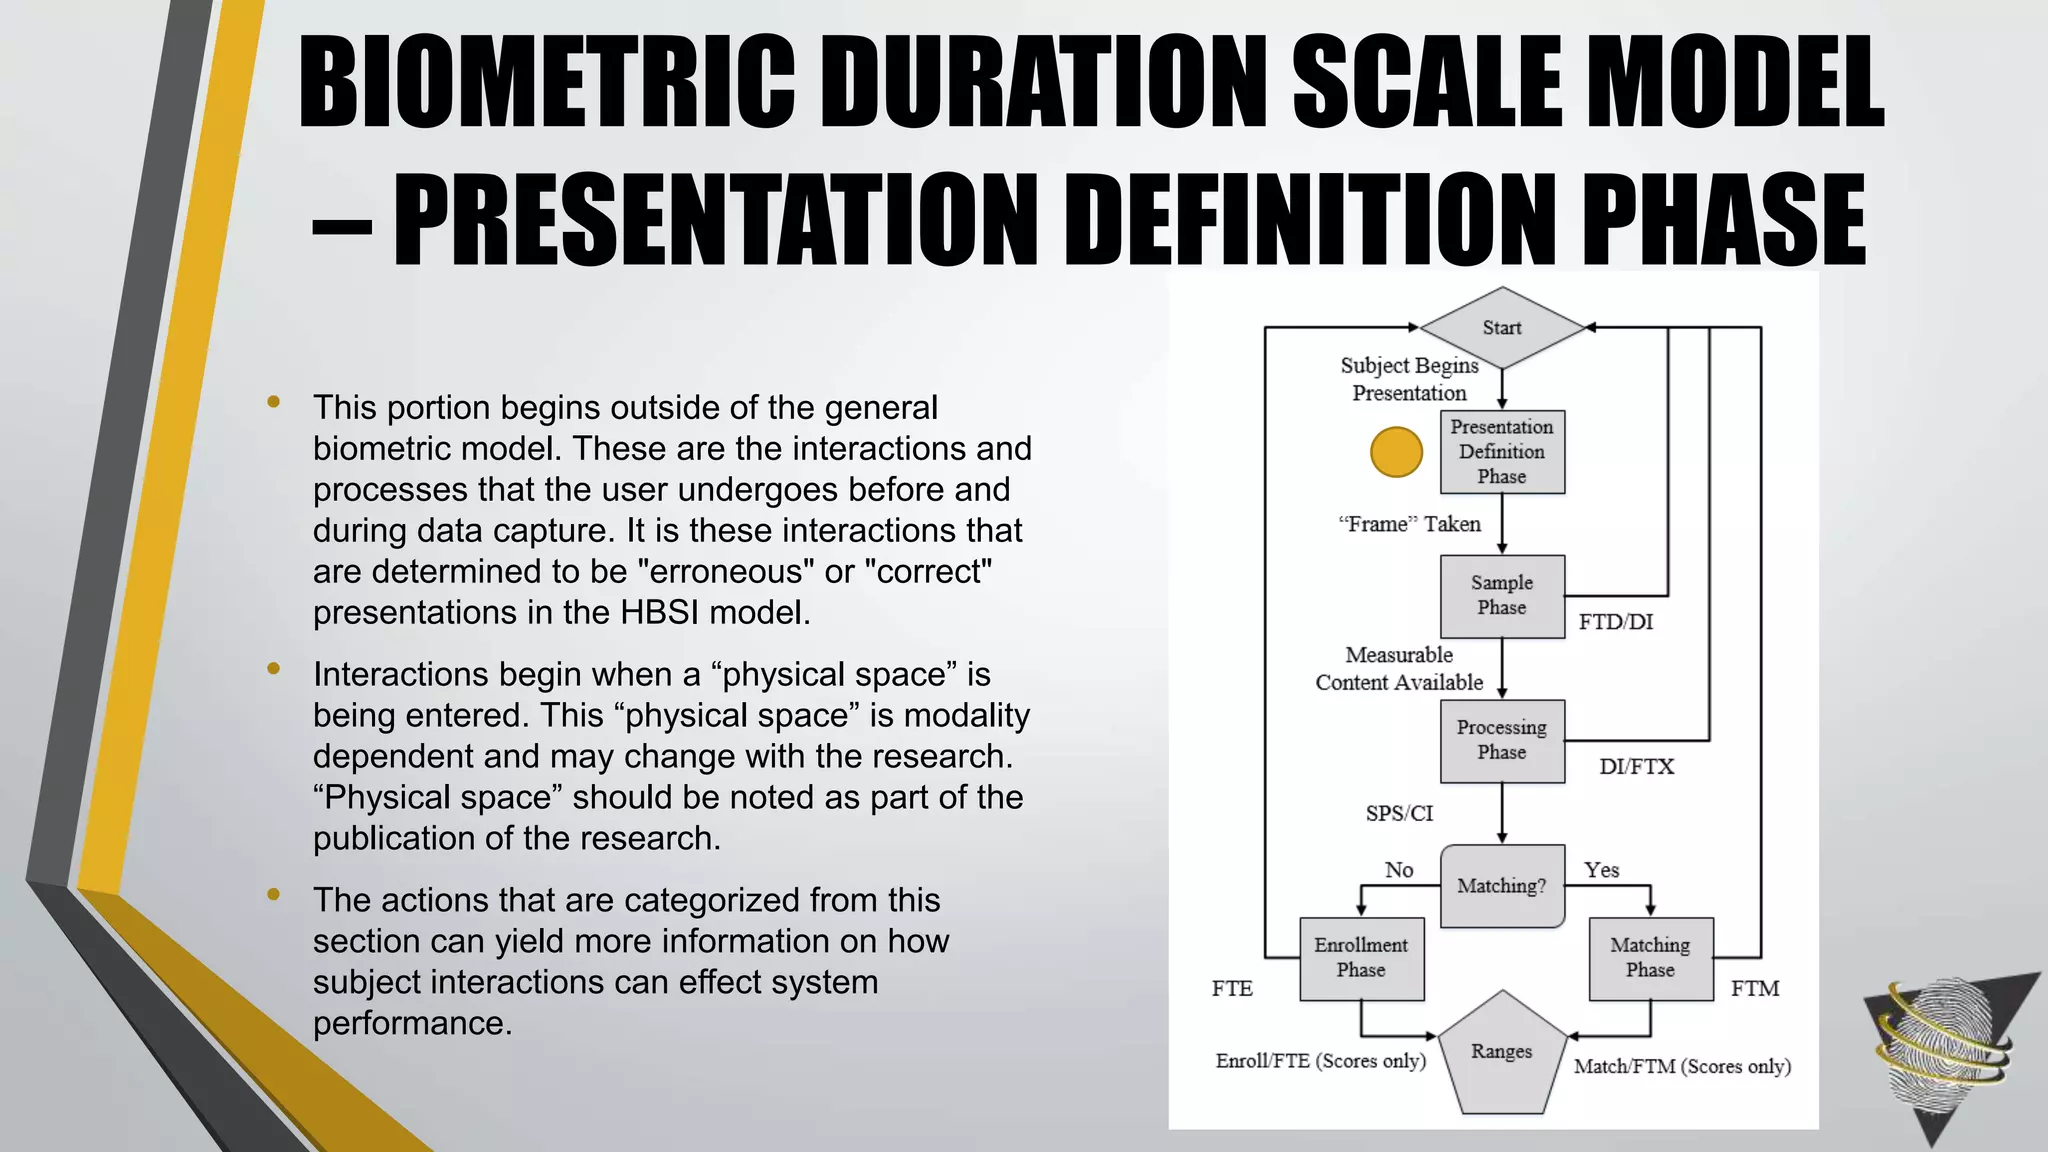
![• Erroneous Presentation: Any presentation, whether made with malicious intent or not, that was not
performed to the specifications of the particular biometric sensor collecting the sample.
• Defective Interaction (DI): “…occurs when a bad presentation is made to the biometric sensor and
is not detected by the system” [13].
• Concealed Interaction (CI): “…occurs when an erroneous presentation is made to the sensor that is
detected by the biometric system, but is not handled or classified correctly as an ‘error’ by the
biometric system” [13].
• False Interaction (FI): “…occurs when a user presents their biometric features to the biometric
system, which are detected by the system and is correctly classified by the system as erroneous
due to a fault or errors that originated from an incorrect action, behavior, or movement executed by
the user” [13]
HBSI COMPONENT DEFINITIONS](https://image.slidesharecdn.com/timingpowerpoint-150311075202-conversion-gate01/75/Best-Practices-in-Reporting-Time-Duration-in-Biometrics-34-2048.jpg)
![• Correct Presentation: Any presentation that was performed within the specifications of the particular
biometric sensor collecting the sample.
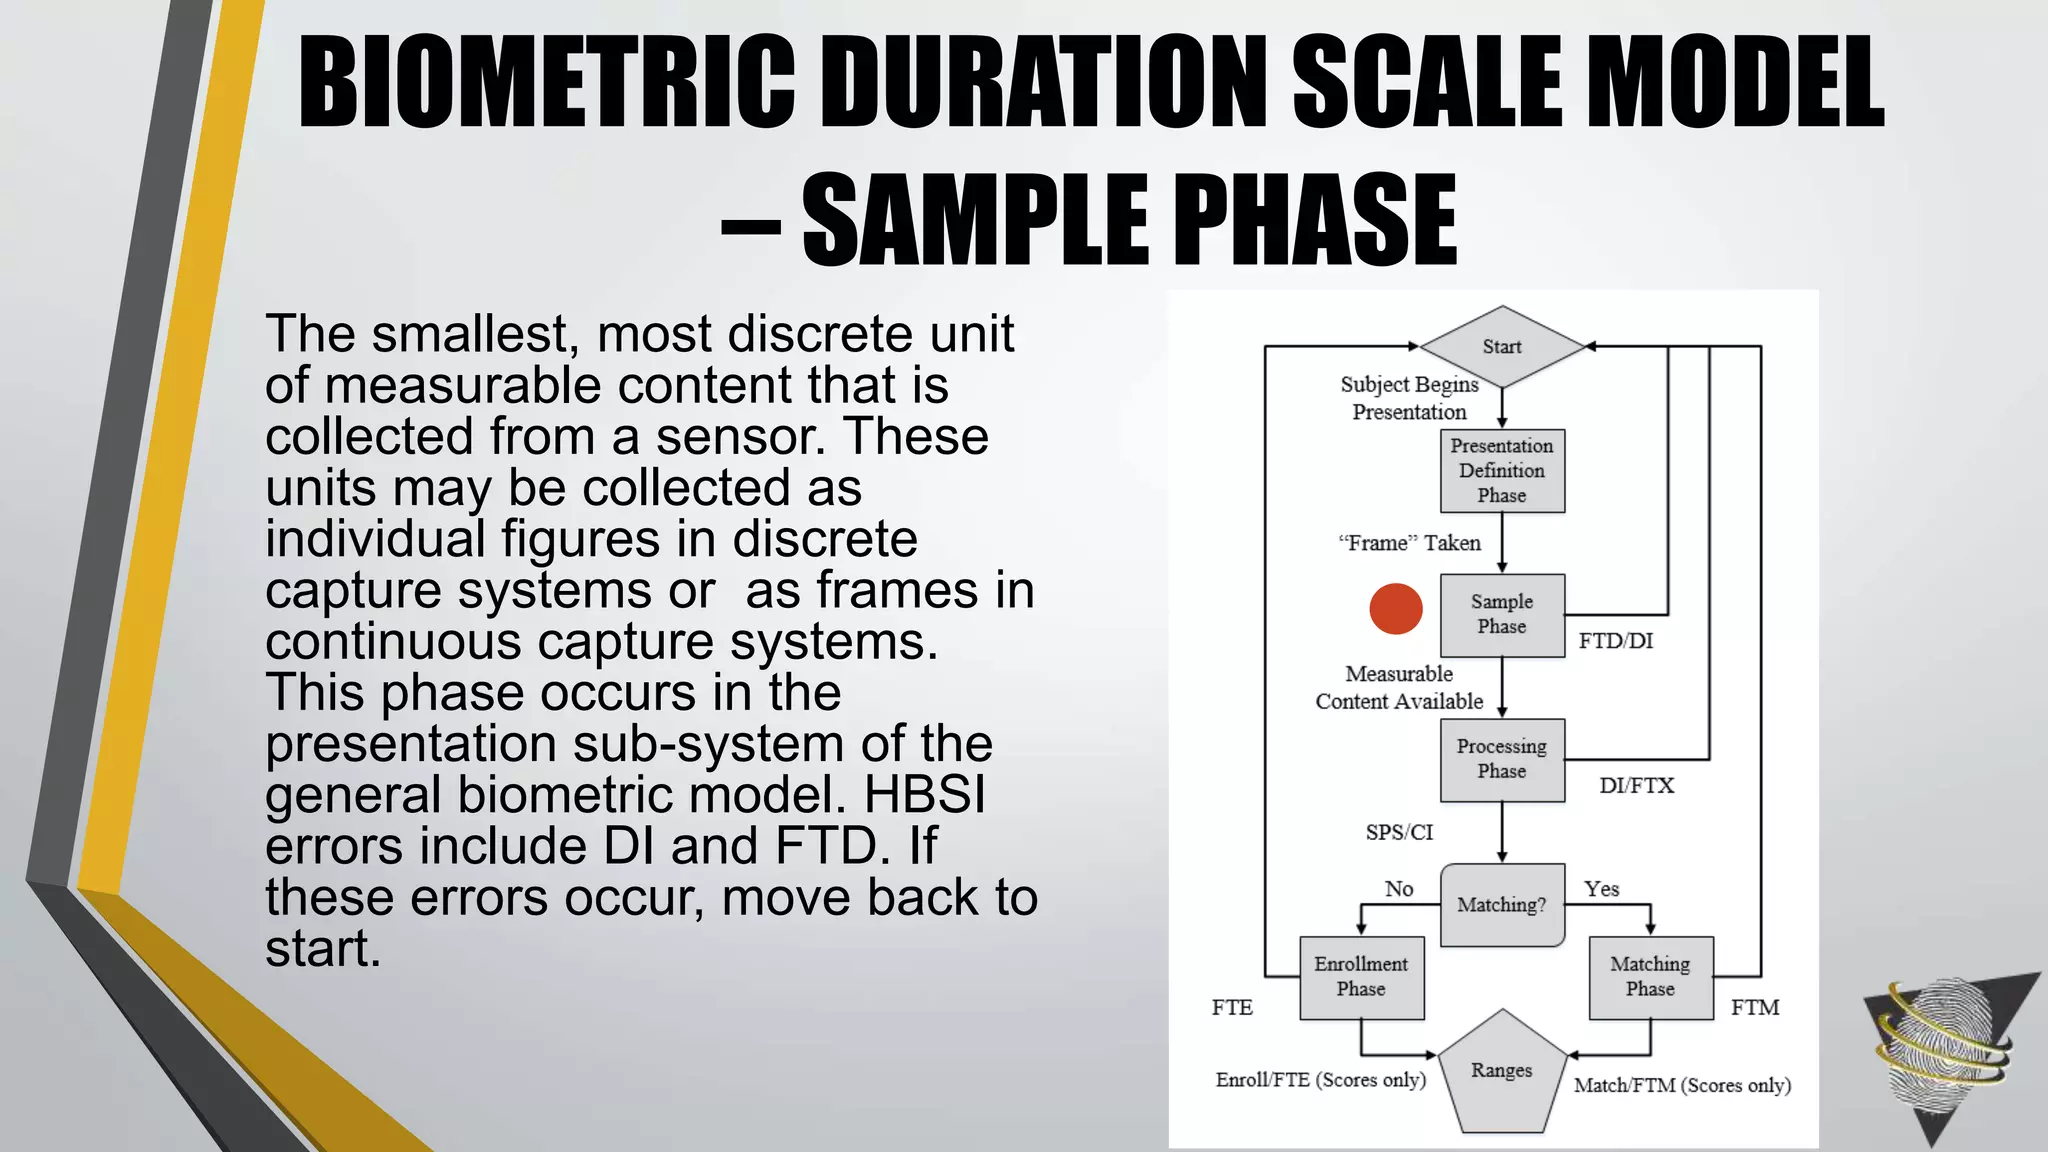
• Failure to Detect (FTD): “…the proportion of presentations to the sensor that are observed by test
personnel but are not detected by the biometric sensor” [13]. There are two types of FTD: system
and external factor.
• Failure to Extract (FTX): “…the proportion of samples that are unable to process or extract
biometric features” [13].
• Successfully Acquired Sample (SAS): “…occurs if a correct presentation is detected by the system
and if biometric features are able to be created from the sample. SAS result from presentations
where biometric features are able to be processed from the captured sample, which are then
passed to the biometric matching systems” [13].
HBSI COMPONENT DEFINITIONS](https://image.slidesharecdn.com/timingpowerpoint-150311075202-conversion-gate01/75/Best-Practices-in-Reporting-Time-Duration-in-Biometrics-35-2048.jpg)
![• Characteristic
• Detection Error Trade-Off Curve
• Enrollment
• Equal Error Rate
• Failure to Acquire
• Failure to Enroll
• False Accept Rate
• False Match
• False Match Rate
• False Non-Match
• False Non-Match Rate
• False Reject Rate
• False-Negative Identification Error
Rate
• False-Positive Identification Rate
• Feature
• Genuine Match
• Ground Truth
• Histogram
• Identification Rate
• Impostor Match
• Match
• Match Score
• Presentation
• Receiver Operating Characteristic
Curve
• Sample
• Template
• Transaction
• Zoo Plot
• Modality Specific Metrics
• Any Other Metric of Interest
METRICS THAT CAN BE EXAMINED IN
BIOMETRIC DURATION SCALE MODEL [14]](https://image.slidesharecdn.com/timingpowerpoint-150311075202-conversion-gate01/75/Best-Practices-in-Reporting-Time-Duration-in-Biometrics-63-2048.jpg)
![• [1] “Time.” [Online]. Available: http://www.merriam-webster.com/dictionary/time. [Accessed:
28-Jan-2015].
• [2] “Time.” [Online]. Available: http://www.yourdictionary.com/time. [Accessed: 28-Jan-
2015].
• [3] F. Weil, “The Meaning of Time,” 2013. [Online]. Available:
http://www.huffingtonpost.com/frank-a-weil/the-meaning-of-time_b_4351464.html.
[Accessed: 28-Jan-2015].
• [4] J. O’Connor and E. Robertson, “A History of Time: Classical Time,” School of
Mathematics and Statistics University of St. Andrews, Scotland, 2002. [Online]. Available:
http://www-history.mcs.st-and.ac.uk/HistTopics/Time_1.html.
• [5] G. Moyer, “The Gregorian Calendar,” Sci. Am., vol. 246, no. 5, pp. 144–152, May 1982.
• [6] A. Emmerson, “Things are Seldom what they Seem - Christiaan Huygens, the
Pendulum, and the Cycloid,” Horol. Sci. Newsletter., pp. 2–32, 2001.
• [7] S. A. Diddams, J. C. Bergquist, S. R. Jefferts, and C. W. Oates, “Standards of Time and
Frequency at the Outset of the 21st Century,” vol. 306, no. November, pp. 1318–1324,
2004.
• [8] E. Bullard and H. Jolly, “Gravity Measurements in Great Britian,” Geophysics. J. Int., vol.
3, no. 9, pp. 443–477, 1936.
• [9] S. J. Elliott, E. P. Kakula, and R. T. Lazarick, “Operational Times,” in Encyclopedia of
Biometrics, Springer US, 2009, pp. 1022–1025.
• [10] M. E. Brockly and S. J. Elliott, “Automatic Detection of Biometric Transaction Times,” IT
Ind., vol. 1, no. 1, pp. 1–5, 2013.
• [11] “Text of FCD 19795-2, Biometric Performance Testing and Reporting - Part 2: Testing
Methodologies for Technology and Scenario Evaluation,” ISO/IEC JTC 1/SC 37, pp. 1–42,
2006.
• [12] J. L. Wayman, “A Generalized Biometric Identification System Model,” Signals, Syst.
amp; Computer. 1997, Conf. Rec. Thirty-First Asilomar Conf., vol. 1, pp. 291–295, 1998.
• [13] S. J. Elliott, D. Phd, and E. P. Kukula, “A Definitional Framework for the Human-
Biometric Sensor Interaction Model,” pp. 1–6, 2009.
• [14] T. Dunstone and N. Yager, “Definitions,” in Biometric System and Data Analysis, T.
Dunstone and N. Yager, Eds. Springer, 2009, pp. 99–108.
• [15] Hicklin, A., Watson, C., & Ulery, B. “The Myth of Goats : How many people have
fingerprints that are hard to match?” US Department of Commerce, National Institute of
Standards and Technology, pp. 1–24, 2005.
• [16] Baker, S. E., Bowyer, K. W., Flynn, P. J., & Phillips, P. J. “Template Aging in Iris
Biometrics : Evidence of Increased False Reject Rate in ICE 2006.” In Handbook of Iris
Recognition, Springer, pp. 205–218, 2013.
• [17] Arora, S. S., Vatsa, M., & Singh, R. “On Iris Camera Interoperability” In Biometrics:
Theory, Applications, and Systems (BTAS), 2012 IEEE Fifth International Conference on,
pp. 346-352, 2012.
• [18] Connaughton, R., Sgroi, A., Bowyer, K., & Flynn, P. J. “A Multialgorithm Analysis of
Three Iris Biometric Sensors”, Information Forensics and Security, IEEE Transactions on,
vol. 7, no. 3, pp. 919–931, 2012.
REFERENCES](https://image.slidesharecdn.com/timingpowerpoint-150311075202-conversion-gate01/75/Best-Practices-in-Reporting-Time-Duration-in-Biometrics-86-2048.jpg)

The document discusses the complexities and historical development of the concept of time within the field of biometrics, highlighting inconsistencies in its application and the necessity for a standardized model. It introduces various biometric models and examines how interaction times can significantly affect system performance by detailing operational definitions and relationships between different time-related metrics. The document concludes with a call for improved integration of these models to enhance understanding and functionality in biometric systems.